Chin J Plan Ecolo
2017, 41 (
):
826-839.
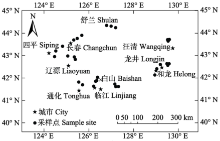
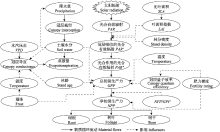
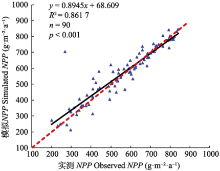
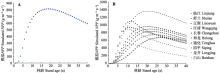
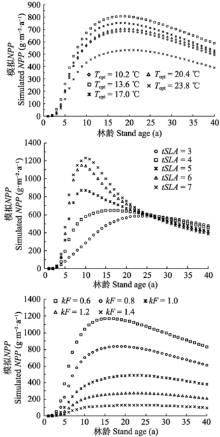
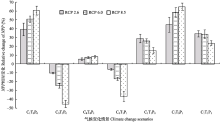
Aims Climate change has significant effects on net primary productivity (NPP) in forests, but there is a large uncertainty in the direction and magnitude of the effects. Process-based models are important tools for understanding the responses of forests to climate change. The objective of the study is to simulate changes in NPP of Larix olgensis plantations under future climate scenarios using 3-PG model in order to guide the management of L. olgensis plantations in the context of global climate change.Methods Data were obtained for 30 permanent plots of L. olgensis plantations in Siping, Linjiang, Baishan, etc. of Jilin Province, and a process model, 3-PG model, was applied to simulate changes in NPP over a rotation period of 40 years under different climate scenarios. Parameter sensitivity was also determined. Important findings The locally parameterized 3-PG model well simulates the changes in NPP against the measured NPP data, with values between 272.79-844.80 g·m-2·a-1 and both mean relative error and relative root mean square error within 12%. The NPP in L. olgensis plantations would increase significantly with increases in atmospheric CO2 concentration, temperature and precipitation collectively. However, an increase in temperature alone would lead to a decrease in NPP, but increases in precipitation and atmospheric CO2 concentration would increase NPP; the positive effect of increasing precipitation appears to be weaker than the negative effect of increasing temperature. Sensitivity analysis shows that the model performance is sensitive to the optimum temperature, stand age at which specific leaf area equals to half of the sum of specific leaf area at age 0 (SLA0) and that for mature leaves (SLA1), and days of production loss due to frost.