
植物生态学报 ›› 2011, Vol. 35 ›› Issue (12): 1256-1270.DOI: 10.3724/SP.J.1258.2011.01256
高利霞, 毕润成, 闫明*( )
)
收稿日期:2011-05-09
接受日期:2011-09-16
出版日期:2011-05-09
发布日期:2011-12-15
通讯作者:
闫明
作者简介:*(E-mail:mycorrhiza@sina.com)
GAO Li-Xia, BI Run-Cheng, YAN Ming*()
Received:2011-05-09
Accepted:2011-09-16
Online:2011-05-09
Published:2011-12-15
Contact:
YAN Ming
摘要:
物种多度格局分析对理解群落结构具有重要的意义。该文首次选用描述种-多度关系的生态位模型(生态位优先模型NPM、分割线段模型BSM、生态位重叠模型ONM)、生物统计模型(对数级数分布模型LSD、对数正态分布模型LN)以及中性理论模型NT, 对山西霍山油松(Pinus tabulaeformis)林的物种数量关系进行了拟合研究, 并采用卡方(χ2)检验、Likelihood-ratios (L-R)检验、Kolmogorov-Smirnov (K-S)检验和赤池信息量准则(AIC)选择最适合模型, 结果表明: (1)描述乔木层物种多度格局的最优生态位模型为NPM (3种检验方法均接受该模型, p > 0.05, 且该模型具有最小的 AIC值), ONM的拟合效果次之, 不服从BSM; 三种生态位模型均可较好地拟合灌木层物种多度格局; ONM是草本层最佳生态位模型, BSM、NPM拟合效果较差; LSD可以描述油松林各层物种多度结构; LN可以很好地解释灌草层物种数量关系; NT不能解释油松林任何层次的物种多度结构。(2)霍山油松林乔木层和灌木层的物种丰富度和物种多样性均明显小于草本层; 该群落物种富集种少而稀疏种多, 且群落的均匀度相对较小。(3)从该区油松林种-多度分布来看, 同一个模型可以拟合不同的物种多度数据, 相同的数据可以由不同的模型来解释。因此, 研究森林群落物种分布时, 应采用多个模型进行拟合, 同时选用多种方法筛选最优模型。
高利霞, 毕润成, 闫明. 山西霍山油松林的物种多度分布格局. 植物生态学报, 2011, 35(12): 1256-1270. DOI: 10.3724/SP.J.1258.2011.01256
GAO Li-Xia, BI Run-Cheng, YAN Ming. Species abundance distribution patterns of Pinus tabulaeformis forest in Huoshan Mountain of Shanxi Province, China. Chinese Journal of Plant Ecology, 2011, 35(12): 1256-1270. DOI: 10.3724/SP.J.1258.2011.01256
| 样地号 Plot code | 面积 Area (m2) | 海拔 Elevation (m) | 坡度 Slope | 坡向 Aspect | 郁闭度 Canopy density | 土壤类型 Soil type | 林分状况 Stand status |
|---|---|---|---|---|---|---|---|
| 1 | 400 | 1 520 | 30° | NE30° | 0.70 | 褐土 Cinnamon soil | 混交 Mixed stand |
| 2 | 600 | 1 600 | 27° | NE45° | 0.75 | 褐土 Cinnamon soil | 纯林 Pure stand |
| 3 | 400 | 1 650 | 20° | SE30° | 0.60 | 褐土 Cinnamon soil | 混交 Mixed stand |
| 4 | 600 | 1 700 | 25° | NE25° | 0.58 | 褐土 Cinnamon soil | 纯林 Pure stand |
| 5 | 400 | 1 740 | 31° | SE45° | 0.72 | 褐土 Cinnamon soil | 纯林 Pure stand |
| 6 | 400 | 1 760 | 20° | EW | 0.55 | 褐土 Cinnamon soil | 混交 Mixed stand |
| 7 | 600 | 1 800 | 25° | NS | 0.60 | 褐土 Cinnamon soil | 混交 Mixed stand |
| 8 | 600 | 1 910 | 30° | NE31° | 0.50 | 褐土 Cinnamon soil | 纯林 Pure stand |
表1 样地概况
Table 1 General situation of study sites
| 样地号 Plot code | 面积 Area (m2) | 海拔 Elevation (m) | 坡度 Slope | 坡向 Aspect | 郁闭度 Canopy density | 土壤类型 Soil type | 林分状况 Stand status |
|---|---|---|---|---|---|---|---|
| 1 | 400 | 1 520 | 30° | NE30° | 0.70 | 褐土 Cinnamon soil | 混交 Mixed stand |
| 2 | 600 | 1 600 | 27° | NE45° | 0.75 | 褐土 Cinnamon soil | 纯林 Pure stand |
| 3 | 400 | 1 650 | 20° | SE30° | 0.60 | 褐土 Cinnamon soil | 混交 Mixed stand |
| 4 | 600 | 1 700 | 25° | NE25° | 0.58 | 褐土 Cinnamon soil | 纯林 Pure stand |
| 5 | 400 | 1 740 | 31° | SE45° | 0.72 | 褐土 Cinnamon soil | 纯林 Pure stand |
| 6 | 400 | 1 760 | 20° | EW | 0.55 | 褐土 Cinnamon soil | 混交 Mixed stand |
| 7 | 600 | 1 800 | 25° | NS | 0.60 | 褐土 Cinnamon soil | 混交 Mixed stand |
| 8 | 600 | 1 910 | 30° | NE31° | 0.50 | 褐土 Cinnamon soil | 纯林 Pure stand |
| 油松林 Pinus tabulaeformis forest | 生态位优先模型 Niche preemption model | |||||||||
|---|---|---|---|---|---|---|---|---|---|---|
| K值 Kvalue | AIC值 AICvalue | χ2检验 Chi-square test | L-R检验 Likilihood-ratios test | K-S检验 Kolmogorov-Smirnov test | ||||||
| 统计量 Statistic | p值 pvalue | 统计量 Statistic | p值 pvalue | 统计量 Statistic | p值 pvalue | |||||
| 乔木层 Tree layer | 0.8 | -29.640 | 0.824 3 | 0.999 7 | 0.400 0 | 0.527 089 | 0.098 6 | 0.795 6 | ||
| 灌木层 Shrub layer | 0.5 | -237.800 | 0.528 9 | 1.000 0 | 1.441 2 | 0.229 949 | 0.807 5 | 0.907 7 | ||
| 草本层 Herb layer | 0.3 | -672.900 | 7.206 6 | 1.000 0 | 0.034 5 | 0.852 684 | 0.040 2 | 0.040 4* | ||
表2 油松林生态位优先模型参数及拟合检验结果
Table 2 Parameter and fitting test results of niche preemption model in Pinus tabulaeformis forest
| 油松林 Pinus tabulaeformis forest | 生态位优先模型 Niche preemption model | |||||||||
|---|---|---|---|---|---|---|---|---|---|---|
| K值 Kvalue | AIC值 AICvalue | χ2检验 Chi-square test | L-R检验 Likilihood-ratios test | K-S检验 Kolmogorov-Smirnov test | ||||||
| 统计量 Statistic | p值 pvalue | 统计量 Statistic | p值 pvalue | 统计量 Statistic | p值 pvalue | |||||
| 乔木层 Tree layer | 0.8 | -29.640 | 0.824 3 | 0.999 7 | 0.400 0 | 0.527 089 | 0.098 6 | 0.795 6 | ||
| 灌木层 Shrub layer | 0.5 | -237.800 | 0.528 9 | 1.000 0 | 1.441 2 | 0.229 949 | 0.807 5 | 0.907 7 | ||
| 草本层 Herb layer | 0.3 | -672.900 | 7.206 6 | 1.000 0 | 0.034 5 | 0.852 684 | 0.040 2 | 0.040 4* | ||
| 油松林 Pinus tabulaeformis forest | 分割线段模型 Broken stick model | ||||||||
|---|---|---|---|---|---|---|---|---|---|
| AIC值 AICvalue | χ2检验 Chi-square test | L-R检验 Likilihood-ratios test | K-S检验 Kolmogorov-Smirnov test | ||||||
| 统计量 Statistic | p 值 pvalue | 统计量 Statistic | p 值 pvalue | 统计量 Statistic | p 值 pvalue | ||||
| 乔木层 Tree layer | 42.650 | 21.863 6 | 0.009 3** | 24.907 7 | 0.003 1** | 0.910 4 | 0.048 5* | ||
| 灌木层 Shrub layer | -230.700 | 0.410 8 | 1.000 0 | 0.390 2 | 1.000 0 | 0.364 8 | 0.701 4 | ||
| 草本层 Herb layer | -1 719.800 | 0.022 8 | 1.000 0 | 0.019 1 | 1.000 0 | 3.797 5 | 0.057 6 | ||
表3 油松林分割线段模型的拟合检验结果
Table 3 Fitting test results of broken stick model in Pinus tabulaeformis forest
| 油松林 Pinus tabulaeformis forest | 分割线段模型 Broken stick model | ||||||||
|---|---|---|---|---|---|---|---|---|---|
| AIC值 AICvalue | χ2检验 Chi-square test | L-R检验 Likilihood-ratios test | K-S检验 Kolmogorov-Smirnov test | ||||||
| 统计量 Statistic | p 值 pvalue | 统计量 Statistic | p 值 pvalue | 统计量 Statistic | p 值 pvalue | ||||
| 乔木层 Tree layer | 42.650 | 21.863 6 | 0.009 3** | 24.907 7 | 0.003 1** | 0.910 4 | 0.048 5* | ||
| 灌木层 Shrub layer | -230.700 | 0.410 8 | 1.000 0 | 0.390 2 | 1.000 0 | 0.364 8 | 0.701 4 | ||
| 草本层 Herb layer | -1 719.800 | 0.022 8 | 1.000 0 | 0.019 1 | 1.000 0 | 3.797 5 | 0.057 6 | ||
| 油松林 Pinus tabulaeformis forest | 生态位重叠模型 Overlapping niche model | ||||||||
|---|---|---|---|---|---|---|---|---|---|
| AIC值 AICvalue | χ2检验 Chi-square test | L-R检验 Likilihood-ratios test | K-S检验 Kolmogorov-Smirnov test | ||||||
| 统计量 Statistic | p 值 pvalue | 统计量 Statistic | p 值 pvalue | 统计量 Statistic | p 值 pvalue | ||||
| 乔木层 Tree layer | -4.198 | 3.177 4 | 0.956 8 | 3.811 4 | 0.923 4 | 18.362 3 | 0.000 0 | ||
| 灌木层 Shrub layer | -197.600 | 0.827 3 | 1.000 0 | 0.800 9 | 1.000 0 | 0.865 2 | 0.820 2 | ||
| 草本层 Herb layer | -1 942.100 | 0.094 4 | 1.000 0 | 0.079 5 | 1.000 0 | 1.336 4 | 0.091 1 | ||
表4 油松林生态位重叠模型的拟合检验结果
Table 4 Fitting test results of overlapping niche model in Pinus tabulaeformis forest
| 油松林 Pinus tabulaeformis forest | 生态位重叠模型 Overlapping niche model | ||||||||
|---|---|---|---|---|---|---|---|---|---|
| AIC值 AICvalue | χ2检验 Chi-square test | L-R检验 Likilihood-ratios test | K-S检验 Kolmogorov-Smirnov test | ||||||
| 统计量 Statistic | p 值 pvalue | 统计量 Statistic | p 值 pvalue | 统计量 Statistic | p 值 pvalue | ||||
| 乔木层 Tree layer | -4.198 | 3.177 4 | 0.956 8 | 3.811 4 | 0.923 4 | 18.362 3 | 0.000 0 | ||
| 灌木层 Shrub layer | -197.600 | 0.827 3 | 1.000 0 | 0.800 9 | 1.000 0 | 0.865 2 | 0.820 2 | ||
| 草本层 Herb layer | -1 942.100 | 0.094 4 | 1.000 0 | 0.079 5 | 1.000 0 | 1.336 4 | 0.091 1 | ||
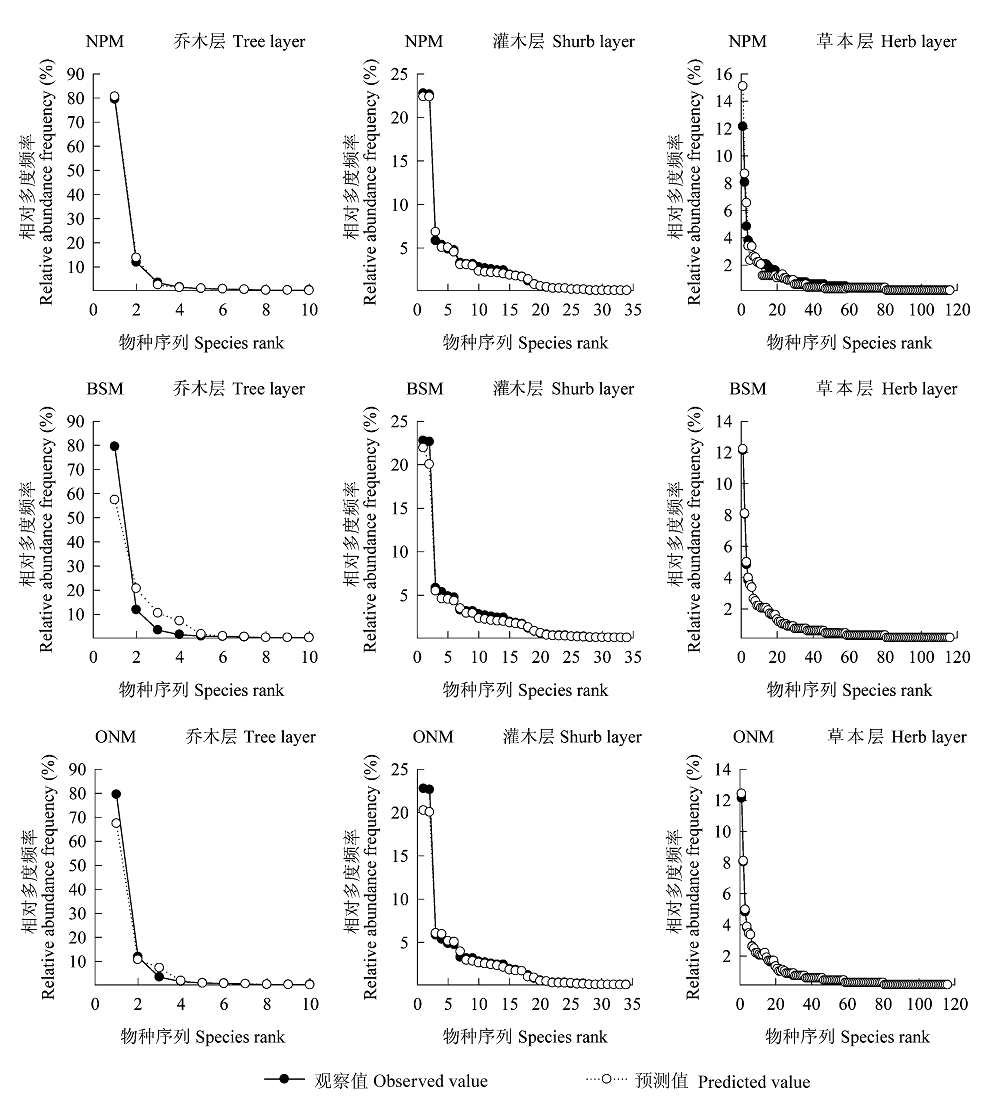
图1 油松林各层物种相对多度的生态位模型拟合检验。BSM, 分割线段模型; NPM, 生态位优先模型; ONM, 生态位重叠模型。
Fig. 1 Fitting test of different layers on species relative abundance by niche models in Pinus tabulaeformis forest. BSM, broken stick model; NPM, niche preemption model; ONM, overlapping niche model.
| 油松林 Pinus tabulaeformis forest | 对数级数分布模型 Log-series distribution model | 对数正态分布模型 Log-normal distribution model | ||||
|---|---|---|---|---|---|---|
| x值 x value | α值 α value | S值 S value | λ值 λ value | S0值 S0value | ||
| 乔木层 Tree layer | 0.973 1 | 2.766 3 | 5 | 0.333 3 | 5.330 6 | |
| 灌木层 Shrub layer | 0.846 4 | 18.149 9 | 18 | 0.474 9 | 18.131 4 | |
| 草本层 Herb layer | 0.988 6 | 22.146 0 | 25 | 0.72 | 25.228 8 | |
表5 油松林对数级数分布模型和对数正态分布模型的参数
Table 5 Parameters of log-series distribution model and log-normal distribution model in Pinus tabulaeformis forest
| 油松林 Pinus tabulaeformis forest | 对数级数分布模型 Log-series distribution model | 对数正态分布模型 Log-normal distribution model | ||||
|---|---|---|---|---|---|---|
| x值 x value | α值 α value | S值 S value | λ值 λ value | S0值 S0value | ||
| 乔木层 Tree layer | 0.973 1 | 2.766 3 | 5 | 0.333 3 | 5.330 6 | |
| 灌木层 Shrub layer | 0.846 4 | 18.149 9 | 18 | 0.474 9 | 18.131 4 | |
| 草本层 Herb layer | 0.988 6 | 22.146 0 | 25 | 0.72 | 25.228 8 | |
| 油松林 Pinus tabulaeformis forest | 对数级数分布模型 Log-series distribution model | ||||||||||||||||
|---|---|---|---|---|---|---|---|---|---|---|---|---|---|---|---|---|---|
| AIC值 AICvalue | χ2检验 Chi-square test | L-R检验 Likilihood-ratios test | K-S检验 Kolmogorov-Smirnov test | ||||||||||||||
| 统计量 Statistic | p 值 pvalue | 统计量 Statistic | p 值 pvalue | 统计量 Statistic | p 值 pvalue | ||||||||||||
| 乔木层 Tree layer | -24.970 | 4.428 6 | 0.489 5 | 5.177 1 | 0.394 7 | 3.647 2 | 0.393 631 | ||||||||||
| 灌木层 Shrub layer | 10.420 | 3.329 2 | 0.189 3 | 4.276 8 | 0.175 3 | 2.421 4 | 0.119 315 | ||||||||||
| 草本层 Herb layer | -15.640 | 0.345 5 | 0.065 7 | 1.762 8 | 0.134 2 | 2.134 1 | 0.099 300 | ||||||||||
表6 油松林对数级数分布模型的拟合检验结果
Table 6 Fitting test results of log-series distribution model in Pinus tabulaeformis forest
| 油松林 Pinus tabulaeformis forest | 对数级数分布模型 Log-series distribution model | ||||||||||||||||
|---|---|---|---|---|---|---|---|---|---|---|---|---|---|---|---|---|---|
| AIC值 AICvalue | χ2检验 Chi-square test | L-R检验 Likilihood-ratios test | K-S检验 Kolmogorov-Smirnov test | ||||||||||||||
| 统计量 Statistic | p 值 pvalue | 统计量 Statistic | p 值 pvalue | 统计量 Statistic | p 值 pvalue | ||||||||||||
| 乔木层 Tree layer | -24.970 | 4.428 6 | 0.489 5 | 5.177 1 | 0.394 7 | 3.647 2 | 0.393 631 | ||||||||||
| 灌木层 Shrub layer | 10.420 | 3.329 2 | 0.189 3 | 4.276 8 | 0.175 3 | 2.421 4 | 0.119 315 | ||||||||||
| 草本层 Herb layer | -15.640 | 0.345 5 | 0.065 7 | 1.762 8 | 0.134 2 | 2.134 1 | 0.099 300 | ||||||||||
| 油松林 Pinus tabulaeformis forest | 对数正态分布模型 Log-normal distribution model | ||||||||||
|---|---|---|---|---|---|---|---|---|---|---|---|
| AIC值 AICvalue | χ2检验 Chi-square test | L-R检验 Likilihood-ratios test | K-S检验 Kolmogorov-Smirnov test | ||||||||
| 统计量 Statistic | p值 pvalue | 统计量 Statistic | p值 pvalue | 统计量 Statistic | p值 pvalue | ||||||
| 乔木层 Tree layer | 40.940 | 1.345 | 0.048 3* | 2.254 | 0.036 1* | 0.273 4 | 0.007 100** | ||||
| 灌木层 Shrub layer | -0.281 | 4.291 | 0.117 0 | 5.436 | 0.570 2 | 0.002 9 | 0.805 005 | ||||
| 草本层 Herb layer | 18.099 | 7.240 | 0.246 1 | 9.383 | 0.176 4 | 0.034 3 | 0.818 167 | ||||
表7 油松林对数正态分布模型的拟合检验结果
Table 7 Fitting test results of log-normal distribution model in Pinus tabulaeformis forest
| 油松林 Pinus tabulaeformis forest | 对数正态分布模型 Log-normal distribution model | ||||||||||
|---|---|---|---|---|---|---|---|---|---|---|---|
| AIC值 AICvalue | χ2检验 Chi-square test | L-R检验 Likilihood-ratios test | K-S检验 Kolmogorov-Smirnov test | ||||||||
| 统计量 Statistic | p值 pvalue | 统计量 Statistic | p值 pvalue | 统计量 Statistic | p值 pvalue | ||||||
| 乔木层 Tree layer | 40.940 | 1.345 | 0.048 3* | 2.254 | 0.036 1* | 0.273 4 | 0.007 100** | ||||
| 灌木层 Shrub layer | -0.281 | 4.291 | 0.117 0 | 5.436 | 0.570 2 | 0.002 9 | 0.805 005 | ||||
| 草本层 Herb layer | 18.099 | 7.240 | 0.246 1 | 9.383 | 0.176 4 | 0.034 3 | 0.818 167 | ||||
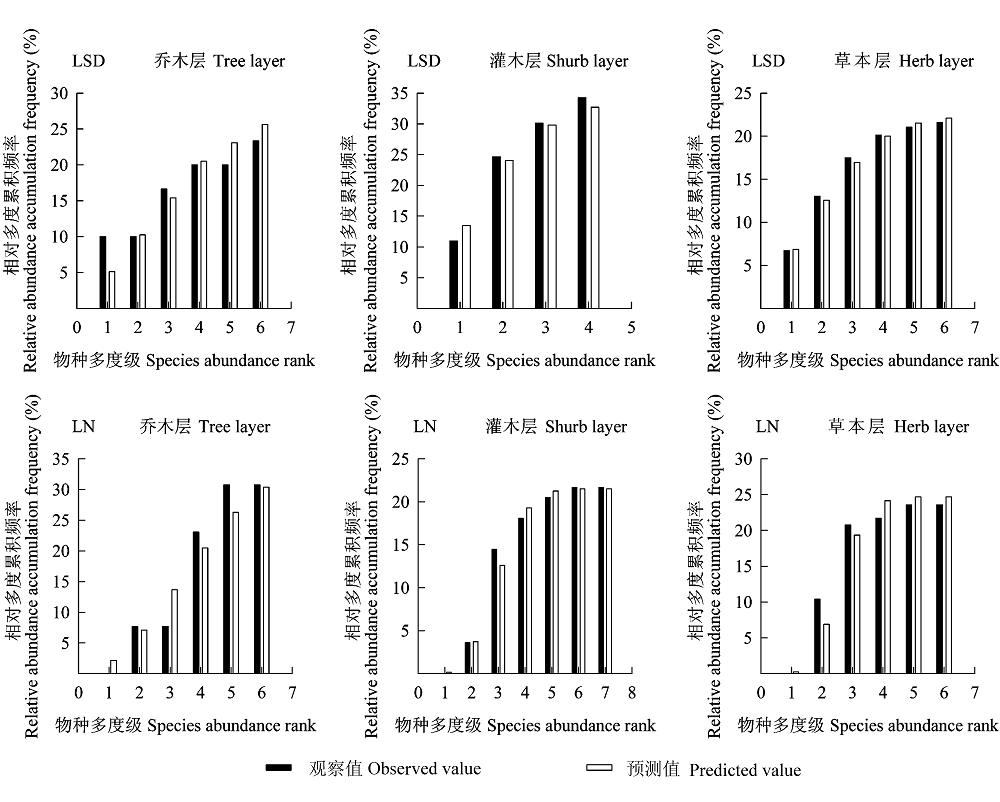
图2 油松林各层物种相对多度的统计模型拟合检验。LN, 对数正态分布模型; LSD, 对数级数分布模型。
Fig. 2 Fitting test of different layers on species relative abundance by statistical models in Pinus tabulaeformis forest. LN, log- normal distribution model; LSD, log-series distribution model.
| 油松林 Pinus tabulaeformis forest | 中性理论模型 Neutral theory model | ||||||||
|---|---|---|---|---|---|---|---|---|---|
| θ 值 θ value | m 值 m value | AIC值 AICvalue | χ2检验 Chi-square test | L-R检验 Likelihood-ratios test | K-S检验 Kolmogorov-Smirnov test | ||||
| 统计量 Statistic | p值 pvalue | 统计量 Statistic | p值 pvalue | 统计量 Statistic | p值 pvalue | ||||
| 乔木层 Tree layer | 11.32 | 0.001 78 | 52.170 | 3.867 3 | 0.037 3* | 1.649 | 0.049 8* | 0.068 9 | 0.005 60** |
| 灌木层 Shrub layer | 20.54 | 0.002 03 | -38.720 | 1.928 5 | 0.035 1* | 0.509 | 0.009 4** | 1.875 5 | 0.041 97* |
| 草本层 Herb layer | 34.07 | 0.004 76 | 15.640 | 7.206 6 | 0.042 7* | 5.624 | 0.039 8* | 0.040 2 | 0.008 50** |
表8 油松林中性理论模型参数及拟合检验结果
Table 8 Parameters and fitting test results of neutral theory model in Pinus tabulaeformis forest
| 油松林 Pinus tabulaeformis forest | 中性理论模型 Neutral theory model | ||||||||
|---|---|---|---|---|---|---|---|---|---|
| θ 值 θ value | m 值 m value | AIC值 AICvalue | χ2检验 Chi-square test | L-R检验 Likelihood-ratios test | K-S检验 Kolmogorov-Smirnov test | ||||
| 统计量 Statistic | p值 pvalue | 统计量 Statistic | p值 pvalue | 统计量 Statistic | p值 pvalue | ||||
| 乔木层 Tree layer | 11.32 | 0.001 78 | 52.170 | 3.867 3 | 0.037 3* | 1.649 | 0.049 8* | 0.068 9 | 0.005 60** |
| 灌木层 Shrub layer | 20.54 | 0.002 03 | -38.720 | 1.928 5 | 0.035 1* | 0.509 | 0.009 4** | 1.875 5 | 0.041 97* |
| 草本层 Herb layer | 34.07 | 0.004 76 | 15.640 | 7.206 6 | 0.042 7* | 5.624 | 0.039 8* | 0.040 2 | 0.008 50** |
| [1] | An SQ (安树青), Chen XL (陈兴龙), Li GQ (李国旗), Cheng XL (程晓莉) (1999). Studies on the changes of species abundance structure of the forest in Spirit Valley, Nanjing. Journal of Nanjing University (Natural Sciences) (南京大学学报(自然科学版)), 35,156-161. (in Chinese with English abstract) |
| [2] | Burnham KP, Anderson DR (2002). Model Selection and Multi-Model Inference: a Practical Information- Theoretic Approach 2nd edn. Springer-Verlag, New York. |
| [3] | Chen GC (陈光彩), Hao SC (郝士成), Li Y (李怡), Zhang HD (张宏达), Pian TH (骈铁虎) (2004). Study on natural forest stand structure of Pinus tabulaeformis in Machibei. Shanxi Forestry Science and Technology(山西林业科技), 13(4),10-13. (in Chinese with English abstract) |
| [4] | Ding XH (丁献华) (2009). Study on the plant species diversity of Pinus tabulaeformis community at Qiliyu, in Taiyue Mountain of Shanxi Province. Science & Technology Information(科技信息), 16(14),92-93. (in Chinese) |
| [5] | Du XG (杜晓光), Zhou SR (周淑荣) (2008). Testing the neutral theory of plant communities in subalpine meadow. Journal of Plant Ecology (Chinese Version) (植物生态学报), 32,347-354. (in Chinese with English abstract) |
| [6] | Fisher RA, Corbet AS, Williams CB (1943). The relation between the number of species and the number of individuals in a random sample of animal population. Journal of Animal Ecology, 12,42-58. |
| [7] | González-Estrada E, Fawcett RH, Herrero M (2002). Integrating models of relative abundance of species with the dry-weight-rank method for the botanical analysis of forest understorey vegetation. Grass and Forage Science, 57,171-183. |
| [8] | Guan YX (关玉秀), Dong SR (董世仁) (1986). Studies on ecosystem of Pinus tabulaeformis population. II. A comparison of productivity between the stands in Taiyue, Shanxi Province, and that in Chengde, Hebei Province. Journal of Beijing Forestry University(北京林业大学学报), 8(1),1-10. (in Chinese with English abstract) |
| [9] | Guo XY (郭逍宇), Zhang JT (张金屯), Gong HL (宫辉力), Zhang GL (张桂莲), Dong Z (董志) (2007). Species abundance patterns of artificial vegetation in Antaibao Open Mine. Scientia Silvae Sinicae(林业科学), 43(3),118-121. (in Chinese with English abstract) |
| [10] | Han HR (韩海荣), Ma QY (马钦彦), Nakayama N, Tamai S, Zhang HD (张宏达), Pian TH (骈铁虎) (2000). Study on the gene conserved stand of Pinus tabulaeformis in Taiyue Mountain. I. Study on the stands composition and structure. Journal of Beijing Forestry University(北京林业大学学报), 22(4),35-39. (in Chinese with English abstract) |
| [11] | Hao ZQ (郝占庆), Zhao SD (赵士洞), Tao DL (陶大立), Wang M (王淼) (1993). Species diversity of higher plants in lime Korean pine forest on northern slope of Changbai Mountain. Chinese Journal of Ecology (生态学杂志), 12,1-5. (in Chinese with English abstract) |
| [12] | Huang SX (黄三祥), Zhao XH (赵秀海) (2009). Structure and spatial patterns of main woody plant populations in a natural Pinus tabulaeformis forest in Taiyue Mountain, Shanxi Province. Forest Resources Management(林业资源管理), 4(4),41-47. (in Chinese with English abstract) |
| [13] | Hubbell SP (2001). The unified neutral theory of biodiversity and biogeography. In: Silvertown J, Amtonovics J eds. Princeton Monographs in Population Biology. Princeton University Press, Princeton, New Jersey, USA. |
| [14] | Hubbell SP (2005). Neutral theory in community ecology and the hypothesis of functional equivalence. Functional Ecology, 19,166-172. |
| [15] |
Hubbell SP (2006). Neutral theory and the evolution of ecological equivalence. Ecology, 87,1387-1398.
DOI URL PMID |
| [16] | Jiang MX (江明喜), Jin YX (金义兴), He JS (贺金生), Chen WL (陈伟烈), Shen ZH (沈泽昊) (1995). The effects of man-made disturbance on woody species diversity of second growth masson pine forest in Three Gorges Region. Resources and Environment in the Yangtze Valley(长江流域资源与环境), 4,356-361. (in Chinese with English abstract) |
| [17] | Liao CZ (廖成章), Hong W (洪伟), Wu CZ (吴承祯), Feng L (封磊), Cheng Y (程煜), Wang XG (王新功) (2004). Measurement of the species diversity of forest communities in the north Fujian. Journal of Wuhan Botanical Research(武汉植物学研究), 22,58-64. (in Chinese with English abstract) |
| [18] | Liu CR (刘灿然), Ma KP (马克平), Zhou WN (周文能) (1995). Measurement of biodiversity. III. Statistical problems in relation to species-abundance distribution models. Chinese Biodiversity(生物多样性), 3,157-169. (in Chinese with English abstract) |
| [19] | Liu WD (刘万德) (2009). Community Ecology of Tropical Monsoon Forest in Hainan Island, China (海南岛热带季雨林群落生态学研究). PhD dissertation, Institute of Forest Ecology, Environment and Protection, the Chinese Academy of Forestry, Beijing.102-119. (in Chinese with English abstract) |
| [20] | Ludwig JA, Reynolds JF (1988). Statistical Ecology. John Wiley & Sons Inc., New York. |
| [21] | Ma KP (马克平) (1994). The measurement of biotic community diversity (生物群落多样性的测度方法). In: Qian YQ (钱迎倩), Ma KP (马克平) eds. Principles and Methods in the Study of Biotic Community Diversity(生物群落多样性研究的原理与方法). Chinese Science and Technology Press, Beijing. 141-165. (in Chinese) |
| [22] | Ma KP (马克平), Liu CR (刘灿然), Yu SL (于顺利), Wang W (王巍) (1997). Plant community diversity in Dongling Mountain, Beijing, China. III. Species abundance relations of several types of forest communities. Acta Ecologica Sinica(生态学报), 17,573-583. (in Chinese with English abstract) |
| [23] | Ma XY (马晓勇), Shangguan TL (上官铁梁) (2004). Study on species diversity of the forest community in Taiyue Mountain, Shanxi. Journal of Mountain Science(山地学报), 22,606-612. (in Chinese with English abstract) |
| [24] | Ma XY (马晓勇), Shangguan TL (上官铁梁), Pang JZ (庞军柱) (2004). Study on the niche of dominate populations of the forest community in Taiyue Mountain, Shanxi. Journal of Shanxi University (Natural Science Edition) (山西大学学报(自然科学版)), 27,209-212. (in Chinese with English abstract) |
| [25] | MacArthur RH (1957). On the relative abundance of bird species. Proceedings of the National Academy of Sciences of the United States of America, 43,283-295. |
| [26] | Magurran AE (1988). Ecological Diversity and Its Measurement. Princeton University Press, New Jersey.1-79. |
| [27] | May RH (1976). Theoretical Ecology. Translated by Sun RY (孙儒泳) (1982). Science Press, Beijing. 154-159. (in Chinese) |
| [28] | May RM (1975). Patterns of species abundance and diversity. In: Cody ML, Diamond JM eds. Ecology and Evolution of Communities. Harvard University Press, Cambridge, USA. 1,81-120. |
| [29] |
McGill BJ (2003). A test of the unified neutral theory of biodiversity. Nature, 422,881-885.
DOI URL PMID |
| [30] | Miao YM (苗艳明), Liu RT (刘任涛), Bi RC (毕润成) (2008). Population structure and dynamics of Pinus tabulaeformis in Huoshan Mountain of Shanxi Province. Journal of Wuhan Botanical Research(武汉植物学研究), 26,288-293. (in Chinese with English abstract) |
| [31] | Molles MC (2000). Ecology Concepts and Applications. Science Press, Beijing.304-308. |
| [32] | Peng SL (彭少麟), Yin ZY (殷祚云), Ren H (任海), Guo QF (郭勤峰) (2003). Advances in research on the species abundance relationship models in multi-species collection. Acta Ecologica Sinica(生态学报), 23,1590-1605. (in Chinese with English abstract) |
| [33] | Pielou EC (1975). Ecological Diversity. John Wiley & Sons Inc., New York. 21-23. |
| [34] | Pielou EC (1985). Mathematical Ecology. Translated by Lu ZY (卢泽愚) (1988). 2nd edn. Science Press, Beijing. 284-302. (in Chinese) |
| [35] | Preston FW (1948). The commonness and rarity of species. Ecology, 29,254-283. |
| [36] | Ren P (任萍), Wang XA (王孝安), Guo H (郭华) (2009). Species abundance distribution pattern of forest communities on Loess Plateau. Chinese Journal of Ecology(生态学杂志), 28,1449-1455. (in Chinese with English abstract) |
| [37] | Ru WM (茹文明), Zhang JT (张金屯), Bi RC (毕润成), Zhang F (张峰), Zhang GP (张桂萍) (2005). Species diversity of undergrowths in Huoshan Mountain of Shanxi Province. Chinese Journal of Ecology(生态学杂志), 24,1139-1142. (in Chinese with English abstract) |
| [38] | Shi PL (石培礼), Li WH (李文华), Wang JX (王金锡), Liu XL (刘兴良) (2000). Species-abundance relation of herb communities in subalpine timber-line ecotone of Wolong Natural Reserve, Sichuan Province, China. Acta Ecologica Sinica(生态学报), 20,384-389. (in Chinese with English abstract) |
| [39] | Song CS (宋朝枢) (1979). Morphological characteristics and types of Pinus tabulaeformis in Taiyue Mountain in Shanxi. Scientia Silvae Sinicae(林业科学), 15,153-156. (in Chinese with English abstract) |
| [40] |
Tokeshi M (1990). Niche apportionment or random assortment: species abundance patterns revisited. Journal of Animal Ecology, 59,1129-1146.
DOI URL |
| [41] | Tokeshi M (1993). Species abundance patterns and community structure. Advances in Ecological Research, 24,111-186. |
| [42] |
Whittaker RH (1965). Dominance and diversity in land plant communities. Science, 147,250-260.
DOI URL PMID |
| [43] |
Whittaker RH (1972). Evolution and measurement of species diversity. Taxon, 21,213-351.
DOI URL |
| [44] | Whittaker RH (1975). Community and Ecosystem 2nd edn. Macmillan, New York. |
| [45] | Whittaker RH (1977). Evolution of species diversity in land plant communities. In: Recht MK, Steere WC, Wallace B eds. Evolutionary Biology. Plenum Publishing Corporation, New York. 10,1-67. |
| [46] |
Wilson JB (1991). Methods for fitting dominance/diversity curves. Journal of Vegetation Science, 2,35-46.
DOI URL |
| [47] | Wu CZ (吴承祯), Hong W (洪伟), Zheng QR (郑群瑞) (2001). Application of various patterns to the study on species relative abundance in Tsoongiodendron odorum community. Journal of Tropical and Subtropical Botany(热带亚热带植物学报), 9,235-242. (in Chinese with English abstract) |
| [48] | Xie JY (谢晋阳), Chen LZ (陈灵芝) (1997). The studies of some aspects of biodiversity on scrubs in the warm temperate zone in China. Acta Phytoecologica Sinica(植物生态学报), 21,197-207. (in Chinese with English abstract) |
| [49] | Xie JY (谢晋阳), Chen LZ (陈灵芝), Ghirelli L, Chiesura LF (1995). Biodiversity studies on Quercus ilex woods in Veneto, Italy. Acta Botanica Sinica (植物学报), 37,386-393. (in Chinese with English abstract) |
| [50] | Yan M (闫明), Bi RC (毕润成) (2009). Vegetation classification and comparative analysis of species diversity of community at different succession stages in Huoshan Mountain of Shanxi Province. Journal of Plant Resources and Environment(植物资源与环境学报), 18(3),56-62. (in Chinese with English abstract) |
| [51] | Yin ZY (殷祚云), Liao WB (廖文波) (1999). Studies on log- normal distribution patterns of species abundance of south subtropical forest community, China. Guihaia(广西植物), 19,221-224. (in Chinese with English abstract) |
| [52] | Yu LF (喻理飞), Zhu SQ (朱守谦), Wei LM (魏鲁明) (1998). A preliminary study on the species-abundance structure of Fagus lucida forest in karst platform area in Guizhou Province. Journal of Mountain Agricutural and Biology(山地农业生物学报), 1,9-15. (in Chinese with English abstract) |
| [53] | Zeng J (曾杰), Guo JT (郭景唐) (1997). Study on the first distribution of precipitation by Pinus tabulaeformis plantation in the Taiyue forest region. Journal of Beijing Forestry University(北京林业大学学报), 19(3),21-26. (in Chinese with English abstract) |
| [54] | Zeng J (曾杰), Guo JT (郭景唐), Yu ZC (于占成) (1996). A study on soil moisture content dynamics of Pinus tabulaeformis plantation in Taiyue forest region. Journal of Beijing Forestry University(北京林业大学学报), 18(2),31-36. (in Chinese with English abstract) |
| [55] | Zhang DY (张大勇), Jiang XH (姜新华) (1997). A hypothesis for the origin and maintenance of within- community species diversity. Chinese Biodiversity (生物多样性), 5,161-167. (in Chinese with English abstract) |
| [56] | Zhang JT (张金屯) (1997). Review on species abundance patterns in communities. Rural Eco-Environment(农村生态环境), 13(4),48-54. (in Chinese) |
| [57] | Zhang JT (张金屯) (1999). Species abundance patterns in some broad-leaved deciduous forests in New York, USA. Acta Phytoecologica Sinica(植物生态学报), 23,481-489. (in Chinese with English abstract) |
| [58] | Zhang XJ (张笑菁), Zhao XH (赵秀海), Kang FF (康峰峰), Wang J (王娟), He ZS (贺自书), Ma QY (马钦彦), Lu WM (卢文敏), Yao ZW (药占文) (2010). Spatial pattern of the trees in a natural Pinus tabulaeformis forest in Taiyue Mountain. Acta Ecologica Sinica(生态学报), 30,4821-4827. (in Chinese with English abstract) |
| [59] | Zhao HF (赵洪峰), Lei FM (雷富民) (2003). Bird diversity in typical degraded ecosystem in the upper reaches of Minjiang River in Sichuan. Journal of Applied and Environmental Biology(应用与环境生物学报), 9,42-48. (in Chinese with English abstract) |
| [60] | Zhao ZM (赵志模), Guo YQ (郭依泉) (1990). Principles and Methods of Community Ecology (群落生态学原理与方法). Publishing House of Scientific and Technical Documentation, Chongqing Branch, Chongqing.134-153. (in Chinese) |
| [61] | Zhou SR (周淑荣), Zhang DY (张大勇) (2006). Neutral theory in community ecology. Journal of Plant Ecology (Chinese Version) (植物生态学报), 30,868-877. (in Chinese with English abstract) |
| [1] | 胡菀,张志勇,陈陆丹,彭焱松,汪旭. 末次盛冰期以来观光木的潜在地理分布变迁[J]. 植物生态学报, 2020, 44(1): 44-55. |
| [2] | 张琴, 张东方, 吴明丽, 郭杰, 孙成忠, 谢彩香. 基于生态位模型预测天麻全球潜在适生区[J]. 植物生态学报, 2017, 41(7): 770-778. |
| [3] | 肖迪, 王晓洁, 张凯, 何念鹏, 侯继华. 氮添加对山西太岳山天然油松林主要植物叶片性状的影响[J]. 植物生态学报, 2016, 40(7): 686-701. |
| [4] | 张维康, 李贺, 王国宏. 北京西北部山地两个垂直样带内主要植被类型的群落特征[J]. 植物生态学报, 2013, 37(6): 566-570. |
| [5] | 闫琰, 张春雨, 赵秀海. 长白山不同演替阶段针阔混交林群落物种多度分布格局[J]. 植物生态学报, 2012, 36(9): 923-934. |
| [6] | 朱敬芳, 邢白灵, 居为民, 朱高龙, 柳艺博. 内蒙古草原植被覆盖度遥感估算[J]. 植物生态学报, 2011, 35(6): 615-622. |
| [7] | 张志东, 臧润国. 海南岛霸王岭热带天然林景观中主要木本植物关键种的潜在分布[J]. 植物生态学报, 2007, 31(6): 1079-1091. |
| [8] | 张金屯. 美国纽约州阔叶林物种多度格局的研究(英文)[J]. 植物生态学报, 1999, 23(6): 481-489. |
| [9] | 李海涛, 陈灵芝. 暖温带山地森林的小气候研究[J]. 植物生态学报, 1999, 23(2): 139-147. |
| [10] | 谢晋阳, 陈灵芝. 中国暖温带若干灌丛群落多样性问题的研究[J]. 植物生态学报, 1997, 21(3): 197-207. |
| 阅读次数 | ||||||
|
全文 |
|
|||||
|
摘要 |
|
|||||
Copyright © 2022 版权所有 《植物生态学报》编辑部
地址: 北京香山南辛村20号, 邮编: 100093
Tel.: 010-62836134, 62836138; Fax: 010-82599431; E-mail: apes@ibcas.ac.cn, cjpe@ibcas.ac.cn
备案号: 京ICP备16067583号-19