
植物生态学报 ›› 2007, Vol. 31 ›› Issue (6): 1079-1091.DOI: 10.17521/cjpe.2007.0136
张志东1,2, 臧润国1,*( )
)
收稿日期:2006-11-07
接受日期:2006-12-20
出版日期:2007-11-07
发布日期:2007-11-30
通讯作者:
臧润国
作者简介:* E-mail: zangrung @forestry.ac.cn基金资助:
ZHANG Zhi-Dong1,2, ZANG Run-Guo1,*()
Received:2006-11-07
Accepted:2006-12-20
Online:2007-11-07
Published:2007-11-30
Contact:
ZANG Run-Guo
摘要:
在较大的空间尺度上生态位模型是预测物种潜在分布的有效途径之一。为了探讨在热带天然林景观中木本植物(限于乔木和灌木)主要关键种的潜在分布,在对海南岛霸王岭的热带天然林进行按公里网格样方调查的基础上,采用演替地位和最大潜在高度两个功能性指标对物种进行了功能群划分,并在功能群框架下运用优势度指数法进行了关键种的确定;采用基于地理信息系统(Geographic information system, GIS)的基于规则集合预测的遗传算法(Algorithm for rule-set prediction, GARP)生态位模型对主要关键种的地理分布进行了预测,并应用受试者工作特征分析进行了模型精度验证;应用多元线性回归分析对影响各关键种潜在分布的关键因子进行了确定。结果表明:除了顶极次林层乔木功能群和顶极主林层乔木功能群外,在先锋种功能群、顶极灌木种功能群和顶极超冠层乔木功能群中采用优势度指数法划分出的关键种较为理想;一般来讲,在进行预测的8个关键种中,除了先锋主林层乔木种海南杨桐(Adinandra hainanensis),其它3个先锋种毛稔(Melastoma sanquiueum)、银柴(Aporosa chinensis)和枫香(Liquidambar formosana) 在研究区北部、西部以及西南部均具有较高的发生概率,而顶极种除了顶极超冠层乔木种南亚松(Pinus merkusii)外,九节(Psychotria rubra)、高脚罗伞(Ardisia quinquegona)和海南椎(Castanopsis hainanensis)具有相似的潜在分布格局,在研究区中部、东南部和南部地区具有较高的发生概率;相关分析表明极端最低温、年均温、极端最高温、年均降水量、海拔和坡向6大因子是影响研究区关键种潜在分布的关键因子;精度检验表明,GARP模型对8个关键种的潜在分布预测效果均较好,而其中又以银柴和海南椎的预测精度最高。
张志东, 臧润国. 海南岛霸王岭热带天然林景观中主要木本植物关键种的潜在分布. 植物生态学报, 2007, 31(6): 1079-1091. DOI: 10.17521/cjpe.2007.0136
ZHANG Zhi-Dong, ZANG Run-Guo. PREDICTING POTENTIAL DISTRIBUTIONS OF DOMINANT WOODY PLANT KEYSTONE SPECIES IN A NATURAL TROPICAL FOREST LANDSCAPE OF BAWANGLING, HAINAN ISLAND, SOUTH CHINA. Chinese Journal of Plant Ecology, 2007, 31(6): 1079-1091. DOI: 10.17521/cjpe.2007.0136
| 功能群 Functional group | 潜在最大树高 Potential maximal tree height (m) | 物种个数 Species richness | 相对多度 Relative abundance (%) | ||||||||||||||||
|---|---|---|---|---|---|---|---|---|---|---|---|---|---|---|---|---|---|---|---|
| 先锋灌木Pioneer shrub (F1) | 2~5 | 18 | 2.20 | ||||||||||||||||
| 先锋次林层乔木Pioneer subcanopy tree (F2) | 5~15 | 33 | 8.51 | ||||||||||||||||
| 先锋主林层乔木Pioneer canopy tree (F3) | 15~30 | 8 | 1.78 | ||||||||||||||||
| 先锋超冠层乔木Pioneer emergent tree (F4) | >30 | 2 | 0.43 | ||||||||||||||||
| 顶极灌木Climax shrub (F5) | 2~5 | 69 | 19.73 | ||||||||||||||||
| 顶极次林层乔木Climax subcanopy tree (F6) | 5~15 | 276 | 35.16 | ||||||||||||||||
| 顶极主林层乔木Climax canopy tree (F7) | 15~30 | 157 | 29.82 | ||||||||||||||||
| 顶极超冠层乔木Climax emergent tree (F8) | >30 | 16 | 2.38 | ||||||||||||||||
表1 功能群划分结果表
Table 1 Aggregation of 579 woody species into six functional groups in the natural forest landscape of Bawangling, Hainan Island, South China
| 功能群 Functional group | 潜在最大树高 Potential maximal tree height (m) | 物种个数 Species richness | 相对多度 Relative abundance (%) | ||||||||||||||||
|---|---|---|---|---|---|---|---|---|---|---|---|---|---|---|---|---|---|---|---|
| 先锋灌木Pioneer shrub (F1) | 2~5 | 18 | 2.20 | ||||||||||||||||
| 先锋次林层乔木Pioneer subcanopy tree (F2) | 5~15 | 33 | 8.51 | ||||||||||||||||
| 先锋主林层乔木Pioneer canopy tree (F3) | 15~30 | 8 | 1.78 | ||||||||||||||||
| 先锋超冠层乔木Pioneer emergent tree (F4) | >30 | 2 | 0.43 | ||||||||||||||||
| 顶极灌木Climax shrub (F5) | 2~5 | 69 | 19.73 | ||||||||||||||||
| 顶极次林层乔木Climax subcanopy tree (F6) | 5~15 | 276 | 35.16 | ||||||||||||||||
| 顶极主林层乔木Climax canopy tree (F7) | 15~30 | 157 | 29.82 | ||||||||||||||||
| 顶极超冠层乔木Climax emergent tree (F8) | >30 | 16 | 2.38 | ||||||||||||||||
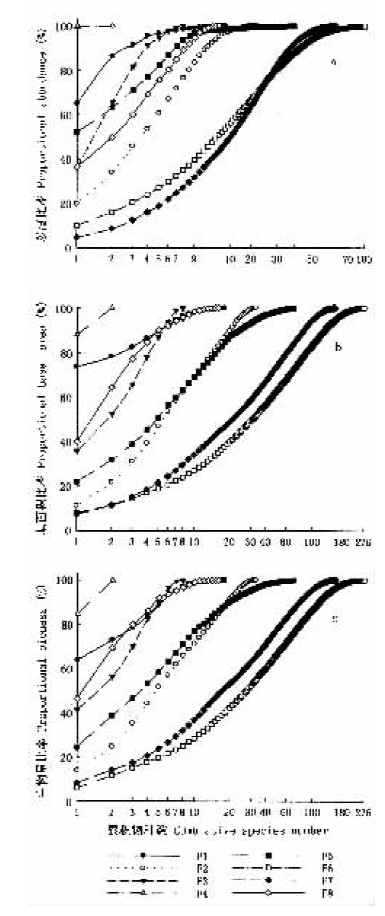
图4 多度、基面积、生物量-种累积曲线 物种数的累积顺序是按照优势度指数从大到小顺序进行排列的The cumulative rank of species in X axis is based on the rank from big DI to small DI F1~F8: 见表1 See Table 1
Fig.4 Species abundance (a), basal area (b) and biomass (c) accumulation curve based on cumulative species number in each functional group
| 功能群 Functional group | 潜在关键种 Potential keystone species | DIij (×100) | Nij | Nj |
|---|---|---|---|---|
| F1 | 1.毛稔Melastoma sanquiueum | 64.85 | 832 | 1 283 |
| 2.紫毛野牡丹Melastoma penicillatum | 21.43 | 275 | ||
| 3.野牡丹Melastoma candidum | 4.99 | 64 | ||
| F2 | 4.银柴Aporosa chinensis | 19.81 | 982 | 4 956 |
| 5.猪肚木Canthium horridum | 13.94 | 691 | ||
| 6.黄牛木Cratoxylum ligustrinum | 11.86 | 588 | ||
| F3 | 7.海南杨桐Adinandra hainanensis | 35.78 | 370 | 1 034 |
| 8.翻白叶Pterospermum heterophyllum | 29.69 | 307 | ||
| 9.拟赤杨Alniphyllum fortunei | 16.15 | 167 | ||
| F4 | 10.枫香Liquidambar formosana | 99.60 | 248 | 249 |
| 11.西南桦Betula alnoides | 0.40 | 1 | ||
| F5 | 12.九节Psychotria rubra | 51.95 | 5 967 | 11 486 |
| 13.柏拉木Blastus cochinchinensis | 11.04 | 1 268 | ||
| 14.粗叶木Lasianthus chinensis | 8.10 | 930 | ||
| F6 | 15.高脚罗伞Ardisia quinquegona | 10.11 | 2 070 | 20 469 |
| 16.粗毛野桐Mallotus hookerianus | 6.06 | 1 241 | ||
| 17.烟斗稠Lithocarpus corneus | 4.33 | 886 | ||
| F7 | 18.海南椎Castanopsis hainanensis | 4.67 | 811 | 17 360 |
| 19.中华厚壳桂Cryptocarya chinensis | 4.03 | 699 | ||
| 20.黄叶树Xanthophyllum hainanense | 3.92 | 681 | ||
| F8 | 21.南亚松Pinus merkusii | 36.38 | 505 | 1 388 |
| 22.多腺水翁Cleistocalyx conspersipunctatus | 13.40 | 186 | ||
| 23.野荔枝Litchi chinensis | 10.09 | 140 |
表2 潜在关键种确定结果表
Table 2 Identification of potential keystone species applied by dominance index
| 功能群 Functional group | 潜在关键种 Potential keystone species | DIij (×100) | Nij | Nj |
|---|---|---|---|---|
| F1 | 1.毛稔Melastoma sanquiueum | 64.85 | 832 | 1 283 |
| 2.紫毛野牡丹Melastoma penicillatum | 21.43 | 275 | ||
| 3.野牡丹Melastoma candidum | 4.99 | 64 | ||
| F2 | 4.银柴Aporosa chinensis | 19.81 | 982 | 4 956 |
| 5.猪肚木Canthium horridum | 13.94 | 691 | ||
| 6.黄牛木Cratoxylum ligustrinum | 11.86 | 588 | ||
| F3 | 7.海南杨桐Adinandra hainanensis | 35.78 | 370 | 1 034 |
| 8.翻白叶Pterospermum heterophyllum | 29.69 | 307 | ||
| 9.拟赤杨Alniphyllum fortunei | 16.15 | 167 | ||
| F4 | 10.枫香Liquidambar formosana | 99.60 | 248 | 249 |
| 11.西南桦Betula alnoides | 0.40 | 1 | ||
| F5 | 12.九节Psychotria rubra | 51.95 | 5 967 | 11 486 |
| 13.柏拉木Blastus cochinchinensis | 11.04 | 1 268 | ||
| 14.粗叶木Lasianthus chinensis | 8.10 | 930 | ||
| F6 | 15.高脚罗伞Ardisia quinquegona | 10.11 | 2 070 | 20 469 |
| 16.粗毛野桐Mallotus hookerianus | 6.06 | 1 241 | ||
| 17.烟斗稠Lithocarpus corneus | 4.33 | 886 | ||
| F7 | 18.海南椎Castanopsis hainanensis | 4.67 | 811 | 17 360 |
| 19.中华厚壳桂Cryptocarya chinensis | 4.03 | 699 | ||
| 20.黄叶树Xanthophyllum hainanense | 3.92 | 681 | ||
| F8 | 21.南亚松Pinus merkusii | 36.38 | 505 | 1 388 |
| 22.多腺水翁Cleistocalyx conspersipunctatus | 13.40 | 186 | ||
| 23.野荔枝Litchi chinensis | 10.09 | 140 |
| 环境因子图层 Environmental layer | 外部缺省误差Omission error (Ext) | |||||||
|---|---|---|---|---|---|---|---|---|
| 1 | 4 | 7 | 10 | 12 | 15 | 18 | 21 | |
| 平面曲率Plan curvature | (0.242) | (0.389) | (0.491) | (0.423) | (0.464) | (0.457) | (0.469) | (0.477) |
| 坡向Aspect (°) | (-0.282*) | (0.269) | (-0.215*) | (0.304) | (-0.321*) | (-0.201*) | (-0.187*) | (0.237) |
| 海拔Altitude (m) | 0.036 | (-0.202*) | -0.101* | (-0.200*) | (-0.209*) | (-0.198*) | (-0.202*) | (-0.078*) |
| 剖面曲率Profile curvature | (0.213) | (0.281) | (-0.151*) | 0.137 | (0.270) | (0.230) | (0.242) | (0.250) |
| 坡度Slope (°) | 0.127 | (0.309) | 0.014 | (0.298) | 0.123 | (0.171) | (0.248) | (0.241) |
| 年均降雨量Annual mean precipitation (mm) | (-0.248*) | -0.121* | -0.024* | (-0.221*) | 0.076 | -0.062* | -0.030* | -0.101* |
| 年均相对湿度Annual mean relative humidity (%) | 0.072 | (-0.242*) | 0.041 | -0.127* | -0.117* | 0.025 | -0.154* | (-0.302*) |
| 最低温度Minimum temperature (℃) | -0.123* | -0.122* | 0.064 | -0.108* | -0.077* | -0.041* | -0.069* | (-0.295*) |
| 平均温度Mean temperature (℃) | 0.020 | (-0.267*) | -0.138* | (-0.203*) | -0.033* | (-0.225*) | -0.155* | (-0.173*) |
| 最高温度Maximum temperature (℃) | -0.058* | (-0.296*) | 0.019 | (-0.303*) | (-0.176*) | -0.157* | -0.163* | (-0.255*) |
表3 环境图层(0/1)与缺省误差之间的相关分析
Table 3 Correlations between the data (0/1) of each coverage and omission error (Externa)
| 环境因子图层 Environmental layer | 外部缺省误差Omission error (Ext) | |||||||
|---|---|---|---|---|---|---|---|---|
| 1 | 4 | 7 | 10 | 12 | 15 | 18 | 21 | |
| 平面曲率Plan curvature | (0.242) | (0.389) | (0.491) | (0.423) | (0.464) | (0.457) | (0.469) | (0.477) |
| 坡向Aspect (°) | (-0.282*) | (0.269) | (-0.215*) | (0.304) | (-0.321*) | (-0.201*) | (-0.187*) | (0.237) |
| 海拔Altitude (m) | 0.036 | (-0.202*) | -0.101* | (-0.200*) | (-0.209*) | (-0.198*) | (-0.202*) | (-0.078*) |
| 剖面曲率Profile curvature | (0.213) | (0.281) | (-0.151*) | 0.137 | (0.270) | (0.230) | (0.242) | (0.250) |
| 坡度Slope (°) | 0.127 | (0.309) | 0.014 | (0.298) | 0.123 | (0.171) | (0.248) | (0.241) |
| 年均降雨量Annual mean precipitation (mm) | (-0.248*) | -0.121* | -0.024* | (-0.221*) | 0.076 | -0.062* | -0.030* | -0.101* |
| 年均相对湿度Annual mean relative humidity (%) | 0.072 | (-0.242*) | 0.041 | -0.127* | -0.117* | 0.025 | -0.154* | (-0.302*) |
| 最低温度Minimum temperature (℃) | -0.123* | -0.122* | 0.064 | -0.108* | -0.077* | -0.041* | -0.069* | (-0.295*) |
| 平均温度Mean temperature (℃) | 0.020 | (-0.267*) | -0.138* | (-0.203*) | -0.033* | (-0.225*) | -0.155* | (-0.173*) |
| 最高温度Maximum temperature (℃) | -0.058* | (-0.296*) | 0.019 | (-0.303*) | (-0.176*) | -0.157* | -0.163* | (-0.255*) |
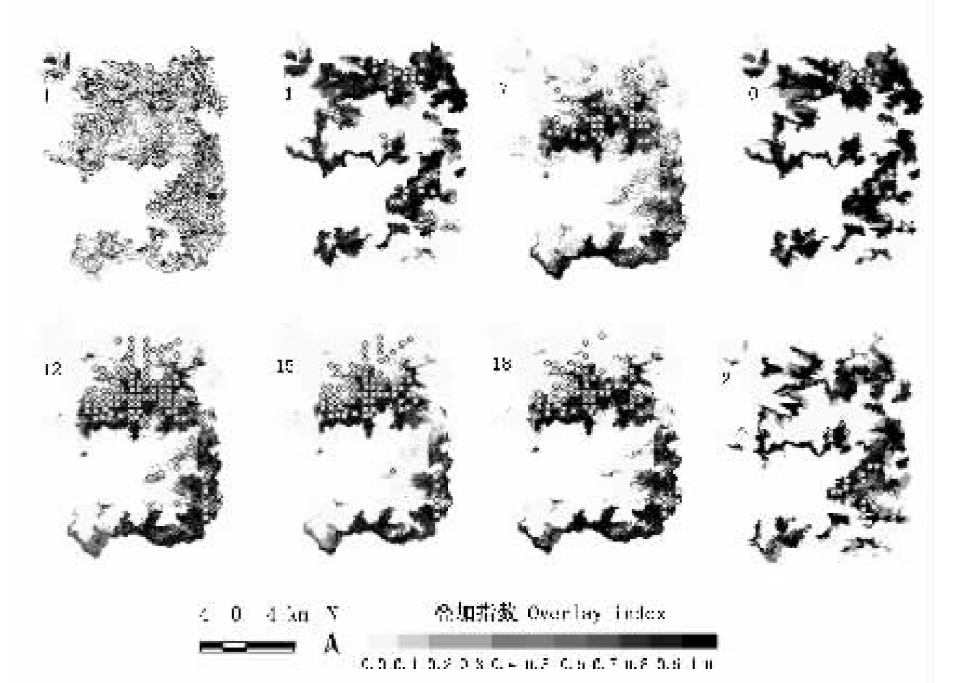
图1 海南岛霸王岭热带天然林景观中8个关键种的潜在分布图 1、4、7、10、12、15、18、21:见表2 See Table 2
Fig.1 Maps of the predicted potential distribution of eight keystone species in a tropical natural forest landscape of Bawangling, Hainan Island
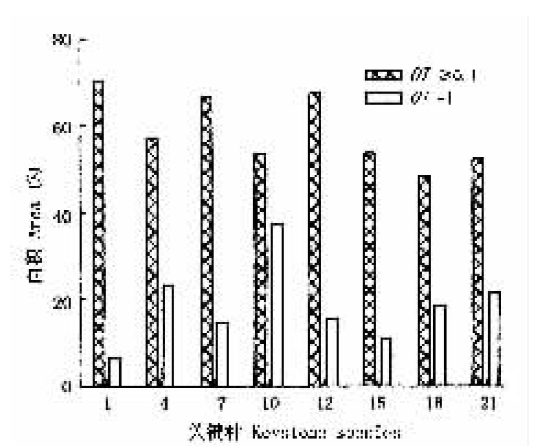
图2 各关键种潜在最大分布和最适分布比例面积 1、4、7、10、12、15、18、21:见表2 See Table 2
Fig.2 Proportional areas of maximum potential distribution and suitable distribution in each keystone species
| 关键种 Keystone species | 逐步线性回归模型 Stepwise linear regression models | 自由度 df | R2 | F | p |
|---|---|---|---|---|---|
| 1 | Y=-9.07-0.08Aspect+1.83Minimum temperature+0.73Altitude | 3 | 0.43 | 253.22 | 0.000 1 |
| 4 | Y=-29.82-1.88Minimum temperature +1.05Altitude+9.56Mean temperature | 3 | 0.42 | 241.34 | 0.000 1 |
| 7 | Y=14.62-4.21Mean temperature-0.02Slope-0.25Altitude | 3 | 0.80 | 1 296.04 | 0.000 1 |
| 10 | Y=-29.21+1.35Altitude+7.01Mean temperature | 2 | 0.36 | 276.28 | 0.000 1 |
| 12 | Y=73.64-21.54Maximum temperature-0.27Altitude | 2 | 0.70 | 1 184.38 | 0.000 1 |
| 15 | Y=22.43+1.31Minimum temperature-0.54Altitude-7.45Mean temperature | 3 | 0.73 | 907.28 | 0.000 1 |
| 18 | Y=10.62-3.44Mean temperature-0.02Aspect | 2 | 0.71 | 1 222.76 | 0.000 1 |
| 21 | Y=-188.11+5.49Minimum temperature+24.33Annual mean precipitation+0.70Altitude | 3 | 0.30 | 140.51 | 0.000 1 |
表4 关键种潜在分布与主要环境因子的逐步线性回归模型
Table 4 Stepwise linear regression models between potential distribution of each keystone species and major environmental factors
| 关键种 Keystone species | 逐步线性回归模型 Stepwise linear regression models | 自由度 df | R2 | F | p |
|---|---|---|---|---|---|
| 1 | Y=-9.07-0.08Aspect+1.83Minimum temperature+0.73Altitude | 3 | 0.43 | 253.22 | 0.000 1 |
| 4 | Y=-29.82-1.88Minimum temperature +1.05Altitude+9.56Mean temperature | 3 | 0.42 | 241.34 | 0.000 1 |
| 7 | Y=14.62-4.21Mean temperature-0.02Slope-0.25Altitude | 3 | 0.80 | 1 296.04 | 0.000 1 |
| 10 | Y=-29.21+1.35Altitude+7.01Mean temperature | 2 | 0.36 | 276.28 | 0.000 1 |
| 12 | Y=73.64-21.54Maximum temperature-0.27Altitude | 2 | 0.70 | 1 184.38 | 0.000 1 |
| 15 | Y=22.43+1.31Minimum temperature-0.54Altitude-7.45Mean temperature | 3 | 0.73 | 907.28 | 0.000 1 |
| 18 | Y=10.62-3.44Mean temperature-0.02Aspect | 2 | 0.71 | 1 222.76 | 0.000 1 |
| 21 | Y=-188.11+5.49Minimum temperature+24.33Annual mean precipitation+0.70Altitude | 3 | 0.30 | 140.51 | 0.000 1 |
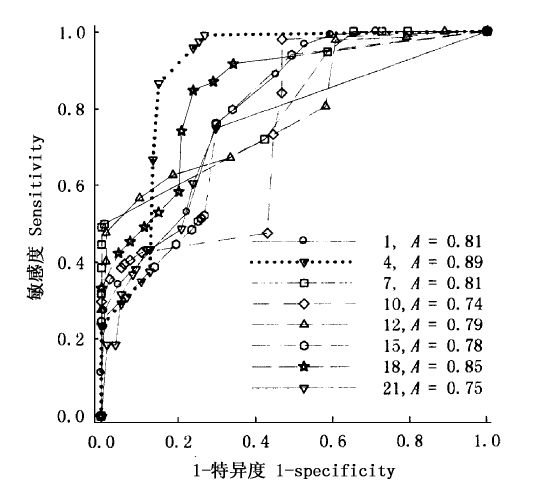
图3 GARP模型精度检验的受试者工作特征(ROC)曲线 图中A为AUC值A indicated the areas under the curves on the panels Sensitivity:敏感度,用于检验的发生数据被正确预测为存在的比率The probability of test positive localities correctly predicted present (1-extrinsic omission rate) Specificity:特异度,用于检验的未发生数据被正确预测缺失的概率The probability of test negative localities correctly predicted absent 1-specificity:适宜种生存的像元比例The proportion of all map pixels predicted to have suitable conditions for the species 1、4、7、10、12、15、18、21:见表2 See Table 2
Fig.3 The receiver operating characteristics (ROC) curve of GARP model test
| [1] | Anderson RP, Gomez-Laverde M, Peterson AT (2002). Geographical distributions of spiny pocket mice in South America: insights from predictive models. Global Ecology and Biogeography, 11,131-141. |
| [2] | Beerling DJ, Huntley B, Bailey JP (1995). Climate and the distribution of Fallopia japonica: use of an introduced species to test the predictive capacity of response surfaces. Journal of Vegetation Science, 6,269-282. |
| [3] |
Berger WH, Parker FL (1970). Diversity of planktonic foraminifera in deep sea sediments. Science, 168,1345-1347.
URL PMID |
| [4] | Blondel J (2003). Guilds or functional groups: does it matter? Oikos, 100,223-231. |
| [5] | Chazdon RL, Careaga S, Webb C, Vargas O (2003). Community and phylogenetic structure of reproductive traits of woody species in wet tropical forests. Ecological Monographs, 73,331-348. |
| [6] | Chen PF, Wiley EO, Mcnyset KM (2006). Ecological niche modeling as a predictive tool: silver and bighead carps in North America. Biological Invasions, 9,43-51. |
| [7] |
Christianou M, Ebenman B (2005). Keystone species and vulnerable species in ecological communities: strong or weak interactors? Journal of Theoretical Biology, 235,95-103.
DOI URL PMID |
| [8] | Chun WY (陈焕镛) (1964). Flora Hainanica, VolumeⅠ (海南植物志,第Ⅰ卷). Science Press, Beijing.167-362. (in Chinese) |
| [9] | Chun WY (陈焕镛) (1965). Flora Hainanica, VolumeⅡ (海南植物志,第Ⅱ卷). Science Press, Beijing.1-453. (in Chinese) |
| [10] | Coomes DA, Grubb PJ (2003). Colonization, tolerance, competition and seed-size variation within functional groups. Trends in Ecology & Evolution, 18,283-291. |
| [11] | Davic RD (2003). Linking keystone species and functional groups: a new operational definition of the keystone species concept. Conservation Ecology, 7(1),r11. http://www.consecol.org/vol17/iss11/resp11. Cited 10 Sep 2006. |
| [12] |
Ebenman B, Jonsson T (2005). Using community viability analysis to identify fragile systems and keystone species. Trends in Ecology & Evolution, 20,568-575.
DOI URL PMID |
| [13] | ESRI (2003). ARCGIS. Environmental Systems Research Institute, Inc., Redlands, California, USA. |
| [14] | Gili JM (2002). Variability of the keystone species concept in marine ecosystems. Trends in Ecology & Evolution, 17,499. |
| [15] | Guangdong Institute of Botany(广东省植物研究所) (1974). Flora Hainanica, Volume Ⅲ (海南植物志,第Ⅲ卷). Science Press, Beijing. (in Chinese) |
| [16] | Guangdong Institute of Botany(广东省植物研究所) (1977). Flora Hainanica, Volume Ⅳ (海南植物志,第Ⅳ卷). Science Press, Beijing. (in Chinese) |
| [17] | Guisan A, Thuiller W (2005). Predicting species distribution: offering more than simple habitat models. Ecology Letters, 8,993-1009. |
| [18] | Hooper DU, Chapin FS III, Ewel JJ, Hector A, Inchausti P, Lavorel S, Lawton JH, Lodge DM, Loreau M, Naeem S, Schmid B, Setälä H, Symstad AJ, Vandermeer J, Wardle DA (2005). Effects of biodiversity on ecosystem functioning: a consensus of current knowledge. Ecological Monographs, 75,3-35. |
| [19] | Hu YJ (胡玉佳), Li YX (李玉杏) (1992). Tropical Rain Forest of Hainan Island (海南岛热带雨林). Guangdong Higher Education Press, Guangzhou. (in Chinese) |
| [20] | Huang JH (黄建辉), Han XG (韩兴国) (2001). Keystone species: what is keystoneness? Acta Phytoecologica Sinica (植物生态学报), 25,505-509. (in Chinese with English abstract) |
| [21] | Hurlbert SH (1997). Functional importance vs keystoneness: reformulating some questions in theoretical biocenology. Australian Journal of Ecology, 22,369-382. |
| [22] | Hutchinson GE (1957). Concluding remarks. Cold Spring Harbor Symposium. Quantitative Biology, 22,415-427. |
| [23] | Hutchinson MF (1999). ANUDEM Version 4.6 User Guide. The Australian National University, Centre for Resource and Environmental Studies, Canberra. |
| [24] | Hutchinson MF (2000). ANUSPLIN Version 4.1 User Guide. The Australian National University, Centre for Resource and Environmental Studies, Canberra. |
| [25] | Jiang YX (蒋有绪), Wang BS (王伯荪), Zang RG (臧润国), Jin JH (金建华), Liao WB (廖文波) (2002). Biodiversity and Mechanism of Maintenance of the Tropical Forest in Hainan Island (海南岛热带林生物多样性及其形成机制). Science Press, Beijing,219-324. (in Chinese) |
| [26] | Jordan F, Takacs-Santa A, Molnar I (1999). Are liability theoretical quest for keystones. Oikos, 86,453-462. |
| [27] | Køhler P, Ditzer T, Huth A (2000). Concepts for the aggregation of tropical tree species into functional types and application to Sabah's lowland rain forest. Journal of Tropical Ecology, 16,591-602. |
| [28] | Krogh SN, Zeisset MS, Jackson E, Whitford WG (2002). Presence/absence of a keystone species as an indicator of rangeland health. Journal of Arid Environments, 50,513-519. |
| [29] | Li HM (李红梅), Han HX (韩红香), Xue DY (薛大勇) (2005). Prediction of potential geographic distribution areas for the pine bark scale, Matsucoccus matsumurae(Kuwana)(Homoptera: Margarodidae) in China using GARP modeling system. Acta Entomologica Sinica (昆虫学报), 48,95-100. (in Chinese with English abstract) |
| [30] | Li W, Wang Z, Ma Z, Tang H (1997). A regression model for the spatial distribution of red-crown crane in Yancheng Biosphere Reserve, China. Ecological Modelling, 103,115-121. |
| [31] | Li YD (李意德) (1993). Comparative analysis for biomass measurement of tropical mountain rain forest in Hainan Island, China. Acta Ecologica Sinica (生态学报), 13,313-320. (in Chinese with English abstract) |
| [32] | Loreau M (2000). Biodiversity and ecosystem functioning: recent theoretical advances. Oikos, 91,3-17. |
| [33] | Loreau M (2004). Does functional redundancy exist? Oikos, 104,606-611. |
| [34] |
Loreau M, Naeem S, Inchausti P, Bengtsson J, Grime JP, Hector A, Hooper DU, Huston MA, Raffaelli D, Schmid B, Tilman D, Wardle DA (2001). Biodiversity and ecosystem functioning: curreent knowledge and future challenges. Science, 294,804-808.
DOI URL PMID |
| [35] | Lu Y (陆阳), Li MG (李鸣光), Huang YW (黄雅文), Chen ZH (陈章和), Hu YJ (胡玉佳) (1986). Vegetation of Bawangling Gibbon Natural Reserve, in Hainan Island. Acta Phytoecologica et Geobotanica Sinica (植物生态学与地植物学学报), 10,106-114. (in Chinese with English abstract) |
| [36] | Monica P, Peterson AT (2003). Predicting the potential invasive distribution for Eupatorium adenophorum Spreng. in China. Journal of Wuhan Botanical Research (武汉植物学研究), 21,137-142. |
| [37] | Nix HA (1986). A biogeographic analysis of Australian elapid snakes. In: Longmore Red. Atlas of Australian Elapid Snakes. Australian Government Publishing Service, Canberra,4-15. |
| [38] | Paine RT (1995). A conversation on refining the concept of keystone species. Conservation Biology, 9,962-964. |
| [39] | Patterson BD (1999). Contingency and determinism in mammalian biogeography: the role of history. Journal of Mammalogy, 80,345-360. |
| [40] | Peterson AT, Cohoon KP (1999). Sensitivity of distributional prediction algorithms to geographic data completeness. Ecological Modelling, 117,159-164. |
| [41] | Peterson AT, Pages M, Kluza DA (2003). Predicting the potential invasive distributions of four alien plant species in North America. Weed Science, 51,863-868. |
| [42] |
Peterson AT, Soberon J, Sanchez-Cordero V (1999). Conservatism of ecological niches in evolutionary time. Science, 285,1265-1267.
DOI URL PMID |
| [43] | Peterson AT, Vieglais DA (2001). Predicting species invasions using ecological niche modeling: new approaches from bioinformatics atack a pressing problem. BioScience, 51,363-371. |
| [44] |
Power ME, Mills LS (1995). The keystone cops meet in Hilo. Trends in Ecology & Evolution, 10,182-184.
DOI URL PMID |
| [45] | Power ME, Tilman D, Estes JA, Menge BA, Bond WJ, Mills LS, Daily G, Castilla JC, Lubchenco J, Paine RT (1996). Changes in the quest for keystones. BioScience, 46,609-620. |
| [46] |
Raven PH, Wilson EO (1992). A fifty-year plan for biodiversity surveys. Science, 258,1099-1100.
DOI URL PMID |
| [47] | Saunders DA, Hobbs RJ, Margules CR (1991). Biological consequences of ecosystem fragmentation: a review. Conservation Biology, 5,18-32. |
| [48] | Scachetti-Pereira R (2001). Desktop GARP. www.lifemapper.org/desktopgarp. Cited 10 Feb. 2006. |
| [49] | Skidmore AK, Gauld A, Walker P (1996). Classification of kangaroo distribution using three GIS models. International Journal of Information Systems, 10,441-454. |
| [50] | SPSS (2004). SPSS for Windows, Version 13. 0, Chicago. |
| [51] | Stockman AK, Beamer DA, Bond JE (2006). An evaluation of a GARP model as an approach to predicting the spatial distribution of non-vagile invertebrate species. Diversity & Distributions, 12,81-89. |
| [52] | Stockwell DRB, Peters DP (1999). THe GARP modelling system: problems and solutions to automated spatial prediction. International Journal of Information Systems, 13,143-158. |
| [53] | Stockwell DRB, Peterson AT (2002). Effects of sample size on accuracy of species distribution models. Ecological Modelling, 148,1-13. |
| [54] |
Swenson NG (2005). Gis-based niche models reveal unifying climatic mechanisms that maintain the location of avian hybrid zones in a North American sutrue zone. Journal of Evolutionary Biology, 19,717-725.
URL PMID |
| [55] |
Swets JA (1988). Measuring the accuracy of diagnostic systems. Science, 240,1285-1293.
DOI URL PMID |
| [56] | Underwood EC, Klinger R, Moore PE (2004). Predicting patterns of non-native plant invasions in Yosemite National Park, California, USA. Diversity & Distributions, 10,447-459. |
| [57] | Voss RS, Emmons LH (1996). Mammalian diversity in neotropical lowland rainforests: a preliminary assessment. Bulletin of the American Museum of Natural History, 230,1-115. |
| [58] | Whitmore TC (1998). An Introduction to Tropical Rain Forest 2nd edn. Oxford University Press, Oxford. |
| [59] | Wiley EO, McNyset KM, Peterson AT, Robins CR, Stewart AM (2003). Niche modeling and geographic range predictions in the marine environment using a machine-learning algorithm. Oceanography, 16,120-127. |
| [60] | Willmott CJ, Matsuura K (1999). Smart interpolation of annually averaged air temperature in the United States. Journal of Applied Meteorology, 34,2577-2586. |
| [61] | Yan H (阎洪) (2003). Spline interpolation of spatial-temporal climate data for China. Geography and Geo-Information Science (地理与地理信息科学), 19,27-31. (in Chinese with English abstract) |
| [62] | Yan H (阎洪) (2004). Modeling spatial distribution of climate in China using thin plate smoothing spline interpolation. Scientia Geographica Sinica (地理科学), 24,163-169. (in Chinese with English abstract) |
| [63] | Zang RG (臧润国), An SQ (安树青), Tao JP (陶建平), Jiang YX (蒋有绪), Wang BX (王伯荪) (2004). Biodiversity and Mechanism of Maintenance of the Tropical Forest in Hainan Island (海南岛热带林生物多样性维持机制). Science Press, Beijing,1-169. (in Chinese) |
| [64] | Zang RG (臧润国), Cheng KW (成克武), Li JQ (李俊清), Zhang WY (张炜银), Chen XF (陈雪峰), Tao JP (陶建平) (2005). Conservation and Restoration of Biodiversity in Natural Forest (天然林生物多样性保育与恢复). China Science and Technology Press, Beijing,4-6. (in Chinese) |
| [1] | 吴茹茹, 刘美珍, 谷仙, 常馨月, 郭立月, 蒋高明, 祁如意. 气候变化对巨柏适宜生境分布的潜在影响和预测[J]. 植物生态学报, 2024, 48(4): 445-458. |
| [2] | 张慧玲, 张耀艺, 彭清清, 杨静, 倪祥银, 吴福忠. 中亚热带同质园不同生活型树种微量元素重吸收效率的差异[J]. 植物生态学报, 2023, 47(7): 978-987. |
| [3] | 万春燕, 余俊瑞, 朱师丹. 喀斯特与非喀斯特森林乔木叶性状及其相关性网络的差异[J]. 植物生态学报, 2023, 47(10): 1386-1397. |
| [4] | 吴秋霞, 吴福忠, 胡仪, 康自佳, 张耀艺, 杨静, 岳楷, 倪祥银, 杨玉盛. 亚热带同质园11个树种新老叶非结构性碳水化合物含量比较[J]. 植物生态学报, 2021, 45(7): 771-779. |
| [5] | 王晴晴, 高燕, 王嵘. 全球变化对食物网结构影响机制的研究进展[J]. 植物生态学报, 2021, 45(10): 1064-1074. |
| [6] | 曹嘉瑜, 刘建峰, 袁泉, 徐德宇, 樊海东, 陈海燕, 谭斌, 刘立斌, 叶铎, 倪健. 森林与灌丛的灌木性状揭示不同的生活策略[J]. 植物生态学报, 2020, 44(7): 715-729. |
| [7] | 陈思路, 蔡劲松, 林成芳, 宋豪威, 杨玉盛. 亚热带不同树种凋落叶分解对氮添加的响应[J]. 植物生态学报, 2020, 44(3): 214-227. |
| [8] | 梅孔灿, 程蕾, 张秋芳, 林开淼, 周嘉聪, 曾泉鑫, 吴玥, 徐建国, 周锦容, 陈岳民. 不同植物来源可溶性有机质对亚热带森林土壤酶活性的影响[J]. 植物生态学报, 2020, 44(12): 1273-1284. |
| [9] | 车俭, 郑洁, 蒋娅, 金毅, 乙引. 中国亚热带森林动态监测样地常绿和落叶木本被子植物谱系结构及生态习性差异[J]. 植物生态学报, 2020, 44(10): 1007-1014. |
| [10] | 胡菀,张志勇,陈陆丹,彭焱松,汪旭. 末次盛冰期以来观光木的潜在地理分布变迁[J]. 植物生态学报, 2020, 44(1): 44-55. |
| [11] | 刘晓彤, 袁泉, 倪健. 中国植物分布模拟研究现状[J]. 植物生态学报, 2019, 43(4): 273-283. |
| [12] | 张振振, 赵平, 张锦秀, 斯瑶. 亚热带常绿阔叶林散孔材和环孔材树种导管及叶片功能性状的比较[J]. 植物生态学报, 2019, 43(2): 131-138. |
| [13] | 张琴, 张东方, 吴明丽, 郭杰, 孙成忠, 谢彩香. 基于生态位模型预测天麻全球潜在适生区[J]. 植物生态学报, 2017, 41(7): 770-778. |
| [14] | 谭正洪, 于贵瑞, 周国逸, 韩士杰, 夏禹九, 前田高尚, 小杉绿子, 山野井克己, 李胜功, 太田岳史, 平田竜一, 安田幸生, 中野隆志, 小南裕志, 北村兼三, 溝口康子, 廖志勇, 赵俊福, 杨廉雁. 亚洲东部森林的小气候特征: 1. 辐射和能量的平衡[J]. 植物生态学报, 2015, 39(6): 541-553. |
| [15] | 徐婷, 曹林, 申鑫, 佘光辉. 基于机载激光雷达与Landsat 8 OLI数据的亚热带森林生物量估算[J]. 植物生态学报, 2015, 39(4): 309-321. |
| 阅读次数 | ||||||
|
全文 |
|
|||||
|
摘要 |
|
|||||
Copyright © 2022 版权所有 《植物生态学报》编辑部
地址: 北京香山南辛村20号, 邮编: 100093
Tel.: 010-62836134, 62836138; Fax: 010-82599431; E-mail: apes@ibcas.ac.cn, cjpe@ibcas.ac.cn
备案号: 京ICP备16067583号-19