
植物生态学报 ›› 2007, Vol. 31 ›› Issue (6): 1092-1102.DOI: 10.17521/cjpe.2007.0137
张志东1,2, 臧润国1,*( )
)
收稿日期:2006-04-17
接受日期:2006-07-22
出版日期:2007-04-17
发布日期:2007-11-30
通讯作者:
臧润国
作者简介:* E-mail: zangrung@forestry.ac.cn基金资助:
ZHANG Zhi-Dong1,2, ZANG Run-Guo1,*()
Received:2006-04-17
Accepted:2006-07-22
Online:2007-04-17
Published:2007-11-30
Contact:
ZANG Run-Guo
摘要:
为了探讨在热带天然林景观中不同因素对木本植物(限于乔木和灌木)功能型分布的影响,在对海南岛霸王岭的热带天然林进行样方调查的基础上,运用数量分类方法对热带天然林的木本植物进行了功能型划分,并运用冗余度分析(Redundancy analysis, RDA)分别探讨了功能型出现与否、功能型物种丰富度和功能型木本植物多度3个矩阵与环境、空间和干扰因素之间的关系。运用偏冗余度分析对影响功能型分布变化的环境、干扰、空间及其交互作用等因素进行了定量分解。结果表明:利用木材密度和潜在最大高度两个指标划分出的9个功能型,能较好的区分功能型间对生境的适应响应差异;因子分解表明,纯环境、纯人为干扰和混合的环境-人为干扰是影响3个功能型矩阵分布变化的主要因素,纯空间和与空间位置相耦合的因素相对较低;在诸多因子中,干扰类型、地形因子、土壤类型、砂砾含量、土层厚度以及经纬度坐标是影响功能型分布变化的主导因子;RDA排序分析表明,一般来讲,硬木功能型多在生境条件好和远离人为干扰的立地高发生。软木功能型则更多地出现于生境条件恶劣和人为干扰频繁的立地。而中等硬度功能型则生态幅度较宽。但除了软木灌木功能型外,其它功能型物种丰富度和木本植物多度多在土层深厚和生境条件较好的立地较高。
张志东, 臧润国. 海南岛霸王岭热带天然林景观中木本植物功能型分布的影响因素. 植物生态学报, 2007, 31(6): 1092-1102. DOI: 10.17521/cjpe.2007.0137
ZHANG Zhi-Dong, ZANG Run-Guo. INFLUENCE OF ECOLOGICAL FACTORS ON DISTRIBUTION OF WOODY PLANT FUNCTIONAL TYPES IN A NATURAL TROPICAL FOREST LANDSCAPE, BAWANGLING, HAINAN ISLAND, SOUTH CHINA. Chinese Journal of Plant Ecology, 2007, 31(6): 1092-1102. DOI: 10.17521/cjpe.2007.0137
| 功能型 Functional types | 潜在高度 Potential height (m) | 木材密度 Wood density (g·cm-3) | 物种个数 Species richness | 相对多度 Relative stem abundance (%) | |||||||||||||||||||
|---|---|---|---|---|---|---|---|---|---|---|---|---|---|---|---|---|---|---|---|---|---|---|---|
| 软木灌木Softwood shrub (L1) | 2~5 | 0.12~0.49 | 18 | 2.21 | |||||||||||||||||||
| 软木次林层乔木Softwood understory (L2) | 5~15 | 37 | 6.95 | ||||||||||||||||||||
| 软木主林层或超冠层乔木Softwood canopy or emergent (L3) | 15~40 | 20 | 3.06 | ||||||||||||||||||||
| 中等硬木灌木Medium wood shrub (M1) | 2~5 | 0.49~0.79 | 33 | 11.36 | |||||||||||||||||||
| 中等硬木次林层乔木Medium wood understory (M2) | 5~15 | 158 | 18.43 | ||||||||||||||||||||
| 中等硬木主林层或超冠层乔木Medium wood canopy or emergent (M3) | 15~40 | 109 | 21.59 | ||||||||||||||||||||
| 硬木灌木Hardwood shrub (H1) | 2~5 | 0.79~1.02 | 36 | 8.36 | |||||||||||||||||||
| 硬木次林层乔木Hardwood understory (H2) | 5~15 | 114 | 18.28 | ||||||||||||||||||||
| 硬木主林层或超冠层乔木Hardwood canopy or emergent (H3) | 15~40 | 54 | 9.75 | ||||||||||||||||||||
表1 木本植物功能型划分结果表
Table 1 Woody plant functional types
| 功能型 Functional types | 潜在高度 Potential height (m) | 木材密度 Wood density (g·cm-3) | 物种个数 Species richness | 相对多度 Relative stem abundance (%) | |||||||||||||||||||
|---|---|---|---|---|---|---|---|---|---|---|---|---|---|---|---|---|---|---|---|---|---|---|---|
| 软木灌木Softwood shrub (L1) | 2~5 | 0.12~0.49 | 18 | 2.21 | |||||||||||||||||||
| 软木次林层乔木Softwood understory (L2) | 5~15 | 37 | 6.95 | ||||||||||||||||||||
| 软木主林层或超冠层乔木Softwood canopy or emergent (L3) | 15~40 | 20 | 3.06 | ||||||||||||||||||||
| 中等硬木灌木Medium wood shrub (M1) | 2~5 | 0.49~0.79 | 33 | 11.36 | |||||||||||||||||||
| 中等硬木次林层乔木Medium wood understory (M2) | 5~15 | 158 | 18.43 | ||||||||||||||||||||
| 中等硬木主林层或超冠层乔木Medium wood canopy or emergent (M3) | 15~40 | 109 | 21.59 | ||||||||||||||||||||
| 硬木灌木Hardwood shrub (H1) | 2~5 | 0.79~1.02 | 36 | 8.36 | |||||||||||||||||||
| 硬木次林层乔木Hardwood understory (H2) | 5~15 | 114 | 18.28 | ||||||||||||||||||||
| 硬木主林层或超冠层乔木Hardwood canopy or emergent (H3) | 15~40 | 54 | 9.75 | ||||||||||||||||||||
| 变量Variable | |
|---|---|
| 环境Environmental | |
| ELEV | LATO |
| SLOP | SODE |
| ASPE | GRIT |
| POSI | BIST |
| YELO | GRAN |
| YESL | GRST |
| YECL | |
| 人为干扰 Anthropogenetic disturbance | |
| NODI | SECU |
| BURN | PLAG |
| CLCU | |
| 空间位置 Spatial situation | |
| X | X2Y |
| Y | XY2 |
| XY | X3 |
| X2 | Y3 |
| Y2 |
表2 环境、人为干扰和空间变量选择和定义
Table 2 Selection and definition of environmental, disturbance and spatial variables
| 变量Variable | |
|---|---|
| 环境Environmental | |
| ELEV | LATO |
| SLOP | SODE |
| ASPE | GRIT |
| POSI | BIST |
| YELO | GRAN |
| YESL | GRST |
| YECL | |
| 人为干扰 Anthropogenetic disturbance | |
| NODI | SECU |
| BURN | PLAG |
| CLCU | |
| 空间位置 Spatial situation | |
| X | X2Y |
| Y | XY2 |
| XY | X3 |
| X2 | Y3 |
| Y2 |
| 数据集* Data set | p | 典范特征值总和 Sum of all canonical eigenvalues | 前四轴累计贡献百分比 Cumulative percentage of canonical variance accounted for by axes 1-4 | |||
|---|---|---|---|---|---|---|
| Ⅰ | Ⅱ | Ⅲ | Ⅳ | |||
| P-A | 0.002 | 0.31 | 66.0 | 87.6 | 94.7 | 96.8 |
| SR | 0.002 | 0.48 | 82.3 | 89.3 | 94.2 | 96.6 |
| SA | 0.002 | 0.43 | 70.2 | 85.8 | 90.8 | 95.1 |
表3 对影响功能型分布的解释变量线性冗余度分析结果
Table 3 Linear redundancy analysis (RDA) of the environment-anthropogenetic disturbance-spatial influences of functional types distributions
| 数据集* Data set | p | 典范特征值总和 Sum of all canonical eigenvalues | 前四轴累计贡献百分比 Cumulative percentage of canonical variance accounted for by axes 1-4 | |||
|---|---|---|---|---|---|---|
| Ⅰ | Ⅱ | Ⅲ | Ⅳ | |||
| P-A | 0.002 | 0.31 | 66.0 | 87.6 | 94.7 | 96.8 |
| SR | 0.002 | 0.48 | 82.3 | 89.3 | 94.2 | 96.6 |
| SA | 0.002 | 0.43 | 70.2 | 85.8 | 90.8 | 95.1 |
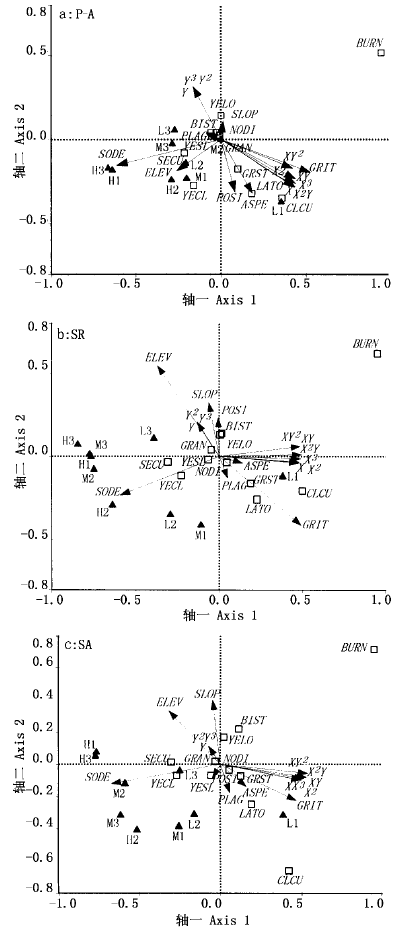
图1 解释变量和功能型的冗余度分析(RDA)得分 ▲:功能型 Functional type □:定性环境变量 Nominal environmental variables →:定量环境变量 Quantitative environmental variables 图中的简写同 表1、表2中的一致 The abbreviations on the panels are the same as in Tables 1 and 2 P-A、SR、SA: 见表3 See Table 3
Fig.1 Redundancy analysis (RDA) scores for explanatory variables and functional types
| 变量 Variables | P-A | SR | SA | |||
|---|---|---|---|---|---|---|
| 轴一 Axis 1 | 轴二 Axis 2 | 轴一 Axis 1 | 轴二 Axis 2 | 轴一 Axis 1 | 轴二 Axis 2 | |
| X | 0.335 0 | -0.141 3 | 0.421 8 | -0.017 8 | 0.427 1 | -0.054 8 |
| Y | -0.125 1 | 0.158 7 | -0.116 2 | 0.113 5 | -0.063 1 | 0.065 3 |
| XY | 0.337 9 | -0.118 1 | 0.434 6 | 0.006 8 | 0.452 6 | -0.044 7 |
| X2 | 0.333 8 | -0.142 0 | 0.420 0 | -0.019 1 | 0.424 9 | -0.055 0 |
| Y2 | -0.124 8 | 0.158 6 | -0.115 7 | 0.113 0 | -0.062 8 | 0.064 9 |
| X2Y | 0.337 2 | -0.131 5 | 0.428 7 | -0.007 1 | 0.439 7 | -0.050 3 |
| XY2 | 0.324 6 | -0.085 8 | 0.428 1 | 0.034 4 | 0.459 6 | -0.031 2 |
| X3 | 0.332 5 | -0.142 7 | 0.418 3 | -0.020 4 | 0.422 6 | -0.055 3 |
| Y3 | -0.124 6 | 0.158 5 | -0.115 2 | 0.112 5 | -0.062 4 | 0.064 4 |
| ELEV | -0.199 5 | -0.092 7 | -0.323 5 | 0.294 1 | -0.270 4 | 0.188 8 |
| SLOP | 0.010 6 | 0.056 6 | -0.053 6 | 0.176 6 | -0.040 2 | 0.225 8 |
| ASPE | 0.143 0 | -0.161 2 | 0.124 3 | -0.020 4 | 0.136 0 | -0.079 1 |
| POSI | 0.064 1 | -0.157 1 | -0.005 2 | 0.128 2 | -0.044 7 | -0.048 2 |
| YESL | -0.083 1 | 0.020 9 | -0.113 0 | -0.019 5 | -0.098 6 | -0.078 5 |
| YELO | 0.003 5 | 0.159 5 | 0.012 4 | 0.149 8 | 0.037 7 | 0.202 9 |
| YECL | -0.082 0 | -0.092 3 | -0.125 4 | -0.039 4 | -0.147 3 | -0.025 6 |
| LATO | 0.159 9 | -0.184 1 | 0.216 1 | -0.151 3 | 0.176 7 | -0.153 4 |
| SODE | -0.470 5 | -0.076 4 | -0.517 7 | -0.125 1 | -0.572 1 | -0.067 1 |
| GRIT | 0.406 2 | -0.098 2 | 0.432 2 | -0.220 9 | 0.398 7 | -0.127 3 |
| BIST | -0.035 6 | 0.016 3 | 0.011 1 | 0.057 0 | 0.073 3 | 0.094 2 |
| GRAN | -0.102 9 | 0.117 6 | -0.209 4 | 0.110 0 | -0.135 8 | 0.053 0 |
| GRST | 0.102 9 | -0.117 6 | 0.209 4 | -0.110 0 | 0.135 8 | -0.053 0 |
| NODI | -0.012 2 | 0.035 7 | 0.104 0 | -0.050 5 | 0.117 4 | -0.052 2 |
| BURN | 0.520 5 | 0.184 3 | 0.566 7 | 0.225 7 | 0.554 6 | 0.276 0 |
| CLCU | 0.171 9 | -0.109 0 | 0.259 7 | -0.065 9 | 0.215 1 | -0.223 2 |
| SECU | -0.335 2 | -0.082 1 | -0.519 6 | -0.034 | -0.506 8 | 0.014 |
| PLAG | -0.066 6 | 0.018 3 | 0.044 9 | -0.070 3 | 0.049 8 | -0.100 8 |
表4 解释变量与排序轴的相关系数
Table 4 Correlation of explanatory variables with the first two ordination axes of redundancy analysis
| 变量 Variables | P-A | SR | SA | |||
|---|---|---|---|---|---|---|
| 轴一 Axis 1 | 轴二 Axis 2 | 轴一 Axis 1 | 轴二 Axis 2 | 轴一 Axis 1 | 轴二 Axis 2 | |
| X | 0.335 0 | -0.141 3 | 0.421 8 | -0.017 8 | 0.427 1 | -0.054 8 |
| Y | -0.125 1 | 0.158 7 | -0.116 2 | 0.113 5 | -0.063 1 | 0.065 3 |
| XY | 0.337 9 | -0.118 1 | 0.434 6 | 0.006 8 | 0.452 6 | -0.044 7 |
| X2 | 0.333 8 | -0.142 0 | 0.420 0 | -0.019 1 | 0.424 9 | -0.055 0 |
| Y2 | -0.124 8 | 0.158 6 | -0.115 7 | 0.113 0 | -0.062 8 | 0.064 9 |
| X2Y | 0.337 2 | -0.131 5 | 0.428 7 | -0.007 1 | 0.439 7 | -0.050 3 |
| XY2 | 0.324 6 | -0.085 8 | 0.428 1 | 0.034 4 | 0.459 6 | -0.031 2 |
| X3 | 0.332 5 | -0.142 7 | 0.418 3 | -0.020 4 | 0.422 6 | -0.055 3 |
| Y3 | -0.124 6 | 0.158 5 | -0.115 2 | 0.112 5 | -0.062 4 | 0.064 4 |
| ELEV | -0.199 5 | -0.092 7 | -0.323 5 | 0.294 1 | -0.270 4 | 0.188 8 |
| SLOP | 0.010 6 | 0.056 6 | -0.053 6 | 0.176 6 | -0.040 2 | 0.225 8 |
| ASPE | 0.143 0 | -0.161 2 | 0.124 3 | -0.020 4 | 0.136 0 | -0.079 1 |
| POSI | 0.064 1 | -0.157 1 | -0.005 2 | 0.128 2 | -0.044 7 | -0.048 2 |
| YESL | -0.083 1 | 0.020 9 | -0.113 0 | -0.019 5 | -0.098 6 | -0.078 5 |
| YELO | 0.003 5 | 0.159 5 | 0.012 4 | 0.149 8 | 0.037 7 | 0.202 9 |
| YECL | -0.082 0 | -0.092 3 | -0.125 4 | -0.039 4 | -0.147 3 | -0.025 6 |
| LATO | 0.159 9 | -0.184 1 | 0.216 1 | -0.151 3 | 0.176 7 | -0.153 4 |
| SODE | -0.470 5 | -0.076 4 | -0.517 7 | -0.125 1 | -0.572 1 | -0.067 1 |
| GRIT | 0.406 2 | -0.098 2 | 0.432 2 | -0.220 9 | 0.398 7 | -0.127 3 |
| BIST | -0.035 6 | 0.016 3 | 0.011 1 | 0.057 0 | 0.073 3 | 0.094 2 |
| GRAN | -0.102 9 | 0.117 6 | -0.209 4 | 0.110 0 | -0.135 8 | 0.053 0 |
| GRST | 0.102 9 | -0.117 6 | 0.209 4 | -0.110 0 | 0.135 8 | -0.053 0 |
| NODI | -0.012 2 | 0.035 7 | 0.104 0 | -0.050 5 | 0.117 4 | -0.052 2 |
| BURN | 0.520 5 | 0.184 3 | 0.566 7 | 0.225 7 | 0.554 6 | 0.276 0 |
| CLCU | 0.171 9 | -0.109 0 | 0.259 7 | -0.065 9 | 0.215 1 | -0.223 2 |
| SECU | -0.335 2 | -0.082 1 | -0.519 6 | -0.034 | -0.506 8 | 0.014 |
| PLAG | -0.066 6 | 0.018 3 | 0.044 9 | -0.070 3 | 0.049 8 | -0.100 8 |
| 变异解释构成 Variance components fractions | P-A | SR | SA | |||
|---|---|---|---|---|---|---|
| TV | TVE (%) | TV | TVE (%) | TV | TVE (%) | |
| 纯环境Purely environmental (Rpe) | 0.102 | 36.13 | 0.115 | 23.96 | 0.117 | 27.21 |
| 纯干扰Pure disturbance (Rpd) | 0.072 | 23.23 | 0.105 | 21.88 | 0.102 | 23.72 |
| 纯空间Purely Spatial (Rps) | 0.039 | 12.58 | 0.040 | 8.33 | 0.034 | 7.91 |
| 混合的环境-干扰Environmental-disturbance (Red) | 0.064 | 20.65 | 0.134 | 27.92 | 0.092 | 21.40 |
| 混合的环境-空间Environmental-spatial (Res) | 0.015 | 4.84 | 0.036 | 7.50 | 0.038 | 8.84 |
| 混合的空间-干扰Spatial-disturbance (Rsd) | 0.003 | 0.97 | 0.000 | 0.00 | 0.001 | 0.23 |
| 混合的环境-空间-干扰 Environmental-spatial-disturbance (Reds) | 0.015 | 4.83 | 0.050 | 10.42 | 0.046 | 10.70 |
| 残差Residuals | 0.690 | 0.520 | 0.570 | |||
表5 利用冗余度分析(RDA)进行3个功能型矩阵的因子分解结果
Table 5 Partitioning of the variation by linear redundancy analysis (RDA) of three data matrix
| 变异解释构成 Variance components fractions | P-A | SR | SA | |||
|---|---|---|---|---|---|---|
| TV | TVE (%) | TV | TVE (%) | TV | TVE (%) | |
| 纯环境Purely environmental (Rpe) | 0.102 | 36.13 | 0.115 | 23.96 | 0.117 | 27.21 |
| 纯干扰Pure disturbance (Rpd) | 0.072 | 23.23 | 0.105 | 21.88 | 0.102 | 23.72 |
| 纯空间Purely Spatial (Rps) | 0.039 | 12.58 | 0.040 | 8.33 | 0.034 | 7.91 |
| 混合的环境-干扰Environmental-disturbance (Red) | 0.064 | 20.65 | 0.134 | 27.92 | 0.092 | 21.40 |
| 混合的环境-空间Environmental-spatial (Res) | 0.015 | 4.84 | 0.036 | 7.50 | 0.038 | 8.84 |
| 混合的空间-干扰Spatial-disturbance (Rsd) | 0.003 | 0.97 | 0.000 | 0.00 | 0.001 | 0.23 |
| 混合的环境-空间-干扰 Environmental-spatial-disturbance (Reds) | 0.015 | 4.83 | 0.050 | 10.42 | 0.046 | 10.70 |
| 残差Residuals | 0.690 | 0.520 | 0.570 | |||
| [1] | Blondel J (2003). Guilds or functional types: does it matter? Oikos, 100,223-231. |
| [2] | Borcard DP, Legendre P, Drapeau P (1992). Partialling out the spatial component of ecological variation. Ecology, 73,1045-1055. |
| [3] | Breshears DD, Barns FJ (1999). Interrelationships between plant functional types and soil moisture heterogeneity for semiarid landscapes within the grassland/forest continuum: a unified conceptual model. Landscape Ecology, 14,465-478. |
| [4] | Chen YF (陈永富), Yang XS (杨秀森) (2001). Sustainable Management for Natural Tropical Forests in Hainan Island of China (中国海南岛热带森林可持续经营). China Science and Technology Press, Beijing,251-252. (in Chinese) |
| [5] | Chapin FS III, Autumn K, Pugnaire F (1993). Evolution of suites of traits in response to environmental stress. American Naturalist, 142,S78-S92. |
| [6] | Chun WY (陈焕镛) (1964). Flora Hainanica, Volume Ⅰ (海南植物志,第一卷). Science Press, Beijing. (in Chinese) |
| [7] | Chun WY (陈焕镛) (1965). Flora Hainanica, Volume Ⅱ (海南植物志,第二卷). Science Press, Beijing. (in Chinese) |
| [8] | Clark DB, Palmer MW, Clark DA (1999). Edaphic factors and the landscape-scale distributions of tropical rain forest trees. Ecology, 80,2662-2675. |
| [9] |
Connell JH (1978). Diversity in tropical rain forests and coral reefs. Science, 199,1302-1310.
DOI URL PMID |
| [10] | Gitay H, Noble IR (1997). What are functional types and how should we seek them? In: Smith TM, Shugart HH, Woodward FIeds. Plant Functional Types: Their Relevance to Ecosystem Properties and Global Change. Cambridge University Press, Cambridge,3-19. |
| [11] | Gondard H, Sandrine J, James A, Sandra L (2003). Plant functional types: a promising tool for management and restoration of degraded lands. Applied Vegetation Science, 6,223-234. |
| [12] | Guangdong Institute of Botany(广东省植物研究所) (1974). Flora Hainanica, Volume Ⅲ (海南植物志,第三卷). Science Press, Beijing. (in Chinese) |
| [13] | Guangdong Institute of Botany(广东省植物研究所) (1977). Flora Hainanica, Volume Ⅳ (海南植物志,第四卷). Science Press, Beijing. (in Chinese) |
| [14] | Herbert DA, Rastetter EB, Shaver GR, Agren GI (1999). Effects of plant growth characteristics on biogeochemistry and community composition in a changing climate. Ecosystems, 2,367-382. |
| [15] | Hooper DU, Solano M, Symstad A, Díaz S, Gessner MQ, Buchmann N, Degrange V, Grime P, Hulot F, Mermillod-Blondin F, Roy J, Spehn E, van Peer L (2002). Species diversity, functional diversity, and ecosystem functioning. In: Loreau M, Naeem S, Inchausti Peds. Biodiversity and Ecosystem Functioning: Synthesis and Perspectives. Oxford University Press,New York,195-208. |
| [16] | Hu YJ (胡玉佳), Li YX (李玉杏) (1992). Tropical Rain Forest of Hainan Island (海南岛热带雨林). Guangdong Higher Education Press, Guangzhou,159-161. (in Chinese) |
| [17] | Jiang YX (蒋有绪), Wang BS (王伯荪), Zang RG (臧润国), Jin JH (金建华), Liao WB (廖文波) (2002). Biodiversity and Mechanism of Maintenance of the Tropical Forest in Hainan Island (海南岛热带林生物多样性及其形成机制). Science Press, Beijing,219-324. (in Chinese) |
| [18] | Joint Working Group on Hainan Timber Research(海南木材研究联合工作组) (1966). Hainan Timber: Identification, Feature and Utilization (海南木材:鉴别、材性及利用). Forestry Bureau of Guangdong Province, Guangzhou,15-356. (in Chinese) |
| [19] | Keddy PA (1992). Assembly and response rules: two goals for predictive community ecology. Journal of Vegetation Science, 3,157-164. |
| [20] | Køhler P, Ditzer T, Huth A (2000). Concepts for the aggregation of tropical tree species into functional types and application to Sabah's lowland rain forest. Journal of Tropical Ecology, 16,591-602. |
| [21] | Lavorel S, Cramer W (1999). Functional response of vegetation to land use and disturbance. Journal of Vegetation Science, 10,604-732. |
| [22] | Lavorel S, Garnier E (2002). Predicting changes in community composition and ecosystem functioning from plant traits: revisiting the Holy Grail. Functional Ecology, 16,545-556. |
| [23] | Legendre P, Legendre L (1998). Numerical Ecology: Developments in Environmental Modelling. Elsevier, Smsterdam , the Netherlands. |
| [24] | Lu Y (陆阳), Li MG (李鸣光), Huang YW (黄雅文), Chen ZH (陈章和), Hu YJ (胡玉佳) (1986). Vegetation of Bawangling gibbon natural reserve, in Hainan Island. Acta Phytoecologica et Geobotanica Sinica (植物生态学与地植物学学报), 10,106-114. (in Chinese with English abstract) |
| [25] | Marrs RH, Le Duc MG (2000). Factors controlling vegetation change in long-term experiments designed to restore heathland in Breckland, UK. Applied Vegetation Science, 3,135-146. |
| [26] | Mcintyre S, Lavorel S, Landsberg J, Forbes TDA (1999). Disturbance response in vegetation towards a global perspective on functional traits. Journal of Vegetation Science, 10,621-630. |
| [27] | Michael CW, Thomas AS (2001). Influences of environment and disturbance on forest patterns in coastal Oregon watersheds. Ecology, 82,1443-1459. |
| [28] | Noss RF (1990). Indicators for monitoring biodiversity: a hierarchical approach. Conservation Biology, 4,355-364. |
| [29] | Paruelo JM, Jobbágy EG, Sala OE (2001). Current distribution of ecosystem functional types in temperate South America. Ecosystems, 4,683-698. |
| [30] | Prentice IC, Webb TI (1998). BIOME 6000: reconstructing global mid-Holocene vegetation patterns from palaeoecological records. Journal of Biogeography, 25,997-1005. |
| [31] | Økland RH (2003). Partitioning the variation in a plot-by-species data matrix that is related to n sets of explanatory variables. Journal of Vegetation Science, 14,693-700. |
| [32] | Real R, Barbosa AM, Porras D, Kin MS, Márquez AL, Guerrero JC, Palomo LJ, Justo ER, Vargas JM (2003) Relative importance of environment, human activity and spatial situation in determining the distribution of terrestrial mammal diversity in Argentina. Journal of Biogeography, 30,939-947. |
| [33] | Reyes G, Brown S, Chapman J, Lugo AE (1992). Wood Densities of Tropical Tree Species. General Technical Report SO-88, LA. USDA Forest Service, Washington DC, New Orleans,1-14. |
| [34] | Shen ZH (沈泽昊), Zhang XS (张新时) (2000). The spatial pattern and topographic interpretation of the forest vegetation at Dalaoling region in the Three Gorges. Acta Botanica Sinica (植物学报), 42,1089-1095. (in Chinese with English abstract) |
| [35] | Suzuki E (1999). Diversity in specific gravity and water content of wood among Bornean tropical rainforest trees. Ecological Research, 14,211-224. |
| [36] | Svenning JC, Kinner DA, Stallard RF, Engelbrecht BMJ, Wright SJ (2004). Ecological determinism in plant community structure across a tropical forest landscape. Ecology, 85,2526-2538. |
| [37] | Swaine MD, Whitmore TC (1988). On the definition of ecological species groups in tropical forests. Vegetatio, 75,81-86. |
| [38] | ter Steege H, Hammond DS (2001). Character convergence, diversity, and disturbance in tropical rain forest in Guyana. Ecology, 82,3197-3212. |
| [39] | Verburg R, van Eijk-Bos C (2003). Effects of selective logging on tree diversity, composition and plant functional type patterns in a Bornean rain forest. Journal of Vegetation Science, 14,99-110. |
| [40] | Webb CO, Peart DR (2000). Habitat associations of trees and seedings in a Bornean rain forests. Journal of Ecology, 88,464-478. |
| [41] | Zang RG (臧润国), An SQ (安树青), Tao JP (陶建平), Jiang YX (蒋有绪), Wang BX (王伯荪) (2004). Biodiversity and Mechanism of Maintenance of the Tropical Forest in Hainan Island (海南岛热带林生物多样性维持机制). Science Press, Beijing,1-169. (in Chinese) |
| [42] | Zang RG (臧润国), Cheng KW (成克武), Li JQ (李俊清), Zhang WY (张炜银), Chen XF (陈雪峰), Tao JP (陶建平) (2005). Conservation and Restoration of Biodiversity in Natural Forest (天然林生物多样性保育与恢复). China Science and Technology Press, Beijing,4-6. (in Chinese) |
| [1] | 俞庆水 倪晓凤 吉成均 朱江玲 唐志尧 方精云. 10年氮磷添加对海南尖峰岭两种热带雨林优势植物叶片非结构性碳水化合物的影响[J]. 植物生态学报, 2024, 48(预发表): 0-0. |
| [2] | 朱华, 谭运洪. 中国热带雨林的群落特征、研究现状及问题[J]. 植物生态学报, 2023, 47(4): 447-468. |
| [3] | 赵长兴, 赵维俊, 张兴林, 刘思敏, 牟文博, 刘金荣. 祁连山排露沟流域青海云杉种群种内竞争与促进作用分析[J]. 植物生态学报, 2022, 46(9): 1027-1037. |
| [4] | 陈世苹, 游翠海, 胡中民, 陈智, 张雷明, 王秋凤. 涡度相关技术及其在陆地生态系统通量研究中的应用[J]. 植物生态学报, 2020, 44(4): 291-304. |
| [5] | 罗金环, 谭照远, 陈斌, 陈广武, 姜凯, 何奇芳, 张辉. 银合欢成功入侵热带雨林先锋群落的关键因素[J]. 植物生态学报, 2020, 44(12): 1215-1223. |
| [6] | 郭杰, 张琴, 孙成忠, 文检, 谢彩香. 人参药材中人参皂苷的空间变异性及影响因子[J]. 植物生态学报, 2017, 41(9): 995-1002. |
| [7] | 韦博良, 袁志良, 牛帅, 刘霞, 贾宏汝, 叶永忠. 河南省宝天曼锐齿槲栎林树木死亡对空间格局及种间相关性的影响[J]. 植物生态学报, 2017, 41(4): 430-438. |
| [8] | 葛结林, 熊高明, 李家湘, 徐文婷, 赵常明, 卢志军, 李跃林, 谢宗强. 中国南方灌丛凋落物现存量[J]. 植物生态学报, 2017, 41(1): 5-13. |
| [9] | 张炜平,潘莎,贾昕,储诚进,肖洒,林玥,白燕远,王根轩. 植物间正相互作用对种群动态和群落结构的影响: 基于个体模型的研究进展[J]. 植物生态学报, 2013, 37(6): 571-582. |
| [10] | 黄运峰,路兴慧,臧润国,丁易,龙文兴,王进强,杨民,黄运天. 海南岛热带低地雨林刀耕火种弃耕地自然恢复过程中的群落构建[J]. 植物生态学报, 2013, 37(5): 415-426. |
| [11] | 徐丽,于书霞,何念鹏,温学发,石培礼,张扬建,代景忠,王若梦. 青藏高原高寒草地土壤碳矿化及其温度敏感性[J]. 植物生态学报, 2013, 37(11): 988-997. |
| [12] | 吕振江, 王冬梅, 李登武. 基于层次-向量法分析的普通鹿蹄草品质与生态因子的相关性[J]. 植物生态学报, 2012, 36(9): 992-1003. |
| [13] | 马红媛, 吕丙盛, 杨昊谕, 闫超, 梁正伟. 松嫩平原退化草地羊草种子萌发对环境因子的响应[J]. 植物生态学报, 2012, 36(8): 812-818. |
| [14] | 黄运峰,丁易,臧润国,李小成,邹正冲,韩文涛. 海南岛霸王岭热带低地雨林树木的空间格局[J]. 植物生态学报, 2012, 36(4): 269-280. |
| [15] | 朱华. 云南热带季雨林及其与热带雨林植被的比较[J]. 植物生态学报, 2011, 35(4): 463-470. |
| 阅读次数 | ||||||
|
全文 |
|
|||||
|
摘要 |
|
|||||
Copyright © 2026 版权所有 《植物生态学报》编辑部
地址: 北京香山南辛村20号, 邮编: 100093
Tel.: 010-62836134, 62836138; Fax: 010-82599431; E-mail: apes@ibcas.ac.cn, cjpe@ibcas.ac.cn
备案号: 京ICP备16067583号-19
![]()