
植物生态学报 ›› 2020, Vol. 44 ›› Issue (1): 44-55.DOI: 10.17521/cjpe.2018.0258
胡菀1,*( ),张志勇1,陈陆丹1,彭焱松1,汪旭2
收稿日期:2018-10-17
修回日期:2019-01-17
出版日期:2020-01-20
发布日期:2020-03-26
通讯作者:
胡菀
基金资助:
HU Wan1,*(),ZHANG Zhi-Yong1,CHEN Lu-Dan1,PENG Yan-Song1,WANG Xu2
Received:2018-10-17
Revised:2019-01-17
Online:2020-01-20
Published:2020-03-26
Contact:
HU Wan
Supported by:摘要:
观光木(Tsoongiodendron odorum)是木兰科的古老残遗物种, 目前正面临严峻的生存威胁, 属于极小种群濒危植物。通过生态位模型(ENM)能够重建观光木地理分布格局的历史变迁, 探究气候变化对该物种分布的影响, 并了解其地理分布与气候需求间的关系, 从而为全球变暖背景下观光木的保护提供理论基础。该文基于96条现代分布记录和8个环境变量, 采用最大熵(MaxEnt)模型模拟观光木在末次盛冰期、全新世中期、现代和未来(2061-2080年, RCP 8.5)的潜在分布区, 利用SDM toolbox分析观光木的地理空间变化, 并综合贡献率、置换重要值和Jackknife检验来评估气候因子的重要性。研究结果表明: (1)观光木的高度适生区在南岭地区, 末次盛冰期时没有大尺度向南退缩, 很可能在山区避难所原地存活; (2)在全新世中期和未来两个增温的气候情境下, 观光木的分布区均表现为缩减, 其中未来分布的减幅更大, 表明气候变暖对观光木的生长有一定的负面影响; (3)总体上看, 观光木各个时期的地理分布范围相对稳定, 说明观光木对气候变化有一定的适应能力, 人为活动或自身繁育问题可能是致濒的重要原因, 并建议对广东和广西群体进行优先保护。
胡菀,张志勇,陈陆丹,彭焱松,汪旭. 末次盛冰期以来观光木的潜在地理分布变迁. 植物生态学报, 2020, 44(1): 44-55. DOI: 10.17521/cjpe.2018.0258
HU Wan,ZHANG Zhi-Yong,CHEN Lu-Dan,PENG Yan-Song,WANG Xu. Changes in potential geographical distribution of Tsoongiodendron odorum since the Last Glacial Maximum. Chinese Journal of Plant Ecology, 2020, 44(1): 44-55. DOI: 10.17521/cjpe.2018.0258
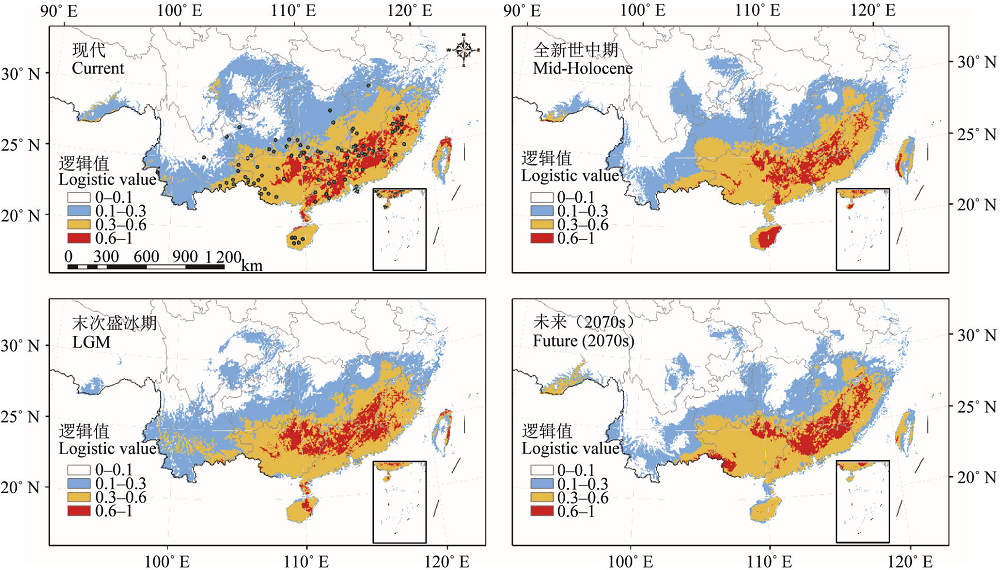
图1 观光木的现代分布点(黑色点)和MaxEnt模型预测的不同时期观光木潜在分布区。
Fig. 1 Occurrence points (black dots) and potential distribution of Tsoongiodendron odorum simulated by MaxEnt in different periods.
| 气候变量 Variable | 描述 Description | PC (%) | PI (%) | RTGW | RTGO | TGW | TGO | AUCW | AUCO |
|---|---|---|---|---|---|---|---|---|---|
| bio01 | 年平均气温 Annual mean temperature | 7.3 | 17.2 | 2.051 3 | 1.788 7 | 2.117 3 | 1.900 8 | 0.956 3 | 0.945 7 |
| bio02 | 昼夜温差月均值 Mean diurnal range | 0.3 | 0.3 | 2.075 3 | 1.358 2 | 2.129 2 | 1.445 2 | 0.956 6 | 0.899 9 |
| bio03 | 等温性 Isothermality | 7.7 | 9.7 | 2.003 0 | 0.176 0 | 2.098 3 | 0.173 3 | 0.955 0 | 0.660 6 |
| bio07 | 年平均气温变化范围 Temperature annual range | 2.8 | 25.7 | 2.054 8 | 1.409 5 | 2.105 1 | 1.503 7 | 0.955 4 | 0.904 9 |
| bio10 | 最暖季平均气温 Mean temperature of warmest quarter | 1.2 | 2.7 | 2.072 1 | 1.046 4 | 2.131 3 | 1.128 5 | 0.956 8 | 0.876 8 |
| bio12 | 年降水量 Annual precipitation | 55.2 | 40.2 | 2.041 5 | 1.744 2 | 2.103 7 | 1.852 4 | 0.955 5 | 0.942 2 |
| bio17 | 最干季降水量 Precipitation of driest quarter | 25 | 2.4 | 2.065 4 | 1.452 0 | 2.109 3 | 1.512 8 | 0.955 8 | 0.911 2 |
| bio18 | 最暖季降水量 Precipitation of warmest quarter | 0.7 | 1.9 | 2.061 3 | 1.463 5 | 2.128 3 | 1.590 2 | 0.957 0 | 0.922 9 |
表1 观光木分布预测使用的气候变量及其重要性参数
Table 1 Environmental variables and their importance parameters used in distribution predicting of Tsoongiodendron odorum
| 气候变量 Variable | 描述 Description | PC (%) | PI (%) | RTGW | RTGO | TGW | TGO | AUCW | AUCO |
|---|---|---|---|---|---|---|---|---|---|
| bio01 | 年平均气温 Annual mean temperature | 7.3 | 17.2 | 2.051 3 | 1.788 7 | 2.117 3 | 1.900 8 | 0.956 3 | 0.945 7 |
| bio02 | 昼夜温差月均值 Mean diurnal range | 0.3 | 0.3 | 2.075 3 | 1.358 2 | 2.129 2 | 1.445 2 | 0.956 6 | 0.899 9 |
| bio03 | 等温性 Isothermality | 7.7 | 9.7 | 2.003 0 | 0.176 0 | 2.098 3 | 0.173 3 | 0.955 0 | 0.660 6 |
| bio07 | 年平均气温变化范围 Temperature annual range | 2.8 | 25.7 | 2.054 8 | 1.409 5 | 2.105 1 | 1.503 7 | 0.955 4 | 0.904 9 |
| bio10 | 最暖季平均气温 Mean temperature of warmest quarter | 1.2 | 2.7 | 2.072 1 | 1.046 4 | 2.131 3 | 1.128 5 | 0.956 8 | 0.876 8 |
| bio12 | 年降水量 Annual precipitation | 55.2 | 40.2 | 2.041 5 | 1.744 2 | 2.103 7 | 1.852 4 | 0.955 5 | 0.942 2 |
| bio17 | 最干季降水量 Precipitation of driest quarter | 25 | 2.4 | 2.065 4 | 1.452 0 | 2.109 3 | 1.512 8 | 0.955 8 | 0.911 2 |
| bio18 | 最暖季降水量 Precipitation of warmest quarter | 0.7 | 1.9 | 2.061 3 | 1.463 5 | 2.128 3 | 1.590 2 | 0.957 0 | 0.922 9 |
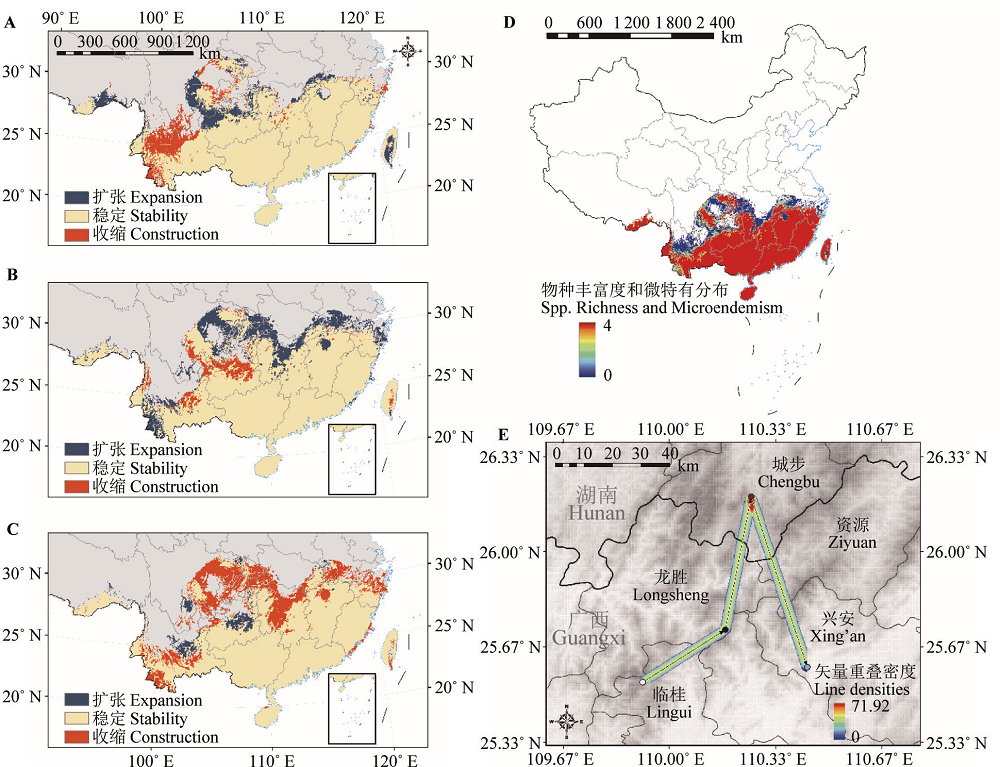
图2 不同历史时期观光木的地理分布模式。A, 末次盛冰期到全新世中期的分布变化。B, 全新世中期到现代的分布变化。C, 现代到未来2070s的分布变化。D, 四个时期物种丰富度和加权特有分布的叠加分布图。E, 几何中心位移以及矢量重叠密度情况, 白色圆点表示末次盛冰期几何分布中心, 黑色圆点表示全新世中期几何分布中心, 红色圆点表示现代几何分布中心, 蓝色圆点表示未来几何分布中心, 黑色箭头表示几何分布中心变化。
Fig. 2 Major distribution changes of Tsoongiodendron odorum between different periods simulated by MaxEnt. A, Distribution changes from the Last Glacial Maximum to Mid-Holocene. B, Distribution changes from the Mid-Holocene to Current. C, Distribution changes from the current to the future. D, Summed distributions and micro-endemism during the four periods (Last Glacial Maximum, Mid-Holocene, current and future). E, Core range shifts and the line densities, white dots represent the Last Glacial Maximum centroid, black dots represent Mid-Holocene centroid, red dots represent current centroid, blue dots represent future centroid, black arrow represent centroid change.
| 气候 变量Variable | 不适生 Unsuitable | 低度适生 Marginally suitable | 中度适生 Moderately suitable | 高度适生 Highly suitable | 单位 Unit | ||||||||
|---|---|---|---|---|---|---|---|---|---|---|---|---|---|
| 范围 Range | 平均值 Mean | 标准偏 差 SD | 范围 Range | 平均值 Mean | 标准偏 差 SD | 范围 Range | 平均值 Mean | 标准偏 差 SD | 范围 Range | 平均值 Mean | 标准偏 差 SD | ||
| bio01 | -4.32-1.97 | 4.01 | 7.14 | 4.51-4.58 | 16.32 | 2.02 | 11.13-25.73 | 19.14 | 2.40 | 16.26-24.65 | 20.46 | 1.50 | ℃ |
| bio02 | 2.82-0.03 | 12.68 | 2.27 | 4.77-3.82 | 8.07 | 0.99 | 4.07-11.91 | 7.90 | 0.78 | 4.10-9.83 | 8.22 | 0.63 | ℃ |
| bio03 | 10.70-0.88 | 30.45 | 5.67 | 20.57-52.24 | 30.75 | 7.60 | 21.91-48.50 | 31.91 | 4.36 | 25.93-39.94 | 32.81 | 2.31 | % |
| bio07 | 14.27-5.81 | 42.49 | 8.77 | 12.24-34.58 | 27.10 | 4.35 | 12.50-33.57 | 25.16 | 4.11 | 11.07-31.08 | 25.14 | 2.51 | ℃ |
| bio10 | -2.36-1.62 | 16.87 | 7.85 | 10.26-28.62 | 24.38 | 2.67 | 15.56-29.28 | 26.32 | 1.90 | 20.89-29.28 | 27.52 | 0.97 | ℃ |
| bio12 | 11.00-434.00 | 398.05 | 310.96 | 735.00-4 242.19 | 1 350.65 | 297.42 | 1 017.00-3 501.00 | 1 589.85 | 238.43 | 1 255.00-3 440.00 | 1 680.38 | 241.75 | mm |
| bio17 | 0.00-15.00 | 16.00 | 23.36 | 14.00-352.00 | 95.89 | 53.68 | 26.00-723.00 | 121.32 | 44.74 | 41.00-764.00 | 137.18 | 56.30 | mm |
| bio18 | 7.00-379.00 | 227.01 | 157.58 | 327.00-2 661.00 | 593.69 | 178.19 | 341.00-1 778.00 | 660.68 | 174.06 | 410.00-1 191.00 | 650.07 | 126.15 | mm |
表2 观光木现代各适生区的8个环境变量统计分析结果
Table 2 Statistics of the eight environmental variables in each of the current suitable areas for Tsoongiodendron odorum
| 气候 变量Variable | 不适生 Unsuitable | 低度适生 Marginally suitable | 中度适生 Moderately suitable | 高度适生 Highly suitable | 单位 Unit | ||||||||
|---|---|---|---|---|---|---|---|---|---|---|---|---|---|
| 范围 Range | 平均值 Mean | 标准偏 差 SD | 范围 Range | 平均值 Mean | 标准偏 差 SD | 范围 Range | 平均值 Mean | 标准偏 差 SD | 范围 Range | 平均值 Mean | 标准偏 差 SD | ||
| bio01 | -4.32-1.97 | 4.01 | 7.14 | 4.51-4.58 | 16.32 | 2.02 | 11.13-25.73 | 19.14 | 2.40 | 16.26-24.65 | 20.46 | 1.50 | ℃ |
| bio02 | 2.82-0.03 | 12.68 | 2.27 | 4.77-3.82 | 8.07 | 0.99 | 4.07-11.91 | 7.90 | 0.78 | 4.10-9.83 | 8.22 | 0.63 | ℃ |
| bio03 | 10.70-0.88 | 30.45 | 5.67 | 20.57-52.24 | 30.75 | 7.60 | 21.91-48.50 | 31.91 | 4.36 | 25.93-39.94 | 32.81 | 2.31 | % |
| bio07 | 14.27-5.81 | 42.49 | 8.77 | 12.24-34.58 | 27.10 | 4.35 | 12.50-33.57 | 25.16 | 4.11 | 11.07-31.08 | 25.14 | 2.51 | ℃ |
| bio10 | -2.36-1.62 | 16.87 | 7.85 | 10.26-28.62 | 24.38 | 2.67 | 15.56-29.28 | 26.32 | 1.90 | 20.89-29.28 | 27.52 | 0.97 | ℃ |
| bio12 | 11.00-434.00 | 398.05 | 310.96 | 735.00-4 242.19 | 1 350.65 | 297.42 | 1 017.00-3 501.00 | 1 589.85 | 238.43 | 1 255.00-3 440.00 | 1 680.38 | 241.75 | mm |
| bio17 | 0.00-15.00 | 16.00 | 23.36 | 14.00-352.00 | 95.89 | 53.68 | 26.00-723.00 | 121.32 | 44.74 | 41.00-764.00 | 137.18 | 56.30 | mm |
| bio18 | 7.00-379.00 | 227.01 | 157.58 | 327.00-2 661.00 | 593.69 | 178.19 | 341.00-1 778.00 | 660.68 | 174.06 | 410.00-1 191.00 | 650.07 | 126.15 | mm |
| 时期 Period | 年平均气温 Annual mean temperature (℃) | 年降水量 Annual precipitation (mm) | 各适生区面积(现代相比面积变化的百分比%) Area of each suitable region (the percentage change in area compared with current, %) | |||
|---|---|---|---|---|---|---|
| 低度适生区 Marginally suitable region | 中度适生区 Moderately suitable region | 高度适生区 Highly suitable region | 总适生区 Total suitable region | |||
| LGM | 16.7 | 1 589.7 | 64.01 (-14.84) | 52.21 (-7.87) | 16.16 (-4.57) | 132.38 (-11.02) |
| Mid | 20.1 | 1 741.3 | 66.93 (-10.96) | 51.38 (-9.33) | 14.32 (-15.40) | 132.64 (-10.85) |
| Future | 23.1 | 1 831.7 | 54.73 (-27.19) | 50.43 (-11.01) | 13.74 (-18.84) | 118.91 (-20.07) |
| Current | 20.5 | 1 680.4 | 75.17 (0.00) | 56.67 (0.00) | 16.93 (0.00) | 148.77 (0.00) |
表3 观光木不同时期的潜在分布区特征
Table 3 Characteristics of potential distribution in different periods for Tsoongiodendron odorum
| 时期 Period | 年平均气温 Annual mean temperature (℃) | 年降水量 Annual precipitation (mm) | 各适生区面积(现代相比面积变化的百分比%) Area of each suitable region (the percentage change in area compared with current, %) | |||
|---|---|---|---|---|---|---|
| 低度适生区 Marginally suitable region | 中度适生区 Moderately suitable region | 高度适生区 Highly suitable region | 总适生区 Total suitable region | |||
| LGM | 16.7 | 1 589.7 | 64.01 (-14.84) | 52.21 (-7.87) | 16.16 (-4.57) | 132.38 (-11.02) |
| Mid | 20.1 | 1 741.3 | 66.93 (-10.96) | 51.38 (-9.33) | 14.32 (-15.40) | 132.64 (-10.85) |
| Future | 23.1 | 1 831.7 | 54.73 (-27.19) | 50.43 (-11.01) | 13.74 (-18.84) | 118.91 (-20.07) |
| Current | 20.5 | 1 680.4 | 75.17 (0.00) | 56.67 (0.00) | 16.93 (0.00) | 148.77 (0.00) |
| [1] | Ahmed SE, Mcinerny G, O’Hara K, Harper R, Salido L, Emmott S, Joppa LN (2015). Scientists and software-surveying the species distribution modelling community. Diversity and Distributions, 21, 258-267. |
| [2] | Barbosa FG, Schneck F (2015). Characteristics of the top-cited papers in species distribution predictive models. Ecological Modelling, 313, 77-83. |
| [3] | Bellard C, Bertelsmeier C, Leadley P, Thuiller W, Courchamp F (2012). Impacts of climate change on the future of biodiversity. Ecology Letters, 15, 365-377. |
| [4] | Brown JL (2014). SDMtoolbox: A python-based GIS toolkit for landscape genetic, biogeographic and species distribution model analyses. Methods in Ecology and Evolution, 5, 694-700. |
| [5] | Brown JL, Yoder AD (2015). Shifting ranges and conservation challenges for lemurs in the face of climate change. Ecology and Evolution, 5, 1131-1142. |
| [6] | Chapin III FS, Zavaleta ES, Eviner VT, Naylor RL, Vitousek PM, Reynolds HL, Hooper DU, Lavorel S, Sala OE, Hobbie SE, Mack MC, Díaz S (2000). Consequences of changing biodiversity. Nature, 405, 234-242. |
| [7] | Chen XM, Lei YC, Zhang XQ, Jia HY (2012). Effects of sample sizes on accuracy and stability of maximum entropy model in predicting species distribution. Scientia Silvae Sinicae, 48(1), 53-59. |
| [ 陈新美, 雷渊才, 张雄清, 贾宏炎 (2012). 样本量对MaxEnt模型预测物种分布精度和稳定性的影响. 林业科学, 48(1), 53-59.] | |
| [8] | Chen Y, Ni J (2008). Quantitative palaeovegetation reconstruction at lager scale based on the pollen records. Journal of Plant Ecology (Chinese Version), 32, 1201-1212. |
| [ 陈瑜, 倪健 (2008). 利用孢粉记录定量重建大尺度古植被格局. 植物生态学报, 32, 1201-1212.] | |
| [9] | Deng XL, Wu Y, Lai MY, Xu B, Long WW (2012). Studies on the characteristics of Michelia odora population and its community in south-central Jiangxi. Guihaia, 32, 179-184. |
| [ 邓贤兰, 吴杨, 赖弥源, 许斌, 龙婉婉 (2012). 江西中南部观光木种群及所在群落特征研究. 广西植物, 32, 179-184.] | |
| [10] | Department of Wildlife Conservation and Nature Reserve Management, the National Forestry Bureau (2013). Rare and Endangered Plants in China. China Forestry Publishing House, Beijing. |
| [ 国家林业局野生动植物保护与自然保护区管理司 (2013). 中国珍稀濒危植物图鉴. 中国林业出版社, 北京.] | |
| [11] | Diez JM, DʼAntonio CM, Dukes JS, Grosholz ED, Olden JD, Sorte CJB, Blumenthal DM, Bradley BA, Early R, Ibáñez I, Jones SJ, Lawler JJ, Miller LP (2012). Will extreme climatic events facilitate biological invasions? Frontiers in Ecology and the Environment, 10, 249-257. |
| [12] | Elith J, Graham CH, Anderson RP, Dudík M, Ferrier S, Guisan A, Hijmans RJ, Huettmann F, Leathwick JR, Lehmann A, Li J, Lohmann LG, Loiselle BA, Manion G, Moritz C, Nakamura M, Nakazawa Y, Overton JM, Peterson AT, Phillips SJ, Richardson K, Scachetti-Pereira R, Schapire RE, Soberón J, Williams S, Wisz MS, Zimmermann NE (2006). Novel methods improve prediction of speciesʼ distributions from occurrence data. Ecography, 29, 129-151. |
| [13] | Elith J, Kearney M, Phillips S (2010). The art of modelling range-shifting species. Methods in Ecology and Evolution, 1, 330-342. |
| [14] | Fang JY, Zhu JL, Shi Y (2018). The responses of ecosystems to global warming. Chinese Science Bulletin, 63, 136-140. |
| [ 方精云, 朱江玲, 石岳 (2018). 生态系统对全球变暖的响应. 科学通报, 63, 136-140.] | |
| [15] | Fu LG, Jin JM (1992). Chinese Red Data Book of Rare and Endangered Plants. Science Press, Beijing. 454-455. |
| [ 傅立国, 金鉴明 (1992). 中国植物红皮书——稀有濒危植物. 科学出版社, 北京. 454-455.] | |
| [16] | Grimm NB, Chapin III FS, Bierwagen B, Gonzalez P, Groffman PM, Luo Y, Melton F, Nadelhoffer K, Pairis A, Raymond PA, Schimel J, Williamson CE (2013). The impacts of climate change on ecosystem structure and function. Frontiers in Ecology and the Environment, 11, 474-482. |
| [17] | Hamann A, Wang T (2009). Potential effects of climate change on ecosystem and tree species distribution in British Columbia. Ecology, 39, 2773-2786. |
| [18] | Hanley JA, McNeil BJ (1982). The meaning and use of the area under a receiver operating characteristic (ROC) curve. Radiology, 143, 29-36. |
| [19] | Harrison SP, Yu G, Takahara H, Prentice IC (2001). Palaeovegetation (Communications arising): Diversity of temperate plants in east Asia. Nature, 413, 129-130. |
| [20] | Heller NE, Zavaleta ES (2009). Biodiversity management in the face of climate change: A review of 22 years of recommendations. Biological Conservation, 142, 14-32. |
| [21] |
Hewitt GM (2004). Genetic consequences of climatic oscillations in the Quaternary. Philosophical Transactions of the Royal Society of London. Series B: Biological Sciences, 359, 183-195.
DOI URL |
| [22] | Kumar S, Stohlgren TJ (2009). Maxent modeling for predicting suitable habitat for threatened and endangered tree Canacomyrica monticola in New Caledonia. Journal of Ecology and the Natural Environment, 1, 94-98. |
| [23] | Lavergne S, Thompson JD, Garnier E, Debussche M (2004). The biology and ecology of narrow endemic and widespread plants, a comparative study of trait variation in 20 congeneric pairs. Oikos, 107, 505-518. |
| [24] | Lenoir J, Gégout JC, Marquet PA, De Ruffray P, Brisse H (2008). A significant upward shift in plant species optimum elevation during the 20th century. Science, 320, 1768-1771. |
| [25] | Lü Y (2014). Discussion of Ancient Vegetation and Climate at 10-40 ka BP in the Subtropical Mountains of Southern China. Master degree dissertation, Nanjing Normal University, Nanjing. |
| [ 吕燕 (2014). 中国南方亚热带山地10-40 ka BP古植被与古气候特征探讨. 硕士学位论文, 南京师范大学, 南京.] | |
| [26] | Members of China Quaternary Pollen Data Base (2000). Pollen-based biome reconstruction at Middle Holocene (6 ka BP) and last glacial maximum (18 ka BP) in China. Acta Botanica Sinica, 42, 1201-1209. |
| [ 中国第四纪孢粉数据库小组 (2000). 中国中全新世(6 ka BP)和末次盛冰期(18 ka BP)生物群区的重建. 植物学报, 42, 1201-1209.] | |
| [27] | Ni J, Yu G, Harrison SP, Prentice IC (2010). Palaeovegetation in China during the late Quaternary, biome reconstructions based on a global scheme of plant functional types. Palaeogeography Palaeoclimatology Palaeoecology, 289, 44-61. |
| [28] | Nogués-Bravo D (2009). Predicting the past distribution of species climatic niches. Global Ecology and Biogeography, 18, 521-531. |
| [29] | Phillips SJ, Anderson RP, Schapire RE (2006). Maximum entropy modeling of species geographic distributions. Ecological Modelling, 190, 231-259. |
| [30] | Phillips SJ, Dudík M (2008). Modeling of species distributions with Maxent, new extensions and a comprehensive evaluation. Ecography, 31, 161-175. |
| [31] | Provan J, Bennett KD (2008). Phylogeographic insights into cryptic glacial refugia. Trends in Ecology & Evolution, 23, 564-571. |
| [32] | Qiao H, Lin C, Ji L, Jiang Z (2012). mMWeb—An online platform for employing multiple ecological niche modeling algorithms. PLOS ONE, 7, e43327. DOI: 10.1371/journal.pone.0043327. |
| [33] | Qiu YX, Fu CX, Comes HP (2011). Plant molecular phylogeography in China and adjacent regions, tracing the genetic imprints of Quaternary climate and environmental change in the worldʼs most diverse temperate flora. Molecular Phylogenetics & Evolution, 59, 225-244. |
| [34] | Qu H, Wang CJ, Zhang ZX (2018). Planning priority conservation areas under climate change for six plant species with extremely small populations in China. Nature Conservation, 25, 89-106. |
| [35] |
Sekercioglu CH, Schneider SH, Fay JP, Loarie SR (2008). Climate change, elevational range shifts, and bird extinctions. Conservation Biology, 22, 140-150.
DOI URL |
| [36] | Song WJ, Wu SH, Tao ZX, Dai JH (2016). Distribution change of plants over mid-eastern China during last 30 years. Geographical Research, 35, 1420-1432. |
| [ 宋文静, 吴绍洪, 陶泽兴, 戴君虎 (2016). 近30年中国中东部地区植物分布变化. 地理研究, 35, 1420-1432.] | |
| [37] | Stocker TF, Qin D, Plattner GK, Tignor MMB, Allen SK, Boschung J, Nauels A, Xia Y, Bex V, Midgley PM (2014). Climate Change 2013: The Physical Science Basis. Cambridge University Press, Cambridge, UK. |
| [38] |
Swets JA (1988). Measuring the accuracy of diagnostic systems. Science, 240, 1285-1293.
DOI URL |
| [39] | Thomas E, van Zonneveld M, Loo J, Hodgkin T, Galluzzi G, van Etten J (2012). Present spatial diversity patterns of Theobroma cacao L. in the neotropics reflect genetic differentiation in pleistocene refugia followed by human-influenced dispersal. PLOS ONE, 7, e47676. DOI: 10.1371/journal.pone.0047676. |
| [40] | Thuiller W, Lavorel S, Araújo MB, Sykes MT, Prentice IC (2005). Climate change threats to plant diversity in Europe. Proceedings of the National Academy of Sciences of the United States of America, 102, 8245-8250. |
| [41] | Vaz UL, Cunha HF, Nabout JC (2015). Trends and biases in global scientific literature about ecological niche models. Brazilian Journal of Biology, 75, 17-24. |
| [42] | Waltari E, Hijmans RJ, Peterson AT, Nyári ÁS, Perkins SL, Guralnick RP (2007). Locating pleistocene refugia: Comparing phylogeographic and ecological niche model predictions. PLOS ONE, 2, e563. DOI: 10.1371/journal.pone.0000563. |
| [43] | Wang J, Ni J (2006). Review of modelling the distribution of plant species. Journal of Plant Ecology (Chinese Version), 30, 1040-1053. |
| [ 王娟, 倪健 (2006). 植物种分布的模拟研究进展. 植物生态学报, 30, 1040-1053.] | |
| [44] |
Wang X, Wang J, Jiang JH, Kang M (2012). Genetic diversity and the mating system in a fragmented population of Tsoongiodendron odorum. Biodiversity Science, 20, 676-684.
DOI URL |
|
[ 王霞, 王静, 蒋敬虎, 康明 (2012). 观光木片断化居群的遗传多样性和交配系统. 生物多样性, 20, 676-684.]
DOI URL |
|
| [45] | Wang YS, Xie BY, Wan FH, Xiao QM, Dai LY (2007). Application of ROC curve analysis in evaluating the performance of alien species potential distribution models. Biodiversity Science, 15, 365-372. |
| [ 王运生, 谢丙炎, 万方浩, 肖启明, 戴良英 (2007). ROC曲线分析在评价入侵物种分布模型中的应用. 生物多样性, 15, 365-372.] | |
| [46] |
Warren R, Vanderwal J, Price J (2013). Quantifying the benefit of early climate change mitigation in avoiding biodiversity loss. Nature Climate Change, 3, 678-682.
DOI URL |
| [47] | Watson JEM, Iwamura T, Butt N (2013). Mapping vulnerability and conservation adaptation strategies under climate change. Nature Climate Change, 3, 989-994. |
| [48] | Worthington TA, Zhang T, Logue DR, Mittelstet AR, Brewer SK (2016). Landscape and flow metrics affecting the distribution of a federally-threatened fish, improving management, model fit, and model transferability. Ecological Modelling, 342, 1-18. |
| [49] | Wu JG, Lv JJ, Ai L (2009). The impacts of climate change on the biodiversity: Vulnerability and adaptation. Ecology and Environmental Sciences, 18, 693-703. |
| [ 吴建国, 吕佳佳, 艾丽 (2009). 气候变化对生物多样性的影响, 脆弱性和适应. 生态环境学报, 18, 693-703.] | |
| [50] |
Wu XQ, Xu GB, Liang Y, Sheng XB (2013). Genetic diversity of natural and planted populations of Tsoongiodendron odorum from the Nanling Mountains. Biodiversity Science, 21, 71-79.
DOI URL |
|
[ 吴雪琴, 徐刚标, 梁艳, 申响保 (2013). 南岭地区观光木自然和人工迁地保护种群的遗传多样性. 生物多样性, 21, 71-79.]
DOI URL |
|
| [51] | Xiao RG, Zhang YM, Wu LF, Shu ZF, Song XJ (2017). Research status and prospect of the endangered plant species Tsoongiodendron odorum Chun. Journal of Green Science and Technology, (21), 106-107. |
| [ 肖荣高, 张应明, 吴林芳, 束祖飞, 宋相金 (2017). 濒危植物观光木的研究现状及展望. 绿色科技, (21), 106-107.] | |
| [52] | Xing DL, Hao ZQ (2011). The principle of maximum entropy and its applications in ecology. Biodiversity Science, 19, 295-302. |
| [ 邢丁亮, 郝占庆 (2011). 最大熵原理及其在生态学研究中的应用. 生物多样性, 19, 295-302.] | |
| [53] | Xu GB, Wu XQ, Jiang GX, Hu SL, Liu XS, Xiao YF, Hao BB (2014). Genetic diversity and population structure of an endangered species: Tsoongiodendron odorum Chun. Journal of Plant Genetic Resources, 15, 255-261. |
| [ 徐刚标, 吴雪琴, 蒋桂雄, 胡尚力, 刘雄盛, 肖玉菲, 郝博搏 (2014). 濒危植物观光木遗传多样性及遗传结构分析. 植物遗传资源学报, 15, 255-261.] | |
| [54] |
Yang XQ, Kushwaha SPS, Saran S, Xu J, Roy PS (2013). Maxent modeling for predicting the potential distribution of medicinal plant, Justicia adhatoda L. in Lesser Himalayan foothills. Ecological Engineering, 51, 83-87.
DOI URL |
| [55] | Yang YS, Chen GS, Guo JF, Lin P (2004). Decomposition dynamic of fine roots in a mixed forest of Cunninghamia lanceolata and Tsoongiodendron odorum in mid-subtropics. Annals of Forest Science, 61, 65-72. |
| [56] | Ye JW, Zhang Y, Wang XJ (2017). Phylogeographic history of broad-leaved forest plants in subtropical China. Acta Ecologica Sinica, 37, 5894-5904. |
| [ 叶俊伟, 张阳, 王晓娟 (2017). 中国亚热带地区阔叶林植物的谱系地理历史. 生态学报, 37, 5894-5904.] | |
| [57] | Ying JS (2001). Species diversity and distribution pattern of seed plants in China. Biodiversity Science, 9, 393-398. |
| [ 应俊生 (2001). 中国种子植物物种多样性及其分布格局. 生物多样性, 9, 393-398.] | |
| [58] | Zhang L (2015). Applications of maximum entropy (MAXENT) model in prediction of species potential distribution ranges. Bulletin of Biology, 50, 9-12. |
| [ 张路 (2015). MAXENT最大熵模型在预测物种潜在分布范围方面的应用. 生物学通报, 50, 9-12.] | |
| [59] | Zhang XQ, Peng LL, Lin CH (2008). Progress on the projections of future climate change with variable emission scenarios. Advances in Earth Science, 23, 174-185. |
| [ 张雪芹, 彭莉莉, 林朝晖 (2008). 未来不同排放情景下气候变化预估研究进展. 地球科学进展, 23, 174-185.] | |
| [60] | Zheng YQ, Yu G, Xue B, Wang SM (2004). Simulations of east Asian climate at 6 ka B.P. Quaternary Sciences, 24, 28-38. |
| [ 郑益群, 于革, 薛滨, 王苏民 (2004). 6 ka B.P.东亚区域气候模拟及其变化机制探讨. 第四纪研究, 24, 28-38.] | |
| [61] | Zhu GP, Liu GQ, Bu WJ, Gao YB (2013). Ecological niche modeling and its applications in biodiversity conservation. Biodiversity Science, 21, 90-98. |
| [ 朱耿平, 刘国卿, 卜文俊, 高玉葆 (2013). 生态位模型的基本原理及其在生物多样性保护中的应用. 生物多样性, 21, 90-98.] | |
| [62] |
Zhu GP, Liu Q, Gao YB (2014). Improving ecological niche model transferability to predict the potential distribution of invasive exotic species. Biodiversity Science, 22, 223-230.
DOI URL |
|
[ 朱耿平, 刘强, 高玉葆 (2014). 提高生态位模型转移能力来模拟入侵物种的潜在分布. 生物多样性, 22, 223-230.]
DOI URL |
|
| [63] |
Zhu T, Meng T, Zhang J, Yin Y, Cai Z, Yang W, Zhong W (2013). Nitrogen mineralization, immobilization turnover, heterotrophic nitrification, and microbial groups in acid forest soils of subtropical China. Biology and Fertility of Soils, 49, 323-331.
DOI URL |
| [1] | 陈以恒 玉素甫江·如素力 阿卜杜热合曼·吾斯曼. 2001-2020年天山新疆段草地植被覆盖度时空变化及驱动因素分析[J]. 植物生态学报, 2024, 48(5): 561-576. |
| [2] | 张计深, 史新杰, 刘宇诺, 吴阳, 彭守璋. 气候变化下中国潜在自然植被生态系统碳储量动态[J]. 植物生态学报, 2024, 48(4): 428-444. |
| [3] | 臧妙涵, 王传宽, 梁逸娴, 刘逸潇, 上官虹玉, 全先奎. 基于纬度移栽的落叶松叶、枝、根生态化学计量特征对气候变暖的响应[J]. 植物生态学报, 2024, 48(4): 469-482. |
| [4] | 梁逸娴, 王传宽, 臧妙涵, 上官虹玉, 刘逸潇, 全先奎. 落叶松径向生长和生物量分配对气候变暖的响应[J]. 植物生态学报, 2024, 48(4): 459-468. |
| [5] | 吴茹茹, 刘美珍, 谷仙, 常馨月, 郭立月, 蒋高明, 祁如意. 气候变化对巨柏适宜生境分布的潜在影响和预测[J]. 植物生态学报, 2024, 48(4): 445-458. |
| [6] | 杨宇萌, 来全, 刘心怡. 气候变化和人类活动对内蒙古植被总初级生产力的定量影响[J]. 植物生态学报, 2024, 48(3): 306-316. |
| [7] | 张启, 程雪寒, 王树芝. 北京西山老龄树记载的森林干扰历史[J]. 植物生态学报, 2024, 48(3): 341-348. |
| [8] | 任培鑫, 李鹏, 彭长辉, 周晓路, 杨铭霞. 洞庭湖流域植被光合物候的时空变化及其对气候变化的响应[J]. 植物生态学报, 2023, 47(3): 319-330. |
| [9] | 李杰, 郝珉辉, 范春雨, 张春雨, 赵秀海. 东北温带森林树种和功能多样性对生态系统多功能性的影响[J]. 植物生态学报, 2023, 47(11): 1507-1522. |
| [10] | 魏瑶, 马志远, 周佳颖, 张振华. 模拟增温改变青藏高原植物繁殖物候及植株高度[J]. 植物生态学报, 2022, 46(9): 995-1004. |
| [11] | 党宏忠, 张学利, 韩辉, 石长春, 葛玉祥, 马全林, 陈帅, 刘春颖. 樟子松固沙林林水关系研究进展及对营林实践的指导[J]. 植物生态学报, 2022, 46(9): 971-983. |
| [12] | 李肖, PIALUANG Bounthong, 康文辉, 冀晓东, 张海江, 薛治国, 张志强. 近几十年来冀西北山地白桦次生林径向生长对气候变化的响应[J]. 植物生态学报, 2022, 46(8): 919-931. |
| [13] | 苏启陶, 杜志喧, 周兵, 廖永辉, 王呈呈, 肖宜安. 牯岭凤仙花及其传粉昆虫在中国的潜在分布区域分析[J]. 植物生态学报, 2022, 46(7): 785-796. |
| [14] | 闫涵, 马松梅, 魏博, 张宏祥, 张丹. 孑遗灌木长柄扁桃的历史分布格局及其环境驱动力[J]. 植物生态学报, 2022, 46(7): 766-774. |
| [15] | 胡潇飞, 魏临风, 程琦, 吴星麒, 倪健. 青藏高原地区气候图解数据集[J]. 植物生态学报, 2022, 46(4): 484-492. |
| 阅读次数 | ||||||
|
全文 |
|
|||||
|
摘要 |
|
|||||
Copyright © 2022 版权所有 《植物生态学报》编辑部
地址: 北京香山南辛村20号, 邮编: 100093
Tel.: 010-62836134, 62836138; Fax: 010-82599431; E-mail: apes@ibcas.ac.cn, cjpe@ibcas.ac.cn
备案号: 京ICP备16067583号-19