
植物生态学报 ›› 2005, Vol. 29 ›› Issue (3): 436-443.DOI: 10.17521/cjpe.2005.0058 cstr: 32100.14.cjpe.2005.0058
李俊祥( ), 达良俊, 王玉洁, 宋永昌
收稿日期:2004-02-26
接受日期:2004-10-19
出版日期:2005-02-26
发布日期:2005-05-30
作者简介:E-mail: jxli@des.ecnu.edu.cn
基金资助:
LI Jun-Xiang(), DA Liang-Jun, WANG Yu-Jie, SONG Yong-Chang
Received:2004-02-26
Accepted:2004-10-19
Online:2005-02-26
Published:2005-05-30
摘要:
该文采用 19幅 (时间跨 8个月 ) 时间序列的NOAAAVHRR的归一化植被指数 (NDVI) 最大值合成影像遥感数据, 经过主分量分析 (Principlecomponentanalysis, PCA) 处理后, 用非监督分类方法的ISODATA算法, 对中国东部地区的 (五省一市 ) 植被进行分类, 结果可以分出 2 8种土地覆盖类型, 除了两种类型为水体和城市或裸地外, 其余 2 6种类型均为植被类型, 根据中国植被分类系统, 这 2 6类可以归并为 6大植被类型 :1) 常绿阔叶林 ;2 ) 针叶林 ;3) 竹林 ;4 ) 灌草丛 ;5 ) 水生植被 ;6 ) 农业植被。用 1∶10 0 0 0 0 0数字化《中国植被图集》的植被类型检验遥感分类结果表明, 针叶林、灌草丛、常绿阔叶林和农业植被的分类具有较高的位置精度和面积精度, 位置精度分别为 79.2 %、91.3%、6 8.2 %和 95.9%, 面积精度分别达到 92.1%、95.9%、6 3.8%和 90.5 %。这 6大植被类型在地理空间上的分布规律与中国东部常绿阔叶林区植被的地带性分布基本一致。
李俊祥, 达良俊, 王玉洁, 宋永昌. 基于NOAA-AVHRR数据的中国东部地区植被遥感分类研究. 植物生态学报, 2005, 29(3): 436-443. DOI: 10.17521/cjpe.2005.0058
LI Jun-Xiang, DA Liang-Jun, WANG Yu-Jie, SONG Yong-Chang. VEGETATION CLASSIFICATION OF EAST CHINA USING MULTI-TEMPORAL NOAA-AVHRR DATA. Chinese Journal of Plant Ecology, 2005, 29(3): 436-443. DOI: 10.17521/cjpe.2005.0058
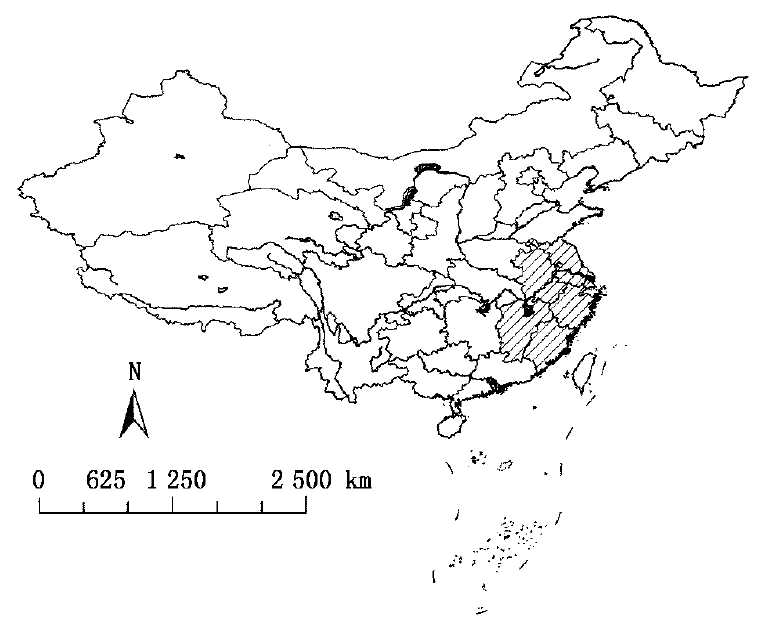
图1 研究地区的地理位置
Fig.1 Location of the research area and its coverage
| 协相关特 征向量 Correlation eigenvector | 累积贡 献率 Cumulative contribution | 协方差特 征向量 Correlation eigenvector | 累积贡 献率 Cumulative contribution | |
|---|---|---|---|---|
| 主成分1 PC1 | 18.620 | 98.000 | 247 763.44 | 98.058 |
| 主成分2 PC2 | 0.151 | 98.795 | 1 952.86 | 98.831 |
| 主成分3 PC3 | 0.058 | 99.100 | 741.93 | 99.124 |
| 主成分4 PC4 | 0.034 | 99.279 | 434.73 | 99.296 |
| 主成分5 PC5 | 0.026 | 99.416 | 329.55 | 99.427 |
| 主成分6 PC6 | 0.020 | 99.521 | 243.69 | 99.523 |
| 主成分7 PC7 | 0.014 | 99.595 | 191.44 | 99.599 |
| 主成分8 PC8 | 0.012 | 99.658 | 151.07 | 99.659 |
| 主成分9 PC9 | 0.011 | 99.716 | 132.53 | 99.711 |
| 主成分10 PC10 | 0.009 | 99.763 | 123.20 | 99.760 |
| 主成分11 PC11 | 0.008 | 99.805 | 107.16 | 99.823 |
| 主成分12 PC12 | 0.007 | 99.842 | 91.18 | 99.839 |
| 主成分13 PC13 | 0.006 | 99.874 | 85.65 | 99.873 |
| 主成分14 PC14 | 0.005 | 99.900 | 69.38 | 99.900 |
| 主成分15 PC15 | 0.005 | 99.926 | 68.20 | 99.927 |
| 主成分16 PC16 | 0.004 | 99.947 | 57.38 | 99.950 |
| 主成分17 PC17 | 0.004 | 99.968 | 50.92 | 99.970 |
| 主成分18 PC18 | 0.003 | 99.984 | 38.43 | 99.985 |
| 主成分19 PC19 | 0.003 | 100.000 | 37.69 | 100.000 |
表1 19幅NDVI最大值合成影像经PCA处理后各波段的统计特征
Table 1 Statistical traits of 19 maximum NDVI composite images after PCA processing
| 协相关特 征向量 Correlation eigenvector | 累积贡 献率 Cumulative contribution | 协方差特 征向量 Correlation eigenvector | 累积贡 献率 Cumulative contribution | |
|---|---|---|---|---|
| 主成分1 PC1 | 18.620 | 98.000 | 247 763.44 | 98.058 |
| 主成分2 PC2 | 0.151 | 98.795 | 1 952.86 | 98.831 |
| 主成分3 PC3 | 0.058 | 99.100 | 741.93 | 99.124 |
| 主成分4 PC4 | 0.034 | 99.279 | 434.73 | 99.296 |
| 主成分5 PC5 | 0.026 | 99.416 | 329.55 | 99.427 |
| 主成分6 PC6 | 0.020 | 99.521 | 243.69 | 99.523 |
| 主成分7 PC7 | 0.014 | 99.595 | 191.44 | 99.599 |
| 主成分8 PC8 | 0.012 | 99.658 | 151.07 | 99.659 |
| 主成分9 PC9 | 0.011 | 99.716 | 132.53 | 99.711 |
| 主成分10 PC10 | 0.009 | 99.763 | 123.20 | 99.760 |
| 主成分11 PC11 | 0.008 | 99.805 | 107.16 | 99.823 |
| 主成分12 PC12 | 0.007 | 99.842 | 91.18 | 99.839 |
| 主成分13 PC13 | 0.006 | 99.874 | 85.65 | 99.873 |
| 主成分14 PC14 | 0.005 | 99.900 | 69.38 | 99.900 |
| 主成分15 PC15 | 0.005 | 99.926 | 68.20 | 99.927 |
| 主成分16 PC16 | 0.004 | 99.947 | 57.38 | 99.950 |
| 主成分17 PC17 | 0.004 | 99.968 | 50.92 | 99.970 |
| 主成分18 PC18 | 0.003 | 99.984 | 38.43 | 99.985 |
| 主成分19 PC19 | 0.003 | 100.000 | 37.69 | 100.000 |
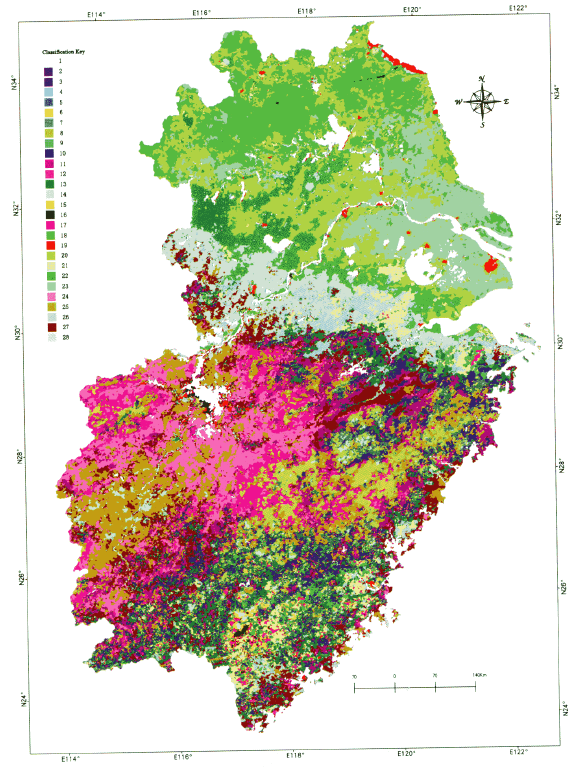
图2 中国东部植被分类图 1:水体Water 2:水生植被Aquatic vegetation 3:水生/沼泽植被Aquatic or swamp vegetation 4:沼泽/滩涂植被类型ⅠSwamp orbeach vegetationⅠ5:沼泽/滩涂植被类型ⅡSwamp or beach vegetationⅡ6:常绿阔叶林类型ⅠEvergreen broad_leaved forest typeⅠ7:常绿阔叶林类型ⅡEvergreen broad_leaved forest typesⅡ8:针叶林Ⅰ杉木林ConiferousforestⅠ (Cunninghamia lanceolata) 9:针叶林Ⅱ马尾松林Needle_leaved forest typeⅡ (Pinus massoniana) 10:针叶林Ⅲ马尾松占优势Needle_leaved forest typeⅢ (Pinus dominated) 11:针阔叶混交林Needle_leaved broad_leaved mixed forest type 12:常绿果树或常绿灌丛Evergreen orchards or evergreen shrub types 13:针叶林ⅣConiferous forest typeⅣ14:矮灌草丛类型ⅠLow shrub grass typeⅠ15:矮灌草丛类型ⅡLow shrub grass typeⅡ16:矮灌草丛类型ⅢLow shrub grass typeⅢ17:矮灌草丛类型ⅣLow shrub grasstypeⅣ18:一年两熟旱作农业植被小麦+玉米One yeartwo ripe crop in dry farmland (wheat+corn) 19:城市/裸露沙滩Urban area or bare sand beach 20:一年两熟/二年三熟水稻+油菜/小麦:农业植被One year two or two year three ripe crop (rice+wheat/rape) 21:竹林Bamboo forest type 22:一年两熟/三熟水稻+油菜:农业植被One year two or three ripe crop (rice+rape) 23:一年两熟/三熟水稻为主:农业植被One year two or three ripe crop (rice dominated) 24:一年两熟水稻+水稻为主:农业植被One year two ripe crop (rice+rice) 25:一年两熟/三熟水稻需灌溉:农业植被One year two or three crop in irrigated land (rice) 26:落叶灌丛Deciduous shrub 27:一年两熟水稻占优势:农业植被One year two ripe crop (rice dominant) 28:山地灌草丛Montane brushwood
Fig.2 Map of vegetation classification in East China
| 针叶林* NLF | 常绿阔叶林 EBLF | 竹林 BF | 灌草丛 SHG | 水生植被 AV | 农业植被 CV | 落叶阔叶林 DLF | 常绿落叶阔 叶混交林 EDMF | ||||||
|---|---|---|---|---|---|---|---|---|---|---|---|---|---|
| 遥感分类 (3×3滤波) 斑块数 Patches identified (3×3 filtered) | 1 654 | 727 | 553 | 1 902 | 2 143 | 1 425 | - | - | |||||
| 中国植被数字化斑块数 Patches digitalized | 3 388 | 765 | 453 | 1 251 | 69 | 2 904 | 109 | 51 | |||||
| 重合的斑块数 Patches overlaid | 2 684 | 522 | 130 | 1 142 | 48 | 2 786 | - | - | |||||
| 分类精度 Accuracy (%) | 79.2 | 68.2 | 28.7 | 91.3 | 69.6 | 95.9 | |||||||
表2 中国东部植被遥感分类结果类型精度评估
Table 2 Type accuracy assessment of the classified vegetation types in East China
| 针叶林* NLF | 常绿阔叶林 EBLF | 竹林 BF | 灌草丛 SHG | 水生植被 AV | 农业植被 CV | 落叶阔叶林 DLF | 常绿落叶阔 叶混交林 EDMF | ||||||
|---|---|---|---|---|---|---|---|---|---|---|---|---|---|
| 遥感分类 (3×3滤波) 斑块数 Patches identified (3×3 filtered) | 1 654 | 727 | 553 | 1 902 | 2 143 | 1 425 | - | - | |||||
| 中国植被数字化斑块数 Patches digitalized | 3 388 | 765 | 453 | 1 251 | 69 | 2 904 | 109 | 51 | |||||
| 重合的斑块数 Patches overlaid | 2 684 | 522 | 130 | 1 142 | 48 | 2 786 | - | - | |||||
| 分类精度 Accuracy (%) | 79.2 | 68.2 | 28.7 | 91.3 | 69.6 | 95.9 | |||||||
| 遥感分类类型 Identified vegetation type | 遥感分类面积 Area of identified types (km2) | 中国植被图类型 Digitalized vegetation types from Vegetation Atlas of China | 数字化中国植被 图类型面积 Area of digitalized types (km2) | 面积误差 Errors of area (km2) | 面积精度 Area accuracy (%) |
|---|---|---|---|---|---|
| 针叶林NLF | 150 292.0 | 针叶林NLF | 163 184.5 | -12 892.5 | 92.1 |
| 常绿阔叶林EBLF | 35 427.0 | 常绿阔叶林EBLF | 26 010.4 | 9 417.0 | 63.8 |
| 竹林BF | 16 243.0 | 竹林BF | 16 823.5 | -580.0 | 96.5 |
| 灌草丛SHG | 85 462.0 | 灌草丛SHG | 89 067.0 | -3 605.0 | 95.9 |
| 水生植被AV | 5 555.0 | 水生植被AV | 1 713.0 | 3 842.0 | 324.3 |
| 农业植被CV | 286 328.0 | 农业植被CV | 316 212.1 | -29 884.0 | 90.5 |
| 水面* Water | 55 005.0 | 水面* Water | 22 034.4 | 32 971.0 | 249.6 |
| 城区/裸地* Urban/bare soil | 4 288.0 | ||||
| 亚热带常绿落叶 阔叶混交林EDMF | 1108.9 | ||||
| 落叶阔叶林DBF | 4563.8 | ||||
| 合计 Total | 638 600.0 | 639 000.0 | -400.0 | 99.9 |
表3 中国东部植被遥感分类结果面积精度评估
Table 3 Area accuracy assessment of the classified vegetation types in East China
| 遥感分类类型 Identified vegetation type | 遥感分类面积 Area of identified types (km2) | 中国植被图类型 Digitalized vegetation types from Vegetation Atlas of China | 数字化中国植被 图类型面积 Area of digitalized types (km2) | 面积误差 Errors of area (km2) | 面积精度 Area accuracy (%) |
|---|---|---|---|---|---|
| 针叶林NLF | 150 292.0 | 针叶林NLF | 163 184.5 | -12 892.5 | 92.1 |
| 常绿阔叶林EBLF | 35 427.0 | 常绿阔叶林EBLF | 26 010.4 | 9 417.0 | 63.8 |
| 竹林BF | 16 243.0 | 竹林BF | 16 823.5 | -580.0 | 96.5 |
| 灌草丛SHG | 85 462.0 | 灌草丛SHG | 89 067.0 | -3 605.0 | 95.9 |
| 水生植被AV | 5 555.0 | 水生植被AV | 1 713.0 | 3 842.0 | 324.3 |
| 农业植被CV | 286 328.0 | 农业植被CV | 316 212.1 | -29 884.0 | 90.5 |
| 水面* Water | 55 005.0 | 水面* Water | 22 034.4 | 32 971.0 | 249.6 |
| 城区/裸地* Urban/bare soil | 4 288.0 | ||||
| 亚热带常绿落叶 阔叶混交林EDMF | 1108.9 | ||||
| 落叶阔叶林DBF | 4563.8 | ||||
| 合计 Total | 638 600.0 | 639 000.0 | -400.0 | 99.9 |
| [1] | Achard F, Estreguil C (1995). ForestclassificationofSoutheastA siausingNOAAAVHRRdata. RemoteSensingofEnvironment, 54,198-208. |
| [2] | Achard F, Eva H, Mayaux P (2001). Tropicalforestmappingfromcoarsespatialresolutionsatellitedata:productionandaccuracyassessmentissues. InternationalJournalofRemoteSensing, 22,2741-2762. |
| [3] | Boyd DS, Ripple WJ (1997). Potentialvegetationindicesfordeter miningglobalforestcover. InternationalJournalofRemoteSens ing, 18,1395-1401. |
| [4] | Cihlar J, Ly H, Xiao Q (1996). LandcoverclassificationwithAVHRRmultichannelcompositioninNortherenvironments. RemoteSensingofEnvironment, 58,36-51. |
| [5] | DeFries R, Townshend JRG (1994). NDVI_derivedlandcoverclassificationsonaglobalscale. InternationalJournalofRemoteSensing, 15,3567-3586. |
| [6] | Editorial Board of The Forest of Jiangxi Province (江西森林编辑委员会) (1986). TheForestofJiangxiProvince (江西森林). JiangxiScience&TechnologyPress, Nanchang. (inChinese). |
| [7] | Editorial Board of Vegetation of Anhui Province (安徽植被编辑委员会) (1983). VegetationofAnhuiProvince (安徽植被). An huiScienceandTechnologyPress, Hefei. (inChinese). |
| [8] | Ehrlich D, Estes JE, Singh A (1994). ApplicationofNOAA_AVHRR 1kmdataforenvironmentalmonitoring. InternationalJournalofRemoteSensing, 15,145-161. |
| [9] | Eidenshink JC, Faundeen JL (1994). The1kmAVHRRgloballanddataset:firststagesinimplementation. InternationalJour nalofRemoteSensing, 15,3443-3462. |
| [10] | Goward SN, Huemmrich KF (1992). VegetationcanopyPARab sorbanceandthenormalizeddifferencevegetationindex:anas sessmentusingtheSAILmodel. RemoteSensingofEnvironment, 39,119-140. |
| [11] | Hou XY (侯学煜) (2000). VegetationAtlasofChina (中国植被图集). SciencePress, Beijing. (inChinese). |
| [12] | Li XB (李晓兵), Shi PJ (史培军) (1999). Researchonregula tionofNDVIChangeofChineseprimaryvegetationtypesbasedonNOAA/AVHRRdata. ActaBotanicaSinica (植物学报), 41,314-324. (inChinesewithEnglishabstract). |
| [13] | Lin P (林鹏) (1990). VegetationofFujianProvince (福建植被). FujianScience&TechnologyPress, Fuzhou. (inChinese). |
| [14] | Mayaux P, Gond V, Bartholome E (2000). Anear_realtimeforestcovermapofMadagascarderivedfromSPOT -4VEGETATION (VGT) data. InternationalJournalofRemoteSensing, 21,3139-3144. |
| [15] | Moody A, Strahler AH (1994). CharacteristicsofcompositeAVHRRdataandproblemsintheirclassification. InternationalJournalofRemoteSensing, 15,3473-3491. |
| [16] | Running SW, Hunt ER, Nemani R, Glassy J (1994). MODISLAI (leafareaindex) andFPAR (fractionphotosyntheticallyactivera diation). MODISalgorithmdocument.NASA, 19. |
| [17] | Scepan J (1999). Thematicvalidationofhigh_resolutiongloballand_coverdatasets. PhotogrammetricEngineering&RemoteSensing, 65,1051-1060. |
| [18] | Sellers PJ (1987). Canopyreflectance, photosynthesisandtranspi rationⅡ.Theroleofbiophysicsinthelinearityoftheirinterde pendence. RemoteSensingofEnvironment, 21,143-183. |
| [19] | Sellers PJ, Turker CJ, Collatz GJ, Los SO, Justice CO, Dazlich DA, Randall DA (1994). Aglobal1°by1°NDVIdatasetforclimatestudies.Part2, Thegenerationofglobalfieldsofterres trialbiophysicalparametersfromtheNDVI. InternationalJournalRemoteSensing, 15,3519-3545. |
| [20] | Sheng YW (盛永伟), Chen WY (陈维英), Xiao QG (肖乾广) GuoL (郭亮) (1995). Chinesevegetationclassificationwithme teorologicalsatellitevegetationindexdata. ChineseScienceBul letin (科学通报), 40,68-71. (inChinese). |
| [21] | Song YC (宋永昌) (1999). PerspectiveofthevegetationzonationofforestregionineasternChina. ActaBotanicaSinica (植物学报), 41,541-552. (inChinesewithEnglishabstract). |
| [22] | The Forest of Zhejiang Province Compilation Committee Edition (浙江森林编辑委员会) (1993). TheForestofZhejiangProvince (浙江森林). ChinaForestryPublishingHouse, Beijing. (inChinese). |
| [23] | Townshend JRG (1994). GlobaldatasetsforlandapplicationfromAdvancedVeryHighResolutionRadiometer:anintroduction. InternationalJournalofRemoteSensing, 15,3319-3332. |
| [24] | Townshend JRG, Justice CO, Skole D, Malingreau JP, Cihlar J, Teiliet P, Sadowski F, Ruttenberg S (1994). The1kmresolu tionglobaldataset:needsofTheInternationalGeosphereBio sphereProgramme. InternationalJournalofRemoteSensing, 15,3417-3441. |
| [25] |
Tucker CJ, Townshend JRG, Goff TE (1985a). Africaland_coverclassificationusingsatellitedata. Science, 227,369-375.
DOI URL |
| [26] | Tucker CJ, Vanpraet CL, Sharman MJ, vanIttersum G (1985b). SatelliteremotesensingoftotalherbaceousbiomassproductionintheSenegaleseSahel:1980-1984. RemoteSensingofEnviron ment, 17,233-249. |
| [27] | USGS (2004). Globallandcovercharacteristicsdataset. Http://edcdaac.usgs.gov/glcc/globdoc2_0.html.Cited21October2004. |
| [28] | Wu ZY (吴征镒) (1980). VegetationofChina (中国植被). SciencePress, Beijing. (inChinese). |
| [29] | Xiao X, Boles S, Liu J, Zhuang D, Liu M (2002). Characteriza tionofforesttypesinNortheasternChina, usingmulti_temporalSPOT_4VEGETATIONsensordata. RemoteSensingofEnviron ment, 82,335-348. |
| [30] | Zhu Z, Evans DL (1994). U.S.foresttypesandpredictedpercentforestcoverfromAVHRRdata. PhotogrammetricEngineeringandRemoteSensing, 60,525-531. |
| [1] | 张健, 孙慕梵, 宋坤, 赖丽茗, 宋永昌. 基于生态外貌-植物区系分类系统的中国常绿阔叶林分类修订[J]. 植物生态学报, 2026, 50(1): 107-122. |
| [2] | 熊高明, 申国珍, 徐文婷, 谢宗强, 李跃林, 徐耀粘, 陈芳清, 李家湘. 中国低山丘陵热性常绿阔叶灌丛主要类型及群落特征[J]. 植物生态学报, 2025, 49(6): 865-874. |
| [3] | 熊高明, 申国珍, 赵常明, 徐文婷, 王杨, 谢宗强, 李家湘, 徐耀粘, 李跃林, 陈芳清. 中国檵木灌丛植被类型及群落特征[J]. 植物生态学报, 2025, 49(6): 875-887. |
| [4] | 段俊丞, 王志勇, 高维聪, 张成凯, 高长宏, 刘晓彤, 李振今. 黄河三角洲湿地入侵物种互花米草时空演化与景观格局分析[J]. 植物生态学报, 2025, 49(6): 922-938. |
| [5] | 杜燕, 刘鑫, 张瀚曰, 马少伟, 包维楷. 中国高山松群系的群落特征[J]. 植物生态学报, 2025, 49(6): 816-824. |
| [6] | 韦丹丹, 杜燕, 包维楷, 胡斌, 张瀚曰, 王瀚婕, 唐圆圆, 黄龙, 郭昌安, 刘鑫. 冬麻豆群落的地理分布、特征和分类[J]. 植物生态学报, 2025, 49(10): 1698-1709. |
| [7] | 董劭琼, 侯东杰, 曲孝云, 郭柯. 柴达木盆地植物群落样方数据集[J]. 植物生态学报, 2024, 48(4): 534-540. |
| [8] | 郑亚纹, 樊海东, 刘立斌, 倪健. 基于高精度遥感影像和精细植被踏查的金华北山植被制图[J]. 植物生态学报, 2024, 48(11): 1471-1485. |
| [9] | 郝晴, 黄昌. 森林地上生物量遥感估算研究综述[J]. 植物生态学报, 2023, 47(10): 1356-1374. |
| [10] | 金伊丽, 王皓言, 魏临风, 侯颖, 胡景, 吴铠, 夏昊钧, 夏洁, 周伯睿, 李凯, 倪健. 青藏高原植物群落样方数据集[J]. 植物生态学报, 2022, 46(7): 846-854. |
| [11] | 王国宏, 郭柯, 谢宗强, 唐志尧, 蒋延玲, 方精云. 《中国植被志》研编规范的若干说明、补充与修订[J]. 植物生态学报, 2022, 46(3): 368-372. |
| [12] | 丛楠, 张扬建, 朱军涛. 北半球中高纬度地区近30年植被春季物候温度敏感性[J]. 植物生态学报, 2022, 46(2): 125-135. |
| [13] | 姜艳, 陈兴芳, 杨旭杰. 基于Landsat影像的武汉东湖30年来水生植物动态变化[J]. 植物生态学报, 2022, 46(12): 1551-1561. |
| [14] | 田佳玉, 王彬, 张志明, 林露湘. 光谱多样性在植物多样性监测与评估中的应用[J]. 植物生态学报, 2022, 46(10): 1129-1150. |
| [15] | 严正兵, 刘树文, 吴锦. 高光谱遥感技术在植物功能性状监测中的应用与展望[J]. 植物生态学报, 2022, 46(10): 1151-1166. |
| 阅读次数 | ||||||
|
全文 |
|
|||||
|
摘要 |
|
|||||
Copyright © 2026 版权所有 《植物生态学报》编辑部
地址: 北京香山南辛村20号, 邮编: 100093
Tel.: 010-62836134, 62836138; Fax: 010-82599431; E-mail: apes@ibcas.ac.cn, cjpe@ibcas.ac.cn
备案号: 京ICP备16067583号-19
![]()