
Chin J Plant Ecol ›› 2010, Vol. 34 ›› Issue (4): 409-417.DOI: 10.3773/j.issn.1005-264x.2010.04.006
• Research Articles • Previous Articles Next Articles
SUN Hong-Gang1, ZHANG Jian-Guo2,*( ), DUAN Ai-Guo2
Received:2009-06-09
Accepted:2010-01-25
Online:2010-06-09
Published:2010-04-01
Contact:
ZHANG Jian-Guo
SUN Hong-Gang, ZHANG Jian-Guo, DUAN Ai-Guo. A comparison of selecting data points and fitting coefficients methods for estimating self-thinning boundary line[J]. Chin J Plant Ecol, 2010, 34(4): 409-417.
| 样地 Plot | 初植密度 Planting density (trees·hm-2) | 2006年林分密度 Stand density in 2006 (trees·hm-2) | 林分平均胸径 Mean diameter of breast height (cm) | 标准差 SD | 胸径最小值 Minimum diameter of breast height (cm) | 胸径最大值 Maximum diameter of breast height (cm) |
|---|---|---|---|---|---|---|
| B2 | 3 333 | 2 517 | 10.65 | 2.42 | 6.49 | 13.80 |
| B3 | 3 333 | 2 483 | 12.29 | 2.71 | 7.58 | 16.23 |
| C2 | 5 000 | 3 467 | 9.57 | 2.44 | 5.51 | 13.16 |
| C3 | 5 000 | 2 417 | 10.21 | 2.74 | 6.04 | 14.04 |
| D1 | 6 667 | 3 317 | 8.76 | 2.02 | 5.53 | 11.90 |
| D2 | 6 667 | 4 267 | 8.85 | 2.67 | 4.95 | 13.14 |
| D3 | 6 667 | 3 800 | 9.13 | 2.62 | 5.33 | 13.26 |
| E1 | 10 000 | 5 117 | 8.39 | 2.01 | 5.55 | 11.70 |
| E2 | 10 000 | 3 183 | 8.42 | 2.50 | 4.80 | 13.08 |
| E3 | 10 000 | 5 217 | 8.75 | 2.71 | 5.10 | 13.11 |
Table 1 Descriptive statistics of plots
| 样地 Plot | 初植密度 Planting density (trees·hm-2) | 2006年林分密度 Stand density in 2006 (trees·hm-2) | 林分平均胸径 Mean diameter of breast height (cm) | 标准差 SD | 胸径最小值 Minimum diameter of breast height (cm) | 胸径最大值 Maximum diameter of breast height (cm) |
|---|---|---|---|---|---|---|
| B2 | 3 333 | 2 517 | 10.65 | 2.42 | 6.49 | 13.80 |
| B3 | 3 333 | 2 483 | 12.29 | 2.71 | 7.58 | 16.23 |
| C2 | 5 000 | 3 467 | 9.57 | 2.44 | 5.51 | 13.16 |
| C3 | 5 000 | 2 417 | 10.21 | 2.74 | 6.04 | 14.04 |
| D1 | 6 667 | 3 317 | 8.76 | 2.02 | 5.53 | 11.90 |
| D2 | 6 667 | 4 267 | 8.85 | 2.67 | 4.95 | 13.14 |
| D3 | 6 667 | 3 800 | 9.13 | 2.62 | 5.33 | 13.26 |
| E1 | 10 000 | 5 117 | 8.39 | 2.01 | 5.55 | 11.70 |
| E2 | 10 000 | 3 183 | 8.42 | 2.50 | 4.80 | 13.08 |
| E3 | 10 000 | 5 217 | 8.75 | 2.71 | 5.10 | 13.11 |
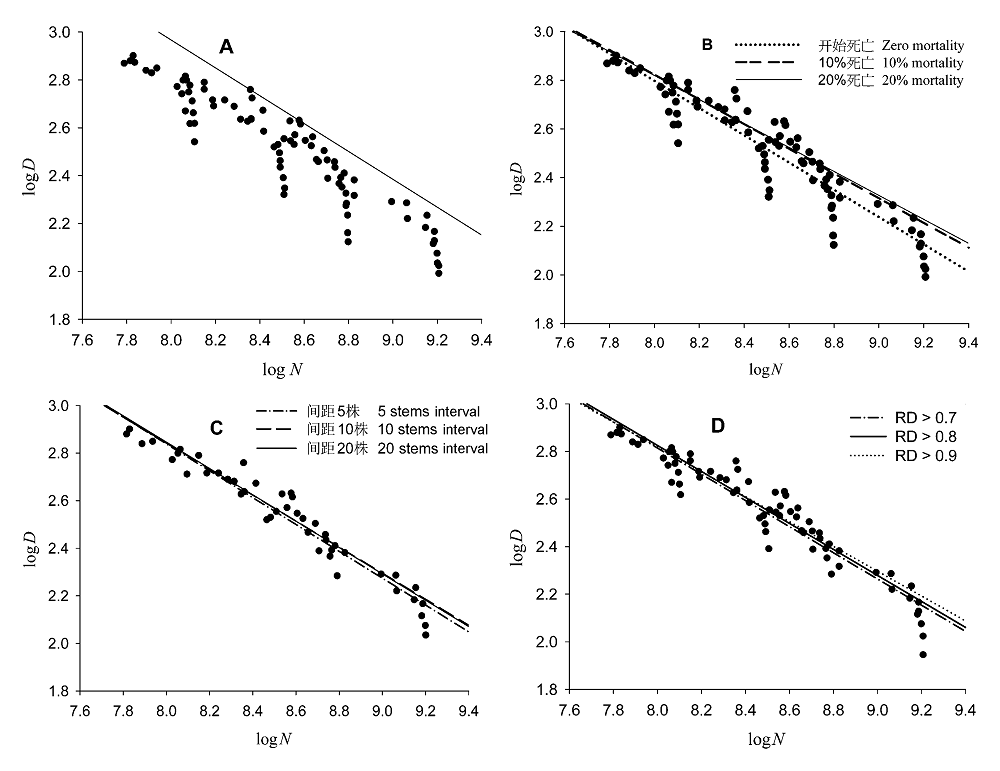
Fig. 1 Relationship between stand density (N) and mean diameter of breast height (D) under four regression methods. A, Visualized inspection. B, Mortality criterion. C, Equal intervals. D, Relative density (RD).
| 数据点选择方法及数量 Selecting data points and numbers (n) | 斜率(标准误差) Slope (SE) | 截距(标准误差) Intercept (SE) | R2 |
|---|---|---|---|
| 死亡率法 Mortality criterion | |||
| 开始死亡 Zero mortality (83) | -0.56 (0.046) | 7.28 (0.612) | 0.817 |
| 10%死亡 10% mortality (51) | -0.51 (0.037) | 6.79 (0.435) | 0.931 |
| 20%死亡 20% mortality (37) | -0.49 (0.029) | 6.19 (0.367) | 0.934 |
| 等距区间法 Equal intervals | |||
| 5株 5 stems (43) | -0.62 (0.071) | 7.91 (0.610) | 0.917 |
| 10株 10 stems (31) | -0.55 (0.069) | 7.26 (0.583) | 0.922 |
| 20株 20 stems (19) | -0.54 (0.089) | 7.23 (0.762) | 0.939 |
| 相对密度法 Relative density (RD) | |||
| RD > 0.7 (71) | -0.58 (0.069) | 7.14 (0.583) | 0.883 |
| RD > 0.8 (62) | -0.54 (0.056) | 7.09 (0.472) | 0.929 |
| RD > 0.9 (57) | -0.53 (0.057) | 6.70 (0.478) | 0.900 |
Table 2 Comparison of the selecting data points and fitting coefficients
| 数据点选择方法及数量 Selecting data points and numbers (n) | 斜率(标准误差) Slope (SE) | 截距(标准误差) Intercept (SE) | R2 |
|---|---|---|---|
| 死亡率法 Mortality criterion | |||
| 开始死亡 Zero mortality (83) | -0.56 (0.046) | 7.28 (0.612) | 0.817 |
| 10%死亡 10% mortality (51) | -0.51 (0.037) | 6.79 (0.435) | 0.931 |
| 20%死亡 20% mortality (37) | -0.49 (0.029) | 6.19 (0.367) | 0.934 |
| 等距区间法 Equal intervals | |||
| 5株 5 stems (43) | -0.62 (0.071) | 7.91 (0.610) | 0.917 |
| 10株 10 stems (31) | -0.55 (0.069) | 7.26 (0.583) | 0.922 |
| 20株 20 stems (19) | -0.54 (0.089) | 7.23 (0.762) | 0.939 |
| 相对密度法 Relative density (RD) | |||
| RD > 0.7 (71) | -0.58 (0.069) | 7.14 (0.583) | 0.883 |
| RD > 0.8 (62) | -0.54 (0.056) | 7.09 (0.472) | 0.929 |
| RD > 0.9 (57) | -0.53 (0.057) | 6.70 (0.478) | 0.900 |
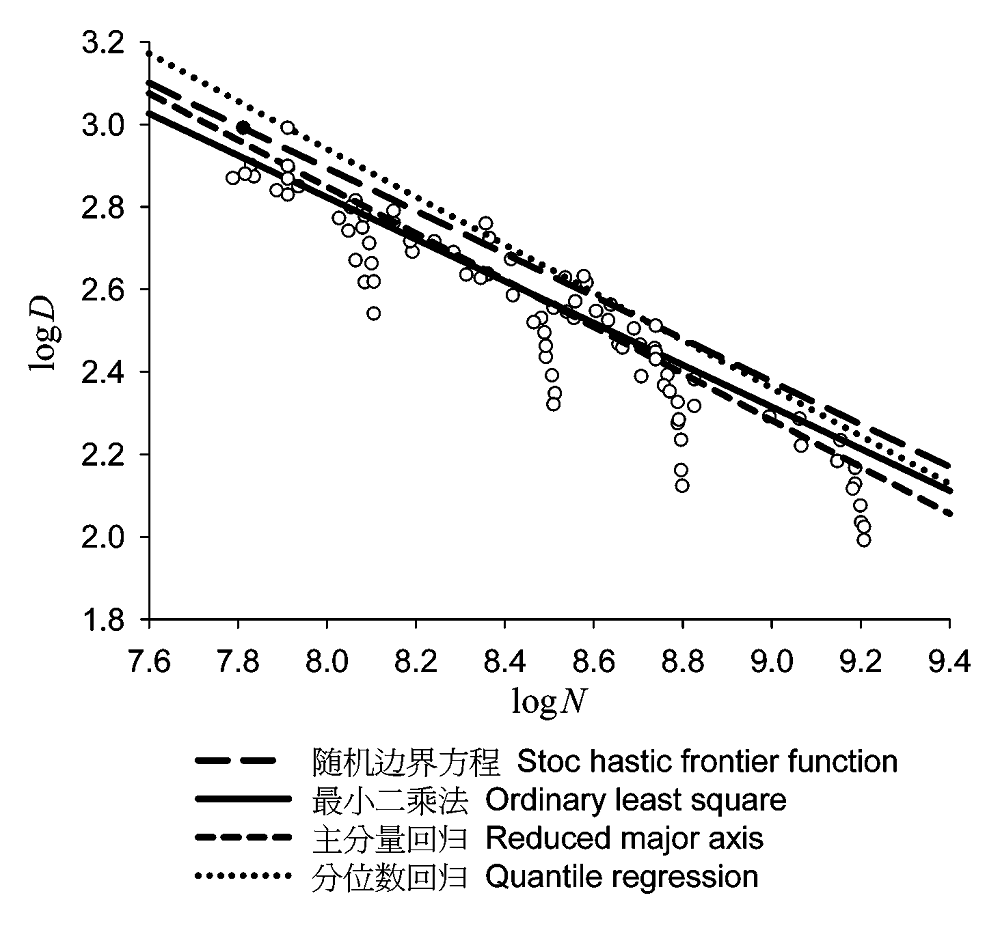
Fig. 2 Comparison of four fitting self-thinning boundary line methods.
| 回归方法 Regression technique | 斜率 Slope | 截距 Intercept |
|---|---|---|
| 随机边界方程 Stochastic frontier function | -0.52 | 7.03 |
| 最小二乘法 Ordinary least squares regression | -0.54 | 7.63 |
| 降维分析法 Reduced major axis | -0.57 | 7.39 |
| 分位数回归法 Quantile regression | -0.52 | 7.05 |
Table 3 Regression coefficients of the four models
| 回归方法 Regression technique | 斜率 Slope | 截距 Intercept |
|---|---|---|
| 随机边界方程 Stochastic frontier function | -0.52 | 7.03 |
| 最小二乘法 Ordinary least squares regression | -0.54 | 7.63 |
| 降维分析法 Reduced major axis | -0.57 | 7.39 |
| 分位数回归法 Quantile regression | -0.52 | 7.05 |
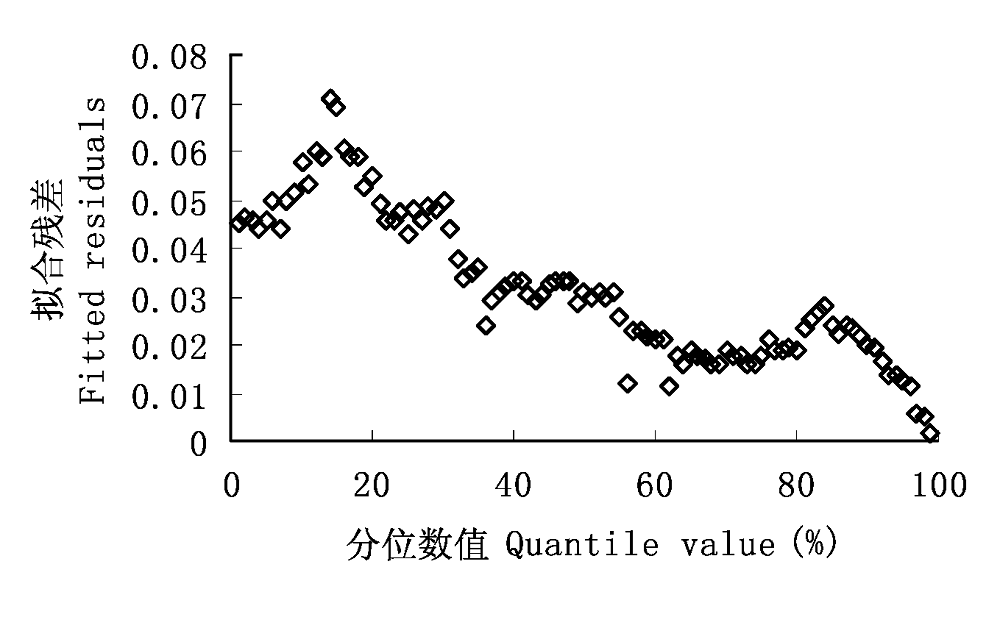
Fig. 3 Relationship between quantile value and fitted residuals.
| [1] | Bi H (2001). The self-thinning surface. Forest Science, 47, 361-370. |
| [2] | Bi H, Turvey ND (1997). A method of selecting data points for fitting the maximum biomass-density line for stand undergoing self-thinning. Australian Journal of Ecology, 22, 356-359. |
| [3] | Bi H, Wan G, Turvey ND (2000). Estimating the self-thinning boundary line as a density-dependent stochastic biomass frontier. Ecology, 81, 1477-1483. |
| [4] | Cade BS, Terrell JW, Schroeder RL (1999). Estimating effects of limiting factors with regression quantiles. Ecology, 80, 311-323. |
| [5] | Drew TJ, Flewelling JW (1979). Stand density management: an alternative approach and its application to Douglas-fir plantations. Forest Science, 25, 518-532. |
| [6] | Econometric Software (1998). LIMDEP 7. 0 User’s Manual (Computer Manual). Econometric Software. Plainview, New York, USA. |
| [7] | Enquist BJ, Brown JH, West GB (1998) . Allometric scaling of plant energetics and population density. Nature, 395, 163-165. |
| [8] | Fang JY (方精云) (1992). Self-thinning rule in plant population. Rural Eco-Environment (农村生态环境), 2, 7-12. (in Chinese with English abstract) |
| [9] | Fang JY (方精云), Jian C (菅诚), Yamakura T (1991). Relationships between population growth and population density in monocultures of Larix leptolepis. Acta Botanica Sinica (植物学报), 33, 949-957. (in Chinese with English abstract) |
| [10] | Gorham E (1979). Shoot height, weight and standing crop in relation to density of monospecific plant stands. Nature, 279, 148-150. |
| [11] | Jack SB, Long JN (1996). Linkages between silviculture and ecology: an analysis of density management diagrams. Forest Ecology and Management, 86, 205-220. |
| [12] | Kikuzawa K (1999). Theoretical relationships between mean plant size, size distribution and self thinning under one-sided competition. Annals of Botany, 83, 11-18. |
| [13] | Koenker R, Bassett G (1978). Regression quantiles. Econometrica, 46, 33-50. |
| [14] | LaBarbera M (1989). Analyzing body size as factor in ecology and evolution. Annual Review of Ecology and Systematics, 20, 97-117. |
| [15] | Li B, Wu H, Zou G (2000). Self-thinning rule: a causal interpretation from ecological field theory. Ecological Modelling, 132, 167-173. |
| [16] | Lonsdale W (1990). The self-thinning rule: dead or alive? Ecology, 71, 1373-1388. |
| [17] |
Long JN, Smith FW (1984). Relation between size and density in developing stands: a description and possible mechanisms. Forest Ecology and Management, 7, 191-206.
DOI URL |
| [18] |
Mohler C, Marks P, Sprugel DG (1978). Stand structure and allometry of trees during self-thinning of pure stands. Journal of Ecology, 66, 599-614.
DOI URL |
| [19] | Newton PF (2006). Asymptotic size-density relationships within self-thinning black spruce and jack pine stand- types: parameter estimation and model reformulations. Forest Ecology and Management, 226, 49-59. |
| [20] | Osawa A (1995). Inverse relationship of crown fractal dimension to self-thinning exponent of tree population: a hypothesis. Canadian Journal of Forestry Research, 25, 1608-1617. |
| [21] |
Osawa A, Allen RB (1993). Allometric theory explains self-thinning relationships of mountain beech and red pine. Ecology, 74, 1020-1032.
DOI URL |
| [22] |
Osawa A, Sugita S (1989). The self-thinning rule: another interpretation of Weller’s results. Ecology, 70, 279-283.
DOI URL |
| [23] | Río M, Montero G, Bravo F (2001). Analysis of diameter- density relationships and self-thinning in non-thinned even-aged Scots pine stands. Forest Ecology and Management, 142, 79-87. |
| [24] | Roderick ML, Barnes B (2004). Self-thinning of plant populations from a dynamic viewpoint. Functional Ecology, 18, 197-203. |
| [25] | SAS Institute (1999). SAS/STAT User's Guide, Version 8 (Computer Manual). SAS Institute Inc., Cary, New York, USA. |
| [26] | Scharf FS, Juanes F, Sutherland M (1998). Inferring ecological relationships from the edges of scatter diagrams: comparison of regression techniques. Ecology, 79, 448-460. |
| [27] | Solomon DS, Zhang L (2002). Maximum size-density relationships for mixed softwoods in the northeastern USA. Forest Ecology and Management, 155, 163-170. |
| [28] | Weller DE (1987). A reevaluation of the -3/2 power rule of plant self-thinning. Ecological Monographs, 57, 23-43. |
| [29] | Weller DE (1989). The interspecific size-density relationship among crowded plant stands and its implications for the -3/2 power rule of self-thinning. American Naturalist, 133, 20-41. |
| [30] | Westoby M (1984). The self-thinning rule. Advances in Ecological Research, 14, 167-225. |
| [31] | White J (1981). The allometric interpretation of the self- thinning rule. Journal of Theoretical Biology, 89, 475-500. |
| [32] | Wilson DS, Seymour RS, Maguire DA (1999). Density management diagram for Northeastern red spruce and balsam fir forests. Northern Journal of Applied Forestry, 16, 48-56. |
| [33] | Yang Y, Titus SJ (2002). Maximum size-density relationship for constraining individual tree mortality functions. Forest Ecology and Management, 168, 259-273. |
| [34] | Yoda K, Kira T, Ogawa H (1963). Self-thinning in overcrowded pure stand under cultivated and natural conditions. Journal of Biology of Osaka City University, 14, 107-129. |
| [35] | Zeide B (1987). Analysis of the 3/2 power law of self-thinning. Forest Science, 33, 517-537. |
| [1] | XIE Huan, ZHANG Qiu-Fang, ZENG Quan-Xin, ZHOU Jia-Cong, MA Ya-Pei, WU Yue, LIU Yuan-Yuan, LIN Hui-Ying, YIN Yun-Feng, CHEN Yue-Min. Effects of nitrogen addition on phosphorus transformation and decomposition fungi in seedling stage of Cunninghamia lanceolata [J]. Chin J Plant Ecol, 2022, 46(2): 220-231. |
| [2] | LÜ Zhong-Cheng, KANG Wen-Xing, HUANG Zhi-Hong, ZHAO Zhong-Hui, DENG Xiang-Wen. Reuse of retranslocated nutrients in tissues of Chinese fir in plantations of different ages [J]. Chin J Plant Ecol, 2019, 43(5): 458-470. |
| [3] | SHEN Fang-Fang, LI Yan-Yan, LIU Wen-Fei, DUAN Hong-Lang, FAN Hou-Bao, HU Liang, MENG Qing-Yin. Responses of nitrogen and phosphorus resorption from leaves and branches to long-term nitrogen deposition in a Chinese fir plantation [J]. Chin J Plant Ecol, 2018, 42(9): 926-937. |
| [4] | PENG Xi, YAN Wen-De, WANG Feng-Qi, WANG Guang-Jun, YU Fang-Yong, ZHAO Mei-Fang. Specific leaf area estimation model building based on leaf dry matter content of Cunninghamia lanceolata [J]. Chin J Plant Ecol, 2018, 42(2): 209-219. |
| [5] | CHEN Ri-Sheng, KANG Wen-Xing, ZHOU Yu-Quan, TIAN Da-Lun, XIANG Wen-Hua . Changes in nutrient cycling with age in a Cunninghamia lanceolata plantation forest [J]. Chin J Plan Ecolo, 2018, 42(2): 173-184. |
| [6] | CHEN Si-Tong, ZOU Xian-Hua, CAI Yi-Bing, WEI Dan, LI Tao, WU Peng-Fei, MA Xiang-Qing. Phosphorus distribution inside Chinese fir seedlings under different P supplies based on 32P tracer [J]. Chin J Plant Ecol, 2018, 42(11): 1103-1112. |
| [7] | Shun-Zeng SHI, De-Cheng XIONG, Fei DENG, Jian-Xin FENG, Chen-Sen XU, Bo-Yuan ZHONG, Yun-Yu CHEN, Guang-Shui CHEN, Yu-Sheng YANG. Interactive effects of soil warming and nitrogen addition on fine root production of Chinese fir seedlings [J]. Chin J Plan Ecolo, 2017, 41(2): 186-195. |
| [8] | Zhi-Yu CHEN, Qi LI, Xian-Hua ZOU, Xiang-Qing MA, Peng-Fei WU. Effect of neighboring competition on photosynthetic characteristics and biomass allocation of Chinese fir seedlings under low phosphorus stress [J]. Chin J Plant Ecol, 2016, 40(2): 177-. |
| [9] | Xiang GU, Shi-Ji ZHANG, Wen-Hua XIANG, Lei-Da LI, Zhao-Dan LIU, Wei-Jun SUN, Xi FANG. Seasonal dynamics of active soil organic carbon in four subtropical forests in Southern China [J]. Chin J Plant Ecol, 2016, 40(10): 1064-1076. |
| [10] | WAN Jing-Juan,GUO Jian-Fen,JI Shu-Rong,REN Wei-Ling,SI You-Tao,YANG Yu-Sheng. Effects of different sources of dissolved organic matter on soil CO2 emission in subtropical forests [J]. Chin J Plan Ecolo, 2015, 39(7): 674-681. |
| [11] | WANG Qing-Kui,LI Yan-Peng,ZHANG Fang-Yue,HE Tong-Xin. Short-term nitrogen fertilization decreased root and microbial respiration in a young Cunninghamia lanceolata plantation [J]. Chin J Plan Ecolo, 2015, 39(12): 1166-1175. |
| [12] | LIU Rong-Jie, WU Ya-Cong, ZHANG Ying, LI Zheng-Cai, MA Shao-Jie, WANG Bin, GERI Le-Tu. Comparison of soil labile organic carbon in Chinese fir plantations and natural secondary forests in north subtropical areas of China [J]. Chin J Plant Ecol, 2012, 36(5): 431-437. |
| [13] | LIU Jia, XIANG Wen-Hua, XU Xiao, CHEN Rui, TIAN Da-Lun, PENG Chang-Hui, FANG Xi. Analysis of architecture and functions of fine roots of five subtropical tree species in Huitong, Hunan Province, China [J]. Chin J Plant Ecol, 2010, 34(8): 938-945. |
| [14] | HE Qian, LI Ji-Yue, CHEN Xiao-Yang, CHEN Hong-Yue, PENG Hua-Gui, FAN Shun-Jiang. Types and extent of damage to Cunninghamia lanceolata plantations due to unusually heavy snow and ice in southern China [J]. Chin J Plant Ecol, 2010, 34(2): 195-203. |
| [15] | WANG Guang-Jun, TIAN Da-Lun, YAN Wen-De, ZHU Fan, XIANG Wen-Hua, LIANG Xiao-Cui. EFFECTS OF ABOVEGROUND LITTER EXCLUSION AND ADDITION ON SOIL RESPIRATION IN A CUNNINGHAMIA LANCEOLATA PLANTATION IN CHINA [J]. Chin J Plant Ecol, 2009, 33(4): 739-747. |
| Viewed | ||||||
|
Full text |
|
|||||
|
Abstract |
|
|||||
Copyright © 2022 Chinese Journal of Plant Ecology
Tel: 010-62836134, 62836138, E-mail: apes@ibcas.ac.cn, cjpe@ibcas.ac.cn