
植物生态学报 ›› 2017, Vol. 41 ›› Issue (1): 43-52.DOI: 10.17521/cjpe.2016.0174
所属专题: 中国灌丛生态系统碳储量的研究; 碳循环
张蔷1,2, 李家湘3, 徐文婷1, 熊高明1, 谢宗强1,*( )
)
收稿日期:2016-05-17
接受日期:2016-09-21
出版日期:2017-01-10
发布日期:2017-01-23
通讯作者:
谢宗强
作者简介:* 通信作者Author for correspondence (E-mail:基金资助:
Qiang ZHANG1,2, Jia-Xiang LI3, Wen-Ting XU1, Gao-Ming XIONG1, Zong-Qiang XIE1,*()
Received:2016-05-17
Accepted:2016-09-21
Online:2017-01-10
Published:2017-01-23
Contact:
Zong-Qiang XIE
About author:KANG Jing-yao(1991-), E-mail: 摘要:
灌丛生态系统作为一个巨大的潜在碳汇, 在全球碳平衡和气候调节中发挥着重要的作用。杜鹃(Rhododendron simsii)灌丛是我国亚热带山地最为常见的灌丛类型。该文采用群落调查和数学模拟方法, 研究了中亚热带山地杜鹃灌丛的生物量和碳密度。结果表明: 1)灌木各器官最佳生物量估测模型的函数类型为幂函数和线性函数, 自变量为D和D2H (D为基径, H为株高), 所有模型均达到极显著水平; 生长方程对茎生物量的拟合效果优于其对叶和当年枝生物量的拟合效果。2)灌木层平均生物量为20.78 Mg·hm-2, 其中优势树种杜鹃和白檀(Symplocos paniculata)占93.63%; 灌木层各器官生物量排序为茎>根>叶>当年枝, 根冠比为0.32, 说明生物量更多地分配到地上光合器官, 体现了灌木层植物对该区域温暖湿润的环境条件的适应。3)杜鹃灌丛群落平均总生物量为26.26 Mg·hm-2, 灌木层、草本层和凋落物层生物量分别占79.14%、7.62%和13.25%, 凋落物层生物量较高表明该研究群落具有较大的养分归还量。4)灌木层和草本层的地上生物量与地下生物量和总生物量之间存在极显著相关关系, 这种关系可用于相互间的预测。5)杜鹃灌丛群落平均总生物量碳密度为11.70 Mg·hm-2, 群落平均含碳率为44.55%, 以往通过乘以转换系数0.5得到的灌丛碳密度比实际碳密度高出12.22%, 导致对灌丛植被碳储量和碳汇能力的估测产生严重偏差。
张蔷, 李家湘, 徐文婷, 熊高明, 谢宗强. 中国亚热带山地杜鹃灌丛生物量分配及其碳密度估算. 植物生态学报, 2017, 41(1): 43-52. DOI: 10.17521/cjpe.2016.0174
Qiang ZHANG, Jia-Xiang LI, Wen-Ting XU, Gao-Ming XIONG, Zong-Qiang XIE. Estimation of biomass allocation and carbon density of Rhododendron simsii shrubland in the subtropical mountainous areas of China. Chinese Journal of Plant Ecology, 2017, 41(1): 43-52. DOI: 10.17521/cjpe.2016.0174
| 物种 Species | 器官 Organ | 自变量 Variable | 方程 Equation | 样本数 Number of samples | a | b | R2 | 标准误差 Standard error | F值 F value |
|---|---|---|---|---|---|---|---|---|---|
| 杜鹃 | 根 Root | x = D | y = axb | 40 | 0.010 2 | 2.428 5 | 0.714 | 0.347 9 | 94.85*** |
| Rhododendron | 茎 Stem | x = D | y = axb | 45 | 0.035 7 | 2.332 0 | 0.928 | 0.189 6 | 550.97*** |
| simsii | 叶 Leaf | x = D | y = axb | 43 | 0.003 7 | 2.122 5 | 0.714 | 0.393 2 | 102.48*** |
| 当年枝 Annual branch | x = D | y = axb | 45 | 0.000 4 | 2.975 0 | 0.608 | 0.695 6 | 66.57*** | |
| 地上 Aboveground | x = D | y = axb | 45 | 0.040 2 | 2.310 8 | 0.926 | 0.190 3 | 537.30*** | |
| 总 Total | x = D | y = axb | 43 | 0.054 6 | 2.227 2 | 0.895 | 0.221 5 | 348.07*** | |
| 白檀 | 根 Root | x = D | y = axb | 30 | 0.019 5 | 2.461 8 | 0.912 | 0.267 2 | 290.07*** |
| Symplocos | 茎 Stem | x = D2H | y = axb | 30 | 0.023 0 | 0.981 0 | 0.949 | 0.213 1 | 518.53*** |
| paniculata | 叶 Leaf | x = D | y = axb | 29 | 0.004 5 | 2.406 1 | 0.880 | 0.316 2 | 197.48*** |
| 当年枝 Annual branch | x = D2H | y = a + bx | 27 | 0.000 6 | 0.004 1 | 0.799 | 0.008 0 | 99.38*** | |
| 地上 Aboveground | x = D2H | y = axb | 30 | 0.029 4 | 0.962 6 | 0.948 | 0.210 0 | 514.51*** | |
| 总 Total | x = D2H | y = axb | 30 | 0.049 1 | 0.941 3 | 0.943 | 0.215 5 | 466.99*** | |
| 落叶混合种 | 根 Root | x = D2H | y = axb | 32 | 0.016 2 | 0.842 4 | 0.776 | 0.663 9 | 103.73*** |
| Mixed deciduous | 茎 Stem | x = D2H | y = a + bx | 32 | 0.024 4 | 0.027 4 | 0.945 | 0.116 0 | 495.86*** |
| species | 叶 Leaf | x = D2H | y = axb | 29 | 0.005 4 | 0.815 5 | 0.866 | 0.497 2 | 174.31*** |
| 当年枝 Annual branch | x = D2H | y = axb | 13 | 0.004 9 | 0.681 2 | 0.801 | 0.645 8 | 44.38*** | |
| 地上 Aboveground | x = D2H | y = a + bx | 31 | 0.011 2 | 0.032 0 | 0.981 | 0.077 4 | 1530.32*** | |
| 总 Total | x = D2H | y = axb | 30 | 0.057 3 | 0.885 9 | 0.947 | 0.303 7 | 502.33*** | |
| 常绿混合种 | 根 Root | x = D2H | y = axb | 159 | 0.055 7 | 0.644 6 | 0.684 | 0.673 6 | 339.36*** |
| Mixed evergreen | 茎 Stem | x = D2H | y = axb | 158 | 0.040 2 | 0.941 7 | 0.902 | 0.433 9 | 1432.91*** |
| species | 叶 Leaf | x = D2H | y = axb | 165 | 0.019 0 | 0.611 3 | 0.695 | 0.618 0 | 370.74*** |
| 当年枝 Annual branch | x = D2H | y = a + bx | 155 | 0.000 6 | 0.016 0 | 0.751 | 0.012 7 | 460.53*** | |
| 地上 Aboveground | x = D2H | y = axb | 158 | 0.068 1 | 0.854 8 | 0.908 | 0.381 0 | 1531.39*** | |
| 总 Total | x = D2H | y = axb | 160 | 0.117 1 | 0.810 5 | 0.893 | 0.391 2 | 1312.23*** |
表1 杜鹃灌丛灌木物种的生物量回归模型
Table 1 Regression models for biomass of shrub species in Rhododendron shrubland
| 物种 Species | 器官 Organ | 自变量 Variable | 方程 Equation | 样本数 Number of samples | a | b | R2 | 标准误差 Standard error | F值 F value |
|---|---|---|---|---|---|---|---|---|---|
| 杜鹃 | 根 Root | x = D | y = axb | 40 | 0.010 2 | 2.428 5 | 0.714 | 0.347 9 | 94.85*** |
| Rhododendron | 茎 Stem | x = D | y = axb | 45 | 0.035 7 | 2.332 0 | 0.928 | 0.189 6 | 550.97*** |
| simsii | 叶 Leaf | x = D | y = axb | 43 | 0.003 7 | 2.122 5 | 0.714 | 0.393 2 | 102.48*** |
| 当年枝 Annual branch | x = D | y = axb | 45 | 0.000 4 | 2.975 0 | 0.608 | 0.695 6 | 66.57*** | |
| 地上 Aboveground | x = D | y = axb | 45 | 0.040 2 | 2.310 8 | 0.926 | 0.190 3 | 537.30*** | |
| 总 Total | x = D | y = axb | 43 | 0.054 6 | 2.227 2 | 0.895 | 0.221 5 | 348.07*** | |
| 白檀 | 根 Root | x = D | y = axb | 30 | 0.019 5 | 2.461 8 | 0.912 | 0.267 2 | 290.07*** |
| Symplocos | 茎 Stem | x = D2H | y = axb | 30 | 0.023 0 | 0.981 0 | 0.949 | 0.213 1 | 518.53*** |
| paniculata | 叶 Leaf | x = D | y = axb | 29 | 0.004 5 | 2.406 1 | 0.880 | 0.316 2 | 197.48*** |
| 当年枝 Annual branch | x = D2H | y = a + bx | 27 | 0.000 6 | 0.004 1 | 0.799 | 0.008 0 | 99.38*** | |
| 地上 Aboveground | x = D2H | y = axb | 30 | 0.029 4 | 0.962 6 | 0.948 | 0.210 0 | 514.51*** | |
| 总 Total | x = D2H | y = axb | 30 | 0.049 1 | 0.941 3 | 0.943 | 0.215 5 | 466.99*** | |
| 落叶混合种 | 根 Root | x = D2H | y = axb | 32 | 0.016 2 | 0.842 4 | 0.776 | 0.663 9 | 103.73*** |
| Mixed deciduous | 茎 Stem | x = D2H | y = a + bx | 32 | 0.024 4 | 0.027 4 | 0.945 | 0.116 0 | 495.86*** |
| species | 叶 Leaf | x = D2H | y = axb | 29 | 0.005 4 | 0.815 5 | 0.866 | 0.497 2 | 174.31*** |
| 当年枝 Annual branch | x = D2H | y = axb | 13 | 0.004 9 | 0.681 2 | 0.801 | 0.645 8 | 44.38*** | |
| 地上 Aboveground | x = D2H | y = a + bx | 31 | 0.011 2 | 0.032 0 | 0.981 | 0.077 4 | 1530.32*** | |
| 总 Total | x = D2H | y = axb | 30 | 0.057 3 | 0.885 9 | 0.947 | 0.303 7 | 502.33*** | |
| 常绿混合种 | 根 Root | x = D2H | y = axb | 159 | 0.055 7 | 0.644 6 | 0.684 | 0.673 6 | 339.36*** |
| Mixed evergreen | 茎 Stem | x = D2H | y = axb | 158 | 0.040 2 | 0.941 7 | 0.902 | 0.433 9 | 1432.91*** |
| species | 叶 Leaf | x = D2H | y = axb | 165 | 0.019 0 | 0.611 3 | 0.695 | 0.618 0 | 370.74*** |
| 当年枝 Annual branch | x = D2H | y = a + bx | 155 | 0.000 6 | 0.016 0 | 0.751 | 0.012 7 | 460.53*** | |
| 地上 Aboveground | x = D2H | y = axb | 158 | 0.068 1 | 0.854 8 | 0.908 | 0.381 0 | 1531.39*** | |
| 总 Total | x = D2H | y = axb | 160 | 0.117 1 | 0.810 5 | 0.893 | 0.391 2 | 1312.23*** |
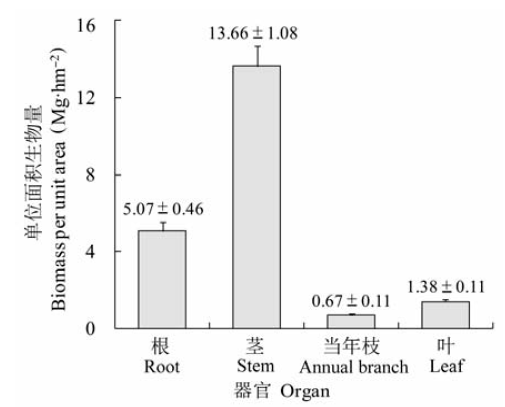
图1 杜鹃灌丛灌木层生物量及其分配(平均值±标准误差)。
Fig. 1 The biomass allocation pattern of the shrub layer in Rhododendron shrubland (mean ± SE).
| 物种 Species | 植株个体 Individuals | 生物量 Biomass | |||
|---|---|---|---|---|---|
| 密度 Density (No.·hm-2) | 占灌木层比例 Ratio of the shrub layer (%) | 生物量 Biomass (kg·hm-2) | 占灌木层比例 Ratio of the shrub layer (%) | ||
| 杜鹃 Rhododendron simsii | 84 074 | 87.54 | 15 988.05 | 79.61 | |
| 白檀 Symplocos paniculata | 6 711 | 6.99 | 2 816.53 | 14.02 | |
| 尖叶日本绣线菊 Spiraea japonica var. acuminata | 1 556 | 1.62 | 101.83 | 0.51 | |
| 四川冬青 Ilex szechwanensis | 1 452 | 1.51 | 210.97 | 1.05 | |
| 直角荚蒾 Viburnum foetidum var. rectangulatum | 548 | 0.57 | 37.04 | 0.18 | |
| 格药柃 Eurya muricata | 430 | 0.45 | 83.18 | 0.41 | |
| 圆锥绣球 Hydrangea paniculata | 370 | 0.39 | 315.98 | 1.57 | |
| 波叶红果树 Stranvaesia davidiana var. undulata | 237 | 0.25 | 41.76 | 0.21 | |
| 水马桑 Weigela japonica var. sinica | 207 | 0.22 | 46.94 | 0.23 | |
| 鹿角杜鹃 Rhododendron latoucheae | 148 | 0.15 | 239.75 | 1.19 | |
| 尾叶樱桃 Cerasus dielsiana | 104 | 0.11 | 124.24 | 0.62 | |
| 中国绣球 Hydrangea chinensis | 44 | 0.05 | 19.27 | 0.10 | |
| 四照花 Dendrobenthamia japonica var. chinensis | 44 | 0.05 | 8.90 | 0.04 | |
| 石灰花楸 Sorbus folgneri | 30 | 0.03 | 11.34 | 0.06 | |
| 紫珠 Callicarpa bodinieri var. bodinieri | 30 | 0.03 | 6.79 | 0.03 | |
| 胡颓子 Elaeagnus pungens | 15 | 0.02 | 18.66 | 0.09 | |
| 三桠乌药 Lindera obtusiloba | 15 | 0.02 | 7.69 | 0.04 | |
| 小叶栎 Quercus chenii | 15 | 0.02 | 2.90 | 0.01 | |
| 长叶冻绿 Rhamnus crenata | 15 | 0.02 | 1.13 | 0.01 | |
表2 杜鹃灌丛灌木层个体密度和生物量的种类分配
Table 2 Individual density and biomass allocation of shrub layer in different species
| 物种 Species | 植株个体 Individuals | 生物量 Biomass | |||
|---|---|---|---|---|---|
| 密度 Density (No.·hm-2) | 占灌木层比例 Ratio of the shrub layer (%) | 生物量 Biomass (kg·hm-2) | 占灌木层比例 Ratio of the shrub layer (%) | ||
| 杜鹃 Rhododendron simsii | 84 074 | 87.54 | 15 988.05 | 79.61 | |
| 白檀 Symplocos paniculata | 6 711 | 6.99 | 2 816.53 | 14.02 | |
| 尖叶日本绣线菊 Spiraea japonica var. acuminata | 1 556 | 1.62 | 101.83 | 0.51 | |
| 四川冬青 Ilex szechwanensis | 1 452 | 1.51 | 210.97 | 1.05 | |
| 直角荚蒾 Viburnum foetidum var. rectangulatum | 548 | 0.57 | 37.04 | 0.18 | |
| 格药柃 Eurya muricata | 430 | 0.45 | 83.18 | 0.41 | |
| 圆锥绣球 Hydrangea paniculata | 370 | 0.39 | 315.98 | 1.57 | |
| 波叶红果树 Stranvaesia davidiana var. undulata | 237 | 0.25 | 41.76 | 0.21 | |
| 水马桑 Weigela japonica var. sinica | 207 | 0.22 | 46.94 | 0.23 | |
| 鹿角杜鹃 Rhododendron latoucheae | 148 | 0.15 | 239.75 | 1.19 | |
| 尾叶樱桃 Cerasus dielsiana | 104 | 0.11 | 124.24 | 0.62 | |
| 中国绣球 Hydrangea chinensis | 44 | 0.05 | 19.27 | 0.10 | |
| 四照花 Dendrobenthamia japonica var. chinensis | 44 | 0.05 | 8.90 | 0.04 | |
| 石灰花楸 Sorbus folgneri | 30 | 0.03 | 11.34 | 0.06 | |
| 紫珠 Callicarpa bodinieri var. bodinieri | 30 | 0.03 | 6.79 | 0.03 | |
| 胡颓子 Elaeagnus pungens | 15 | 0.02 | 18.66 | 0.09 | |
| 三桠乌药 Lindera obtusiloba | 15 | 0.02 | 7.69 | 0.04 | |
| 小叶栎 Quercus chenii | 15 | 0.02 | 2.90 | 0.01 | |
| 长叶冻绿 Rhamnus crenata | 15 | 0.02 | 1.13 | 0.01 | |
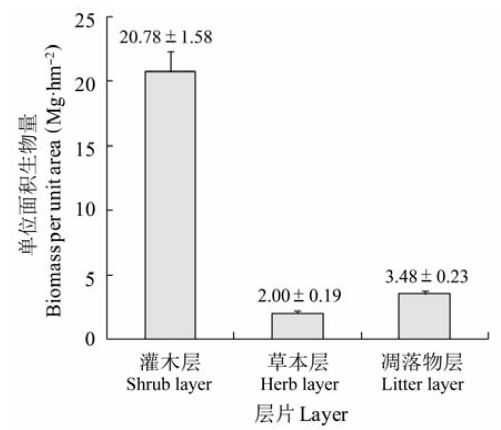
图2 杜鹃灌丛群落生物量在层片间的分配(平均值±标准 误差)。
Fig. 2 The community biomass allocation pattern of Rhododendron shrubland in different layers (mean ± SE).
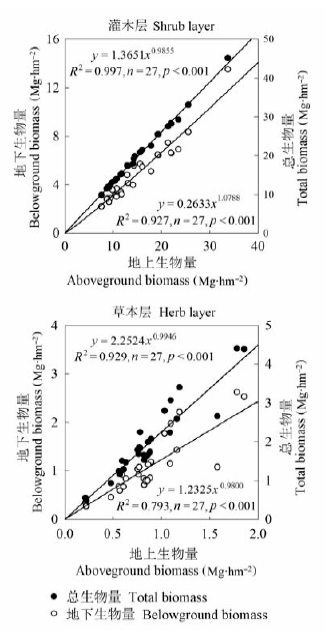
图3 杜鹃灌丛灌木层和草本层地上/地下生物量之间的相关关系。
Fig. 3 The relationship between above- and belowground biomass of the shrub layer and the herb layer in Rhododendron shrubland.
| 灌木层碳密度 Shrub layer carbon density | 草本层碳密度 Herb layer carbon density | 凋落物层碳密度 Litter layer carbon density | 总碳密度 Total carbon density | ||||
|---|---|---|---|---|---|---|---|
| 根碳密度 Root carbon density | 茎碳密度 Stem carbon density | 叶碳密度 Leaf carbon density | 当年枝碳密度 Annual branch carbon density | ||||
| 地上部分碳密度 Aboveground carbon density | 6.38 (0.50) | 0.62 (0.05) | 0.30 (0.05) | 0.35 (0.03) | 7.65 (0.57) | ||
| 地下部分碳密度 Belowground carbon density | 2.18 (0.19) | 0.31 (0.03) | 2.48 (0.18) | ||||
| 总碳密度 Total carbon density | 9.48 (0.77) | 0.66 (0.06) | 1.56 (0.11) | 11.70 (0.74) | |||
表3 杜鹃灌丛生物量碳密度的估算
Table 3 Estimation of biomass carbon density of Rhododendron shrubland (Mg·hm-2)
| 灌木层碳密度 Shrub layer carbon density | 草本层碳密度 Herb layer carbon density | 凋落物层碳密度 Litter layer carbon density | 总碳密度 Total carbon density | ||||
|---|---|---|---|---|---|---|---|
| 根碳密度 Root carbon density | 茎碳密度 Stem carbon density | 叶碳密度 Leaf carbon density | 当年枝碳密度 Annual branch carbon density | ||||
| 地上部分碳密度 Aboveground carbon density | 6.38 (0.50) | 0.62 (0.05) | 0.30 (0.05) | 0.35 (0.03) | 7.65 (0.57) | ||
| 地下部分碳密度 Belowground carbon density | 2.18 (0.19) | 0.31 (0.03) | 2.48 (0.18) | ||||
| 总碳密度 Total carbon density | 9.48 (0.77) | 0.66 (0.06) | 1.56 (0.11) | 11.70 (0.74) | |||
| [1] | Araújo TM, Higuchi N, de Carvalho Júnior JADC (1999). Comparison of formulae for biomass content determina- tion in a tropical rain forest site in the state of Pará, Brazil.Forest Ecology and Management, 117, 43-52. |
| [2] | Basuki T, van Laake P, Skidmore A, Hussin Y (2009). Allometric equations for estimating the above-ground biomass in tropical lowland Dipterocarp forests.Forest Ecology and Management, 257, 1684-1694. |
| [3] | Bloom AJ, Chapin FS, Mooney HA (1985). Resource limitation in plants—An economic analogy.Annual Review of Ecology and Systematics, 16, 363-392. |
| [4] | Cairns MA, Brown S, Helmer EH, Baumgardner GA (1997). Root biomass allocation in the world’s upland forests.Oecologia, 111, 1-11. |
| [5] | Chun ML, Xie ZQ, Zhao CM, Fan DY, Xu XW, Ping L (2009). Litter production and nutrient characteristic of Abies far-gesii natural forest in Shennongjia Nature Reserve, Hubei, China. Chinese Journal of Plant Ecology, 33, 492-498. (in Chinese with English abstract)[春敏莉, 谢宗强, 赵常明, 樊大勇, 徐新武, 平亮 (2009). 神农架巴山冷杉天然林凋落量及养分特征. 植物生态学报, 33, 492-498.] |
| [6] | Fang JY, Chen AP (2001). Dynamic forest biomass carbon pools in China and their significance.Acta Botanica Sinica, 43, 967-973. (in Chinese with English abstract)[方精云, 陈安平 (2001). 中国森林植被碳库的动态变化及其意义. 植物学报, 43, 967-973.] |
| [7] | Fang JY, Guo ZD, Piao SL, Chen AP (2007). Estimation of carbon sink of terrestrial vegetation in 1981-2000.Science in China: Series D, 37, 804-812. (in Chinese)[方精云, 郭兆迪, 朴世龙, 陈安平 (2007). 1981-2000年中国陆地植被碳汇的估算. 中国科学D辑, 37, 804-812.] |
| [8] | Gao Q, Yang XC, Yin CY, Liu Q (2014). Estimation of biomass allocation and carbon density in alpine dwarf shrubs in Garzê Zangzu Autonomous Prefecture of Sichuan Province.Chinese Journal of Plant Ecology, 38, 355-365. (in Chinese with English abstract)[高巧, 阳小成, 尹春英, 刘庆 (2014). 四川省甘孜藏族自治州高寒矮灌丛生物量分配及其碳密度的估算. 植物生态学报, 38, 355-365.] |
| [9] | Goodale CL, Davidson EA (2002). Carbon cycle: Uncertain sinks in the shrubs.Nature, 418, 593-594. |
| [10] | He JS, Wang QB, Hu D (1997). Studies on the biomass of topical shrubland and their regeneration capacity after cutting.Acta Phytoecologica Sinica, 21, 512-520. (in Chinese with English abstract)[贺金生, 王其兵, 胡东 (1997). 长江三峡地区典型灌丛的生物量及其再生能力. 植物生态学报, 21, 512-520.] |
| [11] | Hou L (2009). Carbon Balance in Natural Secondary Pinus tabulaeformis Forest at Huoditang Forest Zone in the Qinling Mountains. PhD dissertation, Northwest A & F University, Yangling, Shaanxi. 30-32. (in Chinese with English abstract)[侯琳 (2009). 秦岭火地塘林区天然次生油松林碳平衡研究. 博士学位论文, 西北农林科技大学, 陕西杨凌. 30-32.] |
| [12] | Hu HF, Wang ZH, Liu GH, Fu BJ (2006). Vegetation carbon storage of major shrublands in China.Journal of Plant Ecology (Chinese Version), 30, 539-544. (in Chinese with English abstract)[胡会峰, 王志恒, 刘国华, 傅伯杰 (2006). 中国主要灌丛植被碳储量. 植物生态学报, 30, 539-544.] |
| [13] | Ketterings QM, Coe R, van Noordwijk M, Palm CA (2001). Reducing uncertainty in the use of allometric biomass equations for predicting above-ground tree biomass in mixed secondary forests.Forest Ecology and Management, 146, 199-209. |
| [14] | Li JX (2015). Biodiversity Pattern and Ecosystem Productivity in Shrubland Across the Subtropical Region in China. PhD dissertation, Institute of Botany, Chinese Academy of Sciences, Beijing. 76-84. (in Chinese with English abstract).[李家湘 (2015). 亚热带灌丛生物多样性及其与生产力的关系. 博士学位论文, 中国科学院植物研究所, 北京. 76-84.] |
| [15] | Li JX, Zhang X, Xie ZQ, Lu CF, Tu XY, Xun Y (2015). Community composition and structure of Rhododendron simsii shrubland in the Dawei Mountain, Hunan Province. Biodiversity Science, 23, 815-823. (in Chinese with English abstract)[李家湘, 张旭, 谢宗强, 卢从发, 涂向阳, 寻院 (2015). 湖南大围山杜鹃灌丛的群落组成及结构特征. 生物多样性, 23, 815-823.] |
| [16] | Li XR, Liu JQ, Chen YR, Hu LL, Yang FT (2006). Aboveground biomass of three conifers in Qianyanzhou plantation.Chinese Journal of Applied Ecology, 17, 1382-1388. (in Chinese with English abstract)[李轩然, 刘琪璟, 陈永瑞, 胡理乐, 杨风亭 (2006). 千烟洲人工林主要树种地上生物量的估算. 应用生态学报, 17, 1382-1388.] |
| [17] | Li Y, Zhang JG, Duan AG, Xiang CW (2010). Selection of biomass estimation models for Chinese fir plantation.Chinese Journal of Applied Ecology, 21, 3036-3046. (in Chinese with English abstract)[李燕, 张建国, 段爱国, 相聪伟 (2010). 杉木人工林生物量估算模型的选择. 应用生态学报, 21, 3036-3046.] |
| [18] | Li YL, Gong HD (2015). Characteristics of community structure and biomass distribution of Rhododendron adenogynum shrub in Laojunshan Mountain. Journal of West China Forestry Science, 44, 121-124. (in Chinese with English abstract)[李云龙, 巩合德 (2015). 云南老君山腺房杜鹃灌丛群落特征及生物量分配特征研究. 西部林业科学, 44, 121-124.] |
| [19] | Lü XT, Tang JW, He YC, Duan WG, Song JP, Xu HL, Zhu SZ (2007). Biomass and its allocation in tropical seasonal rain forest in Xishuangbanna, southwest China.Journal of Plant Ecology (Chinese Version), 31, 11-22. (in Chinese with English abstract)[吕晓涛, 唐建维, 何有才, 段文贵, 宋军平, 许海龙, 朱胜忠 (2007). 西双版纳热带季节雨林的生物量及其分配特征. 植物生态学报, 31, 11-22.] |
| [20] | Mariessii A, Betule E, Toshihicoko H (1991). Growth patterns of tree height and stem diameter in populations ofAbies veitchi. Journal of Ecology, 79, 1085-1095. |
| [21] | McCarthy MC, Enquist BJ (2007). Consistency between an allometric approach and optimal partitioning theory in global patterns of plant biomass allocation.Functional Ecology, 21, 713-720. |
| [22] | McConnaughay K, Coleman J (1999). Biomass allocation in plants: Ontogeny or optimality? A test along three resource gradients.Ecology, 80, 2581-2593. |
| [23] | [中华人民共和国环境保护部, 中国科学院 (. Cited: 2016-05-17. |
| [24] | Mokany K, Raison RJ, Prokushkin AS (2006). Critical analysis of root:shoot ratios in terrestrial biomes.Global Change Biology, 12, 84-96. |
| [25] | Montes N, Gauquelin T, Badri W, Bertaudiere V, Zaoui EH (2000). A non-destructive method for estimating above- ground forest biomass in threatened woodlands.Forest Ecology and Management, 130, 37-46. |
| [26] | Návar J (2009). Allometric equations for tree species and carbon stocks for forests of northwestern Mexico.Forest Ecology and Management, 257, 427-434. |
| [27] | Poorter H, Niklas KJ, Reich PB, Oleksyn J, Poot P, Mommer L (2012). Biomass allocation to leaves, stems and roots: Meta-analyses of interspecific variation and environmental control.New Phytologist, 193, 30-50. |
| [28] | Spain AV (1984). Litterfall and the standing crop of litter in three topical Australian rain forests.Journal of Ecology, 72, 947-961. |
| [29] | Sturm M, Racine C, Tape K (2001). Climate change: Increasing shrub abundance in the Arctic.Nature, 411, 546-547. |
| [30] | Vourlitis GL, Zorba G, Pasquini SC, Mustard R (2007). Carbon and nitrogen storage in soil and litter of southern Californian semi-arid shrublands.Journal of arid Environments, 70, 164-173. |
| [31] | Wang JS, Zhang CY, Fan XH, Zhao YZ (2011). Biomass allo- cation patterns and allometric models of Abies nephrolepis Maxim. Acta Ecologica Sinica, 31, 3918-3927. (in Chinese with English abstract)[汪金松, 张春雨, 范秀华, 赵亚洲 (2011). 臭冷杉生物量分配格局及异速生长模型. 生态学报, 31, 3918-3927.] |
| [32] | Wang L (2009). Study of Biomass and Its Models of Main Shrub Community Type in Northwest Sichuan. Master de- gree dissertation, Sichuan Agricultural University, Ya’an, Sichuan. (in Chinese with English abstract)[王玲 (2009). 川西北地区主要灌丛类型生物量及其模型的研究. 硕士学位论文, 四川农业大学, 四川雅安.] |
| [33] | Weiner J (2004). Allocation, plasticity and allometry in plants.Perspectives in Plant Ecology, Evolution and Systematics, 6, 207-215. |
| [34] | Wei XP, Zhao CM, Wang GX, Chen BM, Cheng DL (2005). Estimation of above- and below-ground biomass of dominant desert plant species in an oasis-desert ecotone of Minqin, China.Acta Phytoecologica Sinica, 29, 878-883. (in Chinese with English abstract)[魏小平, 赵长明, 王根轩, 陈宝明, 程栋梁 (2005). 民勤荒漠绿洲过渡带优势植物地上和地下生物量的估测模型. 植物生态学报, 29, 878-883.] |
| [35] | Woodwell GM, Whitaker RH, Reiners WA, Likens GE, Delwich CC, Botkin DB (1978). Biota and the world carbon budget.Science, 199, 141-146. |
| [36] | Wu ZY (1980). Vegetation of China. Science Press, Beijing. (in Chinese).[吴征镒 (1980). 中国植被. 科学出版社, 北京.] |
| [37] | Zhang GF, Song YC (2001). Studies on the biomass of Castanopsis sclerophylla + Quercus fabri shrubland in Tiantong Region, Zhejiang Province. Journal of Wuhan Botanical Research, 19, 101-106. (in Chinese with English abstract)[张光富, 宋永昌 (2001). 浙江天童苦槠+白栎灌丛群落的生物量研究. 武汉植物学研究, 19, 101-106.] |
| [38] | Zhang Q, Li JX, Xie ZQ (2017). Effects of nitrogen addition on soil respiration of Rhododendron simsii shrubland in the subtropical mountainous areas of China. Chinese Journal of Plant Ecology, 41, 95-104. (in Chinese with English abstract)[张蔷, 李家湘, 谢宗强 (2017). 氮添加对亚热带山地杜鹃灌丛土壤呼吸的影响. 植物生态学报, 41, 95-104.] |
| [39] | Zhang YR, Ouyang X, Li YL, Liu SZ, Zhang DQ, Zhou GY (2013). Shrub community characteristics and quantitative calculation of theirs biomass in southern China.Journal of Central South University of Forestry & Technology, 33(9), 71-79. (in Chinese with English abstract)[张亚茹, 欧阳旭, 李跃林, 刘世忠, 张德强, 周国逸 (2013). 我国南亚热带灌丛群落特征及生物量的定量计算. 中南林业科技大学学报, 33(9), 71-79.] |
| [40] | Zheng SW, Tang M, Zou JH, Mu CL (2007). Summary of research on shrub biomass in China.Journal of Chengdu University (Natural Science Edition), 26, 189-192. (in Chinese with English abstract)[郑绍伟, 唐敏, 邹俊辉, 慕长龙 (2007). 灌木群落及生物量研究综述. 成都大学学报(自然科学版), 26, 189-192.] |
| [41] | Zianis D, Mencuccini M (2004). On simplifying allometric analyses of forest biomass.Forest Ecology and Management, 187, 311-332. |
| [1] | 黄玲, 王榛, 马泽, 杨发林, 李岚, SEREKPAYEV Nurlan, NOGAYEV Adilbek, 侯扶江. 长期放牧和氮添加对黄土高原典型草原长芒草种群生长的影响[J]. 植物生态学报, 2024, 48(3): 317-330. |
| [2] | 高敏, 缑倩倩, 王国华, 郭文婷, 张宇, 张妍. 低温胁迫对不同母树年龄柠条锦鸡儿种子萌发幼苗生理和生长的影响[J]. 植物生态学报, 2024, 48(2): 201-214. |
| [3] | 赵艳超, 陈立同. 土壤养分对青藏高原高寒草地生物量响应增温的调节作用[J]. 植物生态学报, 2023, 47(8): 1071-1081. |
| [4] | 郝晴, 黄昌. 森林地上生物量遥感估算研究综述[J]. 植物生态学报, 2023, 47(10): 1356-1374. |
| [5] | 董六文, 任正炜, 张蕊, 谢晨笛, 周小龙. 功能多样性比物种多样性更好解释氮添加对高寒草地生物量的影响[J]. 植物生态学报, 2022, 46(8): 871-881. |
| [6] | 陈丽, 田新民, 任正炜, 董六文, 谢晨笛, 周小龙. 养分添加对天山高寒草地植物多样性和地上生物量的影响[J]. 植物生态学报, 2022, 46(3): 280-289. |
| [7] | 黄侩侩, 胡刚, 庞庆玲, 张贝, 何业涌, 胡聪, 徐超昊, 张忠华. 放牧对中国亚热带喀斯特山地灌草丛物种组成与群落结构的影响[J]. 植物生态学报, 2022, 46(11): 1350-1363. |
| [8] | 刘超, 李平, 武运涛, 潘胜难, 贾舟, 刘玲莉. 一种基于数码相机图像和群落冠层结构调查的草地地上生物量估算方法[J]. 植物生态学报, 2022, 46(10): 1280-1288. |
| [9] | 李斐, 孙明伟, 钟尚志, 宋文政, 钟晓月, 孙伟. 不同光合类型牧草对干旱-复水的光合生理响应及生长适应策略[J]. 植物生态学报, 2022, 46(1): 74-87. |
| [10] | 陈哲, 汪浩, 王金洲, 石慧瑾, 刘慧颖, 贺金生. 基于物候相机归一化植被指数估算高寒草地植物地上生物量的季节动态[J]. 植物生态学报, 2021, 45(5): 487-495. |
| [11] | 袁锋, 王艳艳, 李茂瑾, 江传阳, 刘贺娜, 李坤玲, 洪滔, 吴承祯, 陈灿. 不同海岸距离上木麻黄凋落叶金属元素含量及归还量动态特征[J]. 植物生态学报, 2020, 44(8): 819-827. |
| [12] | 苗百岭, 梁存柱, 史亚博, 梁茂伟, 刘钟龄. 降水变化对内蒙古典型草原地上生物量的影响[J]. 植物生态学报, 2019, 43(7): 557-565. |
| [13] | 赵丹丹, 马红媛, 李阳, 魏继平, 王志春. 水分和养分添加对羊草功能性状和地上生物量的影响[J]. 植物生态学报, 2019, 43(6): 501-511. |
| [14] | 邹显花, 胡亚楠, 韦丹, 陈思同, 吴鹏飞, 马祥庆. 磷高效利用杉木对低磷胁迫的适应性与内源激素的相关性[J]. 植物生态学报, 2019, 43(2): 139-151. |
| [15] | 杨倩, 王娓, 曾辉. 氮添加对内蒙古退化草地植物群落多样性和生物量的影响[J]. 植物生态学报, 2018, 42(4): 430-441. |
| 阅读次数 | ||||||
|
全文 |
|
|||||
|
摘要 |
|
|||||
Copyright © 2022 版权所有 《植物生态学报》编辑部
地址: 北京香山南辛村20号, 邮编: 100093
Tel.: 010-62836134, 62836138; Fax: 010-82599431; E-mail: apes@ibcas.ac.cn, cjpe@ibcas.ac.cn
备案号: 京ICP备16067583号-19