
植物生态学报 ›› 2007, Vol. 31 ›› Issue (6): 1119-1131.DOI: 10.17521/cjpe.2007.0140 cstr: 32100.14.cjpe.2007.0140
所属专题: 生态系统碳水能量通量
米娜1,2, 于贵瑞2,*( ), 王盘兴1, 温学发2, 孙晓敏2, 张雷明2, 宋霞2, 王树森3
收稿日期:2006-10-16
接受日期:2007-02-22
出版日期:2007-10-16
发布日期:2007-11-30
作者简介:* E-mail: yugr@igsnrr.ac.cn基金资助:
MI Na1,2, YU Gui-Rui2,*(), WANG Pan-Xing1, WEN Xue-Fa2, SUN Xiao-Min2, ZHANG Lei-Ming2, SONG Xia2, WANG Shu-Sen3
Received:2006-10-16
Accepted:2007-02-22
Online:2007-10-16
Published:2007-11-30
摘要:
EALCO模型是一个基于生理生态学过程,模拟生态系统下垫面与大气之间水、热和碳通量交换的综合模型。将该模型应用在亚热带常绿针叶林,对其生态系统过程进行了模拟,以深入探讨季节性干旱对生态系统过程的影响。对EALCO模型进行了参数化与初始化并对模型的光合作用时段和落叶机制进行了改进,以更好地模拟亚热带人工针叶林生态系统。千烟洲通量观测站自2002年底开始应用涡度相关技术对中亚热带人工针叶林生态系统进行通量观测,该站点2003年经历了一次较严重的季节性干旱(由高温与少雨综合作用造成),降水量仅为多年平均值的65%,而2004年的年降水量与多年平均值较为接近,利用该站点2003和2004年特殊的气候条件,使用其通量观测数据对模型的模拟效果进行检验。从模拟结果的总体趋势来看,模型能较好地从半小时、日及年尺度上反映两年内土壤-植被-大气之间的碳交换状况。总初级生产力(Gross primary production, GPP)在一年中呈现单峰型变化,遇高温及干旱胁迫GPP值下降。由于受到干旱胁迫的影响,2003年GPP值比2004年偏低12.9%。模拟结果显示,2003年GPP值比2004年偏低11.2%。观测数据与模拟结果均显示,水分胁迫期间净碳交换量(Net ecosystem production, NEP)模拟值与实测值的日变化均呈现一种“偏态",即一天中生态系统碳交换量最大值出现在上午某一时刻,之后逐渐降低。模拟结果显示,水分匮缺对光合能力的影响比对生态系统呼吸作用的影响更为强烈,因而导致了净生态系统生产力的降低。进一步分析表明,水分匮缺期间,晴天正午之前,深层土壤(>20 cm) 水分的匮缺抑制了光合作用能力,正午之后,高温与深层土壤水分匮缺共同削弱光合作用能力,影响各占一半。
米娜, 于贵瑞, 王盘兴, 温学发, 孙晓敏, 张雷明, 宋霞, 王树森. 基于EALCO模型对中亚热带人工针叶林CO2通量季节变异的模拟. 植物生态学报, 2007, 31(6): 1119-1131. DOI: 10.17521/cjpe.2007.0140
MI Na, YU Gui-Rui, WANG Pan-Xing, WEN Xue-Fa, SUN Xiao-Min, ZHANG Lei-Ming, SONG Xia, WANG Shu-Sen. MODELING SEASONAL VARIATION OF CO2 FLUX IN A SUBTROPICAL CONIFEROUS FOREST USING THE EALCO MODEL. Chinese Journal of Plant Ecology, 2007, 31(6): 1119-1131. DOI: 10.17521/cjpe.2007.0140
| 符号 Symbol | 描述 Description | 取值 Value | 单位 Unit | 来源 Source |
|---|---|---|---|---|
| φc,min | 式(3) | -200 | m H2O | Larcher, |
| φc,max | 式(3) | 0 | m H2O | Larcher, |
| m | 式(6) | 7 | Ball et al., | |
| b | 式(6) | 0.008 | mol·m-2·s-1 | Ball et al., |
| rm,F | 式(10), 叶 Leaf | 4.8×10⁻⁸ | Kg C·kg C-1·S-1 | Amthor, |
| rm,S | 式(10), 茎 Stem | 1.6×10⁻⁸ | Kg C·kg C-1·S-1 | Amthor, |
| rm,S | 式(10), 根 Root | 2.4×10⁻⁸ | Kg C·kg C-1·S-1 | Amthor, |
| A | 式(11) | 8.8(16.9*) | ||
| S | 式(11) | 710(710*) | J·K-1·mol-1 | |
| Ha | 式(11) | 36 000(57 500*) | J·mol-1 | |
| Hdh | 式(11) | 220 000(226 000*) | J·mol-1 | |
| Hdl | 式(11) | 175 000(192 000*) | J·mol-1 | |
| rg,X | 式(12) | 0.42 | Amthor, | |
| Vcmax | 最大羧化能力 Maximum catalytic activity of Rubisco | 35 | μmol·m-2·s-1 | Farquhar et al., |
| Jmax | 最大电子传递速 Potential rate of whole-chain electron transport | 87 | μmol·m-2·s-1 | Farquhar et al., |
| TreeDesi | 树的密度Density of tree | 0.199 1 | trees·m-2 | 宋霞等, |
| SLA | 比叶面积Specific leaf area | 12 | m2·kg-1 | 李轩然等, |
| ζ | 决定凋落量的系数 Coefficient | 0.000 2 | (DOY210~250) | 本研究 This study |
| 0.000 65 | (DOY250~365) | |||
| Clay | 粘土百分含量 Percent of clay | 18 | % | CERN数据 CERN tada |
| Sand | 沙土百分含量 Percent of sand | 20 | % | CERN数据 CERN tada |
| SOM | 有机物质含量 Content of soil organic matter | 3 | % | 周志田等, |
| SOILC | 土壤碳含量 Content of soil carbon | 8.76(6.80**) | Kg C·m-2 | 自运行后2003年1月1日的值 Data simulated from January 1, 2003 |
| SOILN | 土壤氮含量 Content of soil nitrogen | 0.87 | Kg N·m-2 | 自运行后2003年1月1日的值 Data simulated from January 1, 2003 |
附表A 模型中使用的参数及其取值
Appendix A Parameters in the model
| 符号 Symbol | 描述 Description | 取值 Value | 单位 Unit | 来源 Source |
|---|---|---|---|---|
| φc,min | 式(3) | -200 | m H2O | Larcher, |
| φc,max | 式(3) | 0 | m H2O | Larcher, |
| m | 式(6) | 7 | Ball et al., | |
| b | 式(6) | 0.008 | mol·m-2·s-1 | Ball et al., |
| rm,F | 式(10), 叶 Leaf | 4.8×10⁻⁸ | Kg C·kg C-1·S-1 | Amthor, |
| rm,S | 式(10), 茎 Stem | 1.6×10⁻⁸ | Kg C·kg C-1·S-1 | Amthor, |
| rm,S | 式(10), 根 Root | 2.4×10⁻⁸ | Kg C·kg C-1·S-1 | Amthor, |
| A | 式(11) | 8.8(16.9*) | ||
| S | 式(11) | 710(710*) | J·K-1·mol-1 | |
| Ha | 式(11) | 36 000(57 500*) | J·mol-1 | |
| Hdh | 式(11) | 220 000(226 000*) | J·mol-1 | |
| Hdl | 式(11) | 175 000(192 000*) | J·mol-1 | |
| rg,X | 式(12) | 0.42 | Amthor, | |
| Vcmax | 最大羧化能力 Maximum catalytic activity of Rubisco | 35 | μmol·m-2·s-1 | Farquhar et al., |
| Jmax | 最大电子传递速 Potential rate of whole-chain electron transport | 87 | μmol·m-2·s-1 | Farquhar et al., |
| TreeDesi | 树的密度Density of tree | 0.199 1 | trees·m-2 | 宋霞等, |
| SLA | 比叶面积Specific leaf area | 12 | m2·kg-1 | 李轩然等, |
| ζ | 决定凋落量的系数 Coefficient | 0.000 2 | (DOY210~250) | 本研究 This study |
| 0.000 65 | (DOY250~365) | |||
| Clay | 粘土百分含量 Percent of clay | 18 | % | CERN数据 CERN tada |
| Sand | 沙土百分含量 Percent of sand | 20 | % | CERN数据 CERN tada |
| SOM | 有机物质含量 Content of soil organic matter | 3 | % | 周志田等, |
| SOILC | 土壤碳含量 Content of soil carbon | 8.76(6.80**) | Kg C·m-2 | 自运行后2003年1月1日的值 Data simulated from January 1, 2003 |
| SOILN | 土壤氮含量 Content of soil nitrogen | 0.87 | Kg N·m-2 | 自运行后2003年1月1日的值 Data simulated from January 1, 2003 |
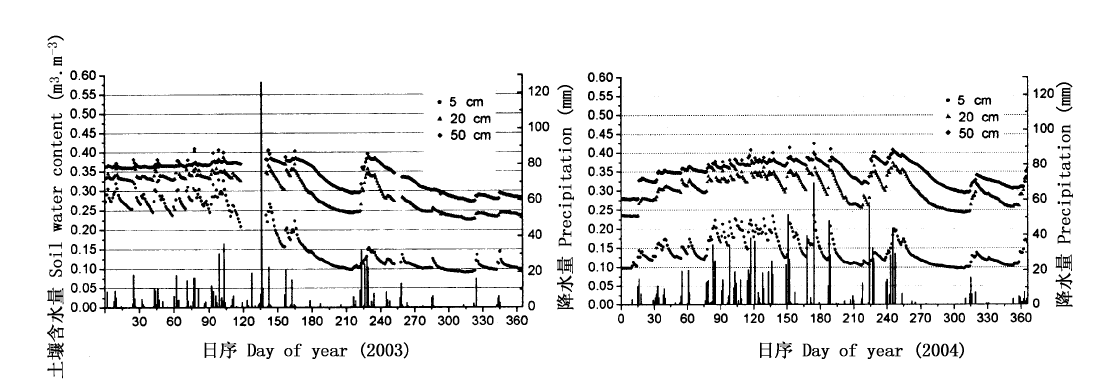
图1 千烟洲2003和2004年逐日降水(柱形图)和各层土壤水分百分含量
Fig.1 Daily precipitation and soil water content of each layer in 2003 and 2004 at Qianyanzhou site
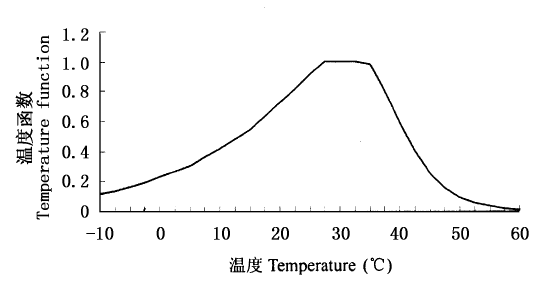
图2 温度对光合能力的影响函数
Fig.2 Temperature function effects on photosynthesis
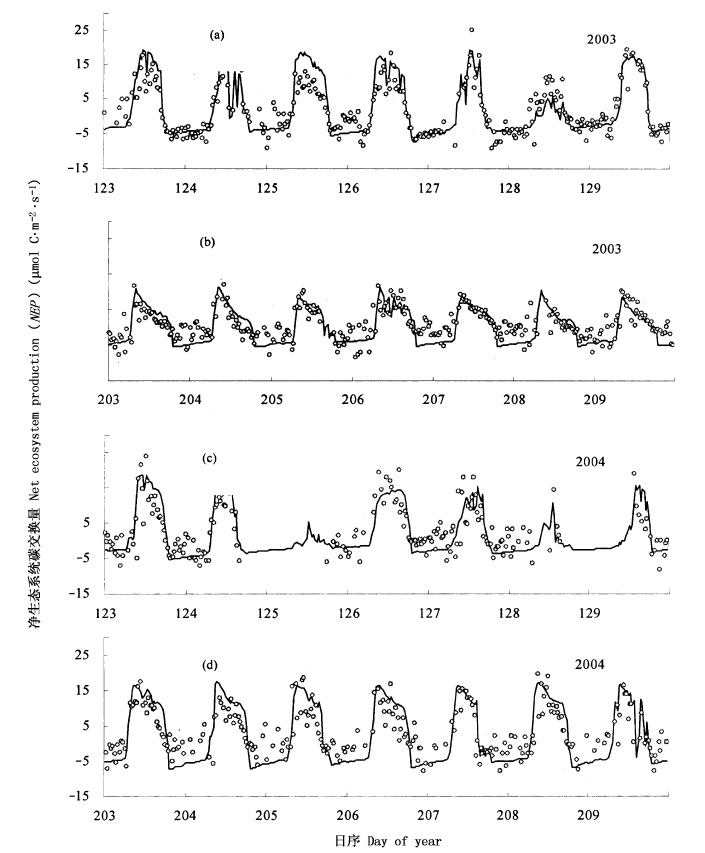
图3 2003和2004年DOY203~209 NEP的模拟值(线)与观测值(点)
Fig.3 Modeling results (line) and observation (dot) of NEP from DOY203 to DOY209 in 2003 and 2004 at Qianyanzhou site
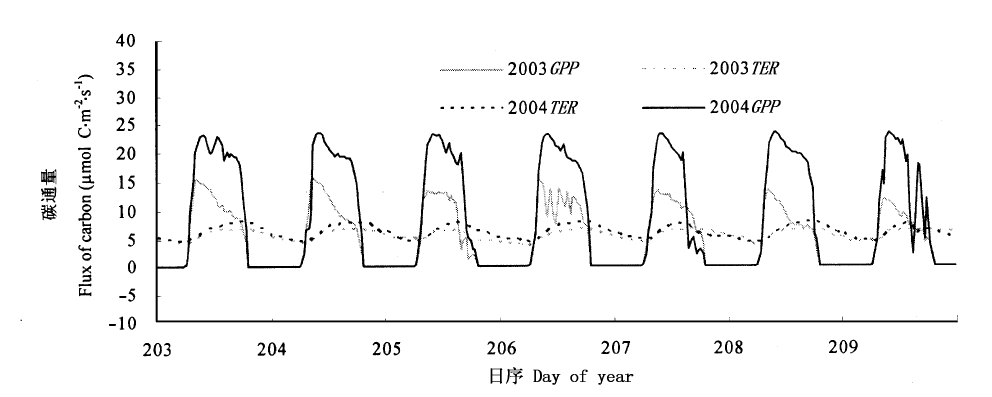
图4 2003和2004年DOY203~209的GPP和TER模拟值 GPP: 总初级生产力 Gross primary production TER: 总生态系统呼吸 Total ecosystem respiration
Fig.4 Modeling results of GPP and TER from DOY203 to DOY209 in 2003 and 2004 at Qianyanzhou site
| 变量 Item | 年 Year | 斜率 Slope | 截距 Intercept | R2 | 标准差 Standard deviation | 记录数 Observations | |||||||
|---|---|---|---|---|---|---|---|---|---|---|---|---|---|
| 净CO2交换量 | 2003 | 0.91 | -0.34 | 0.68 | 3.66 | 12 849 | |||||||
| Net CO2 flux (NEP) | 2004 | 0.91 | -0.02 | 0.67 | 4.17 | 13 141 | |||||||
| 2003~2004 | 0.91 | -0.18 | 0.68 | 3.93 | 25 990 | ||||||||
表1 半小时尺度CO2通量(NEP) (μmol C·m-2·s-1)观测值(x)与模拟值(y)的回归统计
Table 1 Statistics from the regression of simulated (as y) on observed (as x) half-hourly net ecosystem CO2 fluxes (μmol C·m-2·s-1)
| 变量 Item | 年 Year | 斜率 Slope | 截距 Intercept | R2 | 标准差 Standard deviation | 记录数 Observations | |||||||
|---|---|---|---|---|---|---|---|---|---|---|---|---|---|
| 净CO2交换量 | 2003 | 0.91 | -0.34 | 0.68 | 3.66 | 12 849 | |||||||
| Net CO2 flux (NEP) | 2004 | 0.91 | -0.02 | 0.67 | 4.17 | 13 141 | |||||||
| 2003~2004 | 0.91 | -0.18 | 0.68 | 3.93 | 25 990 | ||||||||
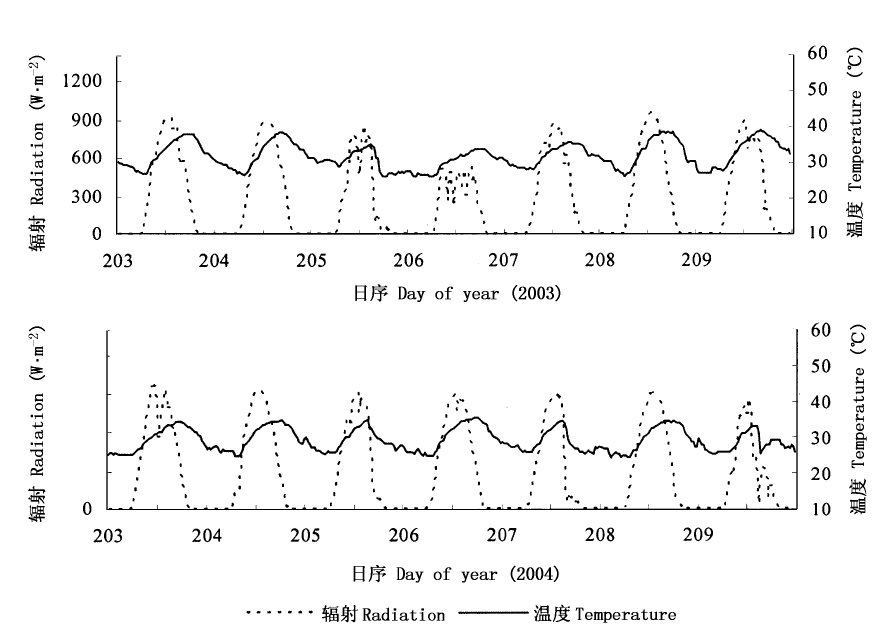
图5 2003与2004年辐射与温度状况(DOY203~209)
Fig.5 Radiation and temperature conditions from DOY203 to DOY209 in 2003 and 2004 at Qianyanzhou site
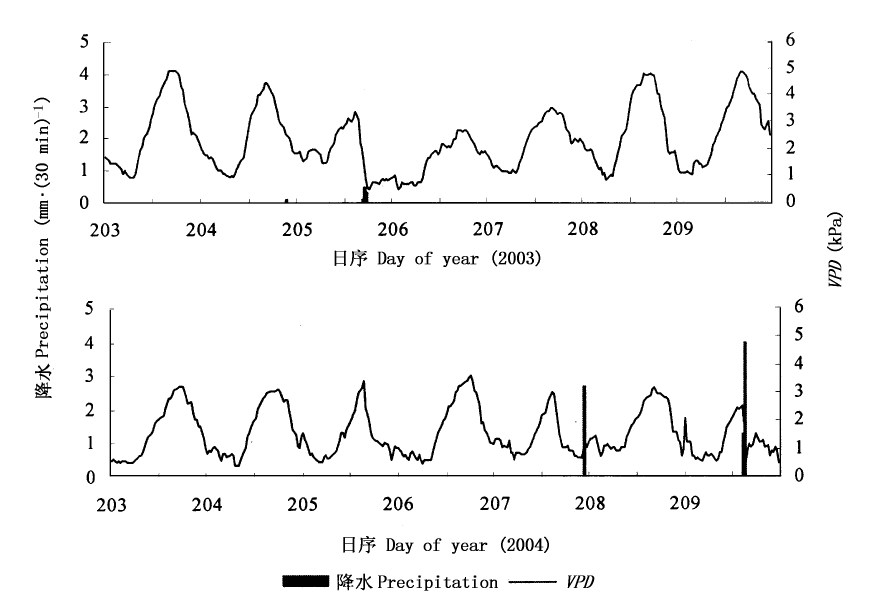
图6 2003与2004年降水与空气饱和水汽压差(VPD)状况(DOY203~209)
Fig.6 Precipitation and vapor pressure deficit (VPD) conditions from DOY203 to DOY209 in 2003 and 2004 at Qianyanzhou site
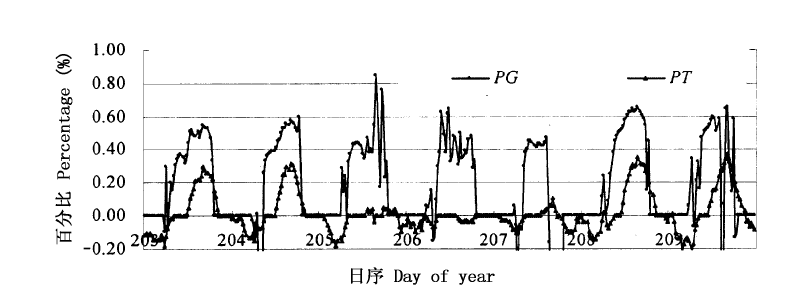
图7 光合能力下降的百分数(圆点)与冠层温度影响所占的百分数(三角点), Tc代表模型模拟的冠层温度,PG和PT的含义见式(17)和(18)
Fig.7 Decline percent of photosynthesis capacity in 2003 compared to the same time in 2004 and influence percent of temperature on canopy photosynthesis. Tc represents the simulated canopy temperature. The calculation equation of PG and PT refer to equation (17) and (18)
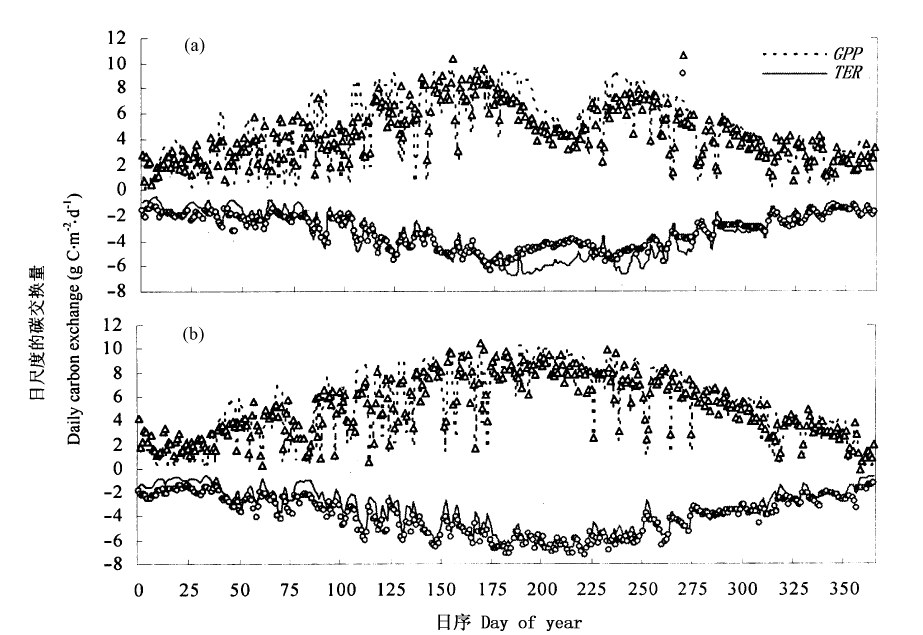
图8 2003~2004年日总初级生产力(GPP)与总生态系统呼吸(TER)的模拟值(线)与“实测值"(点) 年观测值(x)与模拟值(y)的回归统计结果 Regression results between observation data (x) and modeling results (y) GPP: y=1.18x-0.76, R2=0.76 (2003);y=1.15x-0.81, R2=0.88 (2004) TER: y=1.25x-0.84, R2=0.82 (2003);y=1.05x-0.78, R2=0.94 (2004) GPP、TER: See Fig. 4
Fig.8 Modeling results (line) and observations (dot) of daily GPP and TER in 2003 and 2004 at Qianyanzhou site
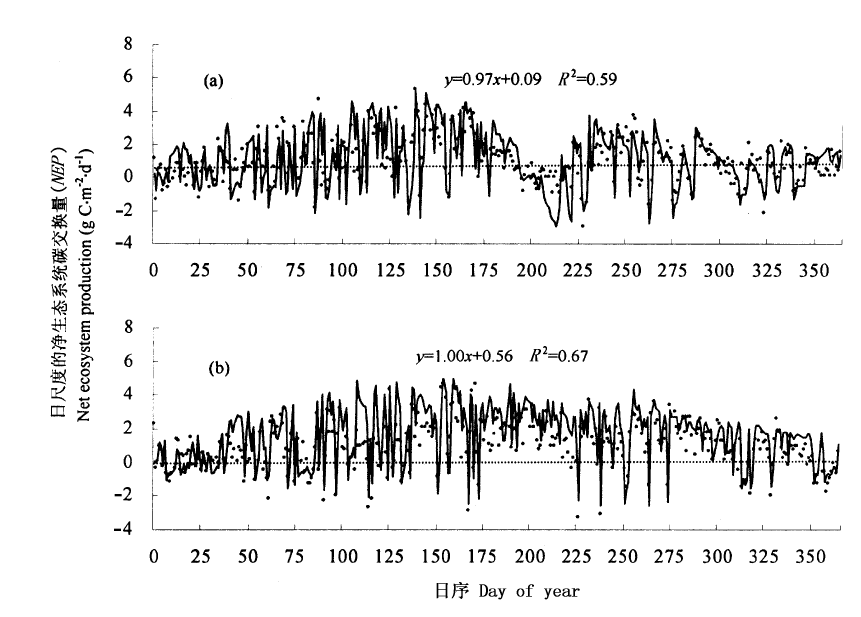
图9 2003~2004年日净CO2交换量(NEP)的模拟值(线)与“实测值"(点) NEP: 见表2 See Table 2
Fig.9 Modeling results (line) and observations (dot) of daily NEP in 2003 and 2004 at Qianyanzhou site
| 变量 Variable | 2003 | 2004 | ||
|---|---|---|---|---|
| 模拟值 Simulation | 估算值 Estimated1) | 模拟值 Simulation | 估算值 Estimated1) | |
| GPP | 1 637.5 | 1 610.4 | 1 844.1 | 1 865.8 |
| NPP | 546.8 | - | 728.9 | - |
| NEP | 404.4 | 387.2 | 582.1 | 423.8 |
| Rabove | -765.8 | - | -768.3 | - |
| Rsoil | -467.3 | - | -493.7 | -536.5 |
| TER | -1 233.1 | -1 223.3 | -1 262.0 | -1 442.0 |
表2 碳循环组分模拟值与基于观测的估算值的比较
Table 2 Simulated annual carbon balance components vs. some observation-based estimations at Qianyanzhou site (g C·m-2·a-1)
| 变量 Variable | 2003 | 2004 | ||
|---|---|---|---|---|
| 模拟值 Simulation | 估算值 Estimated1) | 模拟值 Simulation | 估算值 Estimated1) | |
| GPP | 1 637.5 | 1 610.4 | 1 844.1 | 1 865.8 |
| NPP | 546.8 | - | 728.9 | - |
| NEP | 404.4 | 387.2 | 582.1 | 423.8 |
| Rabove | -765.8 | - | -768.3 | - |
| Rsoil | -467.3 | - | -493.7 | -536.5 |
| TER | -1 233.1 | -1 223.3 | -1 262.0 | -1 442.0 |
| [1] | Abdella K, McFarlane NA (1996). Parameterization of the surface-layer exchange coefficients for atmospheric models. Boundary-Layer Meteorology, 80,223-248. |
| [2] | Amthor JS (1989). Respiration and Crop Productivity. Springer Verlag , New York. |
| [3] | Amthor JS, Chen JM, Clein JS, Frolking SE, Goulden ML, Grant RF, Kimball JS, King AW, Mcguire AD, Nikolov NT, Potter CS, Wang SS, Wofsy SC (2001). Boreal forest CO 2 exchange and evapotranspiration predicted by nine ecosystem process model: intermodel comparisons and relationships to field experiments. Journal of Geography Research—Atmosphere, 106,33623-33648. |
| [4] | Ball JT, Woodrow IE, Berry JA (1987). A model predicting stomatal conductance and its contribution to the control of photosynthesis under different environmental conditions. In: Biggens Jed. Progress in Photosynthesis Research. Vol. 4. Martinus-Nijhoff, Dordrecht,221-224. |
| [5] | Cao M, Woodward FI (1998). Dynamic responses of terrestrial ecosystem carbon cycling to global climate change. Nature, 393,249-252. |
| [6] | Chen YR (陈永瑞) (2000). Nutrient element dynamic analysis of withered leaves from artificial forest of masson pine on the experimental plot in Qiangyanzhou. Jiangxi Science (江西科学), 18,19-24. (in Chinese with English abstract) |
| [7] | Cox P, Friedlingstein P, Rayner P (2002). Modeling climate carbon cycle feedbacks: a cross disciplinary collaboration priority. IGBP Global Change Newsletter, 49,12-14. |
| [8] | Falge E, Baldocchi D, Olson R (2001). Gap filling strategies for defensible annual suns of net ecosystem exchange. Agriculture and Forest Meteorology, 107,43-69. |
| [9] |
Farquhar GD, Von Caemmerer S, Berry JA (1980). Abiochemical model of photosynthetic CO 2 assimilation in leaves of C3 species. Planta, 149,78-90.
DOI URL PMID |
| [10] | Grant RF (2001), A review of the Canadian ecosystem model ecosys. In: Shaffer MJ, Ma L, Hansen Seds. Modeling Carbon and Nitrogen Dynamics for Soil Management. CRC Press, Boca Raton,173-263. |
| [11] | Grant RF, Arain A, Arora V, Barr A, Black TA, Chen J, Wang S, Yuan F, Zhang Y (2005). Intercomparison of technique to model high temperature effects on CO 2 and energy exchange in temperate and boreal coniferous forests. Ecological Modelling, 188,217-252. |
| [12] | Hanson PJ, Weltzin JF (2000). Drought disturbances from climate change: response of United States forests. Science of the Total Environment, 262,205-220. |
| [13] | Huang DY (黄道友), Wang KL (王克林), Huang M (黄敏), Chen HS (陈洪松), Wu JS (吴金水), Zhang GP (张广平), Peng TB (彭廷柏) (2004). Seasonal drought problems in the red soil hilly region of the middle subtropical zone of China. Acta Ecologica Sinica (生态学报), 24,2516-2523. (in Chinese with English abstract) |
| [14] | Ito A, Olikawa T (2002). A simulation model of the carbon cycle in land ecosystems (Sim-CYCLE): a description based on dry matter production theory and plot-scale validation. Ecological Modelling, 151,143-176. |
| [15] | Kimmins JP (1997). Forest Ecology: a Foundation for Sustainable Management 2nd edn. Prentice Hall, New Jersey. |
| [16] | Larcher W (1995). Physiological Plant Ecology 3rd edn. Springer, Austria. |
| [17] | Li XR (李轩然), Liu QJ (刘琪王景), Cai Z (蔡哲), Ma ZQ (马泽清) (2007). Specific leaf area and leaf area index of conifer plantation in Qianyanzhou station of subtropical China. Journal of Plant Ecology (Chinese Version)(植物生态学报), 31,93-101. (in Chinese with English abstract) |
| [18] | Liu RF, Song X, Yu GR, Sun XM, Wen XF, Chen YR (2004). Seasonal variation of CO 2 flux and its environmental factors in evergreen coniferous plantation. Science in China Series D, 48(Suppl. Ⅰ),123-133. |
| [19] | Liu RF, Yu GR, Wen XF, Wang YH, Song X, Li J, Sun XM, Yang FT, Chen YR, Liu QJ (2006). Seasonal dynamics of CO 2 fluxes from sub-tropical plantation coniferous ecosystem. Science in China Series D, 49(Suppl.Ⅱ),99-109. |
| [20] | Ma L, Shaffer MJ (2001). A review of carbon and nitrogen processes in nine US soil nitrogen dynamic models. In: Shaffer MJ, Ma L, Hansen Seds. Modeling Carbon and Nitrogen Dynamics for Soil Management. CRC Press, Boca Raton,55-102. |
| [21] | McGechan MB, Wu L (2001). A review of carbon and nitrogen processes in European soil nitrogen dynamic models. In: Shaffer MJ, Ma L, Hansen Seds. Modeling Carbon and Nitrogen Dynamics for Soil Management. CRC Press, Boca Raton,103-172. |
| [22] | Peng C, Jiang H, Apps MJ, Zhang Y (2002). Effects of harvesting regimes on carbon and nitrogen dynamics of boreal forests in central Canada: a process model simulation. Ecological Modelling, 155,177-189. |
| [23] | Riedo M, Gyalistras D, Fuhrer J (2000). Net primary production and carbon stocks in differently managed grasslands: simulation of site-specific sensitivity to an increase in atmospheric CO 2 and to climate change. Ecological Modeling, 134,207-227. |
| [24] |
Sharpe PSH, DeMichelle DW (1977). Reaction kinetics of poikilothermic development. Journal of Theoretical Biology, 64,649-670.
DOI URL PMID |
| [25] | Song X (宋霞), Liu RF (刘允芬), Xu XF (徐晓锋), Yu GR (于贵瑞), Wen XF (温学发) (2004). Comparison study on carbon dioxide, water and heat fluxes of the forest ecosystem in red earth hilly zone over winter and spring. Resources Science (资源科学), 26(3),96-104. (in Chinese with English abstract) |
| [26] | Verseghy DL, McFarlane NA, Lazare M (1993). CLASS—a Canadian land surface scheme for GCMs. Ⅱ. Vegetation model and coupled runs. International Journal of Climatology, 13,347-370. |
| [27] | Wang S, Davidson A (2007). Impact of climate variations on surface albedo of a temperate grassland. Agricultural and Forest Meteorology, 142,133-142. |
| [28] | Wang S, Grant R, Verseghy DL, Black TA (2001). Modeling plant carbon and nitrogen dynamics of a boreal aspen forest in CLASS—the Canadian Land Surface Scheme. Ecological Modeling, 142,135-155. |
| [29] | Wang S, Grant R, Verseghy DL, Black TA (2002a). Modeling carbon-coupled energy and water dynamics of a boreal aspen forest in a general circulation model land surface scheme. International Journal of Climatology, 22,1249-1265. |
| [30] | Wang S, Grant R, Verseghy DL, Black TA (2002b). Modeling carbon dynamics of boreal forest ecosystems using the Canadian Land Surface Scheme. Climate Change, 55,451-477. |
| [31] | Wang S, Trishchenko A, Khlopenkov K, Davidson A (2006). Comparison of IPCC AR4 climate model simulations of surface albedo with satellite products over northern latitudes. Journal of Geography Research—Atmosphere, 111,D21108, doi: 10.1029/2005JD006728. |
| [32] | Zhang LM, Yu GR, Sun XM, Wen XF, Ren CY, Song X, Liu YF, Guan DX, Yan JH, Zhang YP (2006). Seasonal variation of carbon exchange of typical forest ecosystems along the eastern forest transect in China. Science in China Series D, 49 (Suppl.Ⅱ),47-62. |
| [33] | Zhou ZT (周志田), Chen SK (成升魁), Liu RF (刘允芬), Li JY (李家永) (2002). CO 2 emission of soil under different land-use types in subtropical red soil hilly areas in China: preliminary exploration. Resources Science (资源科学), 24(2),83-88. (in Chinese with English abstract) |
| [1] | 王嘉童, 牛春跃, 胡天宇, 李文楷, 刘玲莉, 郭庆华, 苏艳军. 三维辐射传输模型在森林生态系统研究中的应用与展望[J]. 植物生态学报, 2022, 46(10): 1200-1218. |
| [2] | 郑甲佳, 黄松宇, 贾昕, 田赟, 牟钰, 刘鹏, 查天山. 中国森林生态系统土壤呼吸温度敏感性空间变异特征及影响因素[J]. 植物生态学报, 2020, 44(6): 687-698. |
| [3] | 陈世苹, 游翠海, 胡中民, 陈智, 张雷明, 王秋凤. 涡度相关技术及其在陆地生态系统通量研究中的应用[J]. 植物生态学报, 2020, 44(4): 291-304. |
| [4] | 汤显辉, 陈永乐, 李芳, 宋欣. 水同位素分析与生态系统过程示踪: 技术、应用以及未来挑战[J]. 植物生态学报, 2020, 44(4): 350-359. |
| [5] | 李永强, 董智, 丁晨曦, 王雅楣, 贾继文, 张佳楠, 焦树英. 山东省暖性草丛生态系统碳库现状和碳通量季节变化特征[J]. 植物生态学报, 2018, 42(3): 277-287. |
| [6] | 谭丽萍, 刘苏峡, 莫兴国, 杨丽虎, 林忠辉. 华北人工林水热碳通量环境影响因子分析[J]. 植物生态学报, 2015, 39(8): 773-784. |
| [7] | 王义东, 王辉民, 马泽清, 李庆康, 施蕾蕾, 徐飞. 土壤呼吸对降雨响应的研究进展[J]. 植物生态学报, 2010, 34(5): 601-610. |
| [8] | 顾峰雪, 于贵瑞, 温学发, 陶波, 李克让, 刘允芬. 干旱对亚热带人工针叶林碳交换的影响[J]. 植物生态学报, 2008, 32(5): 1041-1051. |
| [9] | 常瑞英, 唐海萍. 草原固碳量估算方法及其敏感性分析[J]. 植物生态学报, 2008, 32(4): 810-814. |
| [10] | 王文杰, 祖元刚, 王辉民, 杨逢建, 三枝信子, 小池孝良, 山本晋. 基于涡度协方差法和生理生态法对落叶松林CO2通量的初步研究[J]. 植物生态学报, 2007, 31(1): 118-128. |
| 阅读次数 | ||||||
|
全文 |
|
|||||
|
摘要 |
|
|||||
Copyright © 2026 版权所有 《植物生态学报》编辑部
地址: 北京香山南辛村20号, 邮编: 100093
Tel.: 010-62836134, 62836138; Fax: 010-82599431; E-mail: apes@ibcas.ac.cn, cjpe@ibcas.ac.cn
备案号: 京ICP备16067583号-19
![]()