
植物生态学报 ›› 2015, Vol. 39 ›› Issue (4): 309-321.DOI: 10.17521/cjpe.2015.0030 cstr: 32100.14.cjpe.2015.0030
所属专题: 生态遥感及应用
• • 下一篇
徐婷, 曹林, 申鑫, 佘光辉*( )
)
收稿日期:2014-10-11
接受日期:2015-02-15
出版日期:2015-04-01
发布日期:2015-04-21
作者简介:# 共同第一作者
基金资助:
XU Ting, CAO Lin, SHEN Xin, SHE Guang-Hui*()
Received:2014-10-11
Accepted:2015-02-15
Online:2015-04-01
Published:2015-04-21
About author:# Co-first authors
摘要:
快速、定量、精确地估算区域森林生物量一直是森林生态功能评价以及碳储量研究的重要问题。该研究基于机载激光雷达(LiDAR)点云与Landsat 8 OLI多光谱数据, 借助江苏省常熟市虞山地区55块调查样地数据, 首先提取并分析了87个特征变量(53个OLI特征变量, 34个LiDAR特征变量)与森林地上、地下生物量的Pearson’s相关系数以进行变量优选, 然后利用多元逐步回归法建立森林生物量估算模型(OLI生物量估算模型和LiDAR生物量估算模型), 并与基于两种数据建立的综合生物量估算模型的结果进行比较, 讨论预测结果及其精确性。结果表明: 3种模型(OLI模型、LiDAR模型和综合模型)在所有样地无区分分析时, 地上和地下生物量的估算精度均达到0.4以上, 基于不同森林类型(针叶林、阔叶林、混交林)分析时地上和地下生物量的估算精度均有明显提高, 达到0.67及以上。利用分森林类型模型估算生物量, 综合生物量估算模型精度(地上生物量: R2为0.88; 地下生物量: R2为0.92)优于OLI生物量估算模型(地上生物量: R2为0.73; 地下生物量: R2为0.81)和LiDAR生物量估算模型(地上生物量: R2为0.86; 地下生物量: R2为0.83)。
徐婷, 曹林, 申鑫, 佘光辉. 基于机载激光雷达与Landsat 8 OLI数据的亚热带森林生物量估算. 植物生态学报, 2015, 39(4): 309-321. DOI: 10.17521/cjpe.2015.0030
XU Ting,CAO Lin,SHEN Xin,SHE Guang-Hui. Estimates of subtropical forest biomass based on airborne LiDAR and Landsat 8 OLI data. Chinese Journal of Plant Ecology, 2015, 39(4): 309-321. DOI: 10.17521/cjpe.2015.0030
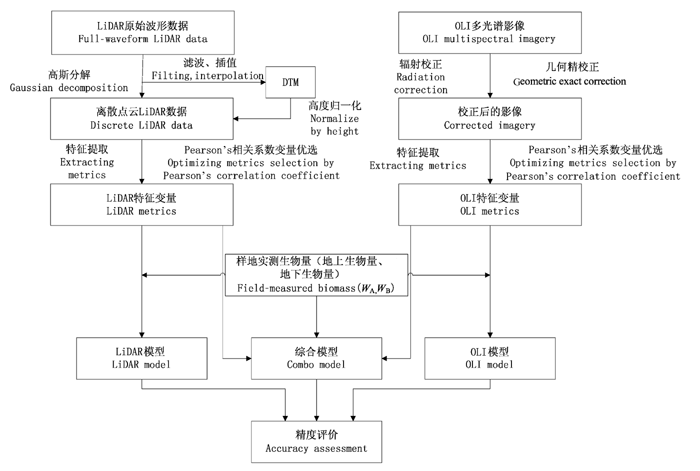
图1 基于小光斑离散点云LiDAR和OLI多光谱数据估算森林生物量技术路线图。
Fig. 1 Methodological flowchart for estimating forest biomass using small-footprint discrete-return LiDAR data and OLI multispectral data. DTM, digital terrain model; WA, above-ground biomass; WB, below-ground biomass.
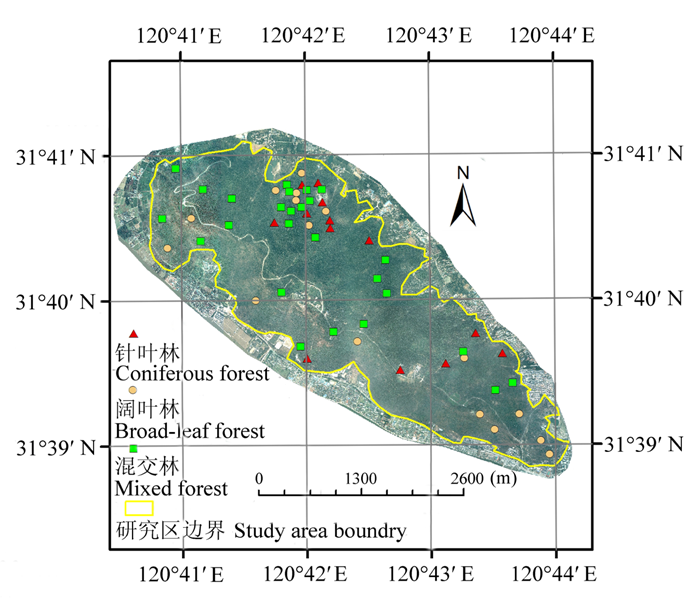
图2 研究区真彩色航空像片及55块样地分布图。
Fig. 2 Aerial photo of the study site and distribution of 55 sampling plots.
| 森林参数 Forest metrics | 针叶林 Coniferous forest (n = 13) | 阔叶林 Broad-leaf forest (n = 16) | 混交林 Mixed forest (n = 26) | ||||||
|---|---|---|---|---|---|---|---|---|---|
| 数值范围 Range | 平均值 Mean | 标准偏差 SD | 数值范围 Range | 平均值 Mean | 标准偏差 SD | 数值范围 Range | 平均值 Mean | 标准偏差 SD | |
| 地上生物量 WA (t·hm-2) | 47.66-102.76 | 76.52 | 18.44 | 32.03-151.45 | 91.02 | 31.74 | 49.65-192.22 | 87.28 | 28.22 |
| 地下生物量 WB (t·hm-2) | 14.42-32.59 | 22.81 | 5.34 | 10.31-37.39 | 26.27 | 6.08 | 15.69-61.89 | 25.82 | 8.41 |
表1 地面调查样地信息汇总
Table 1 Summary of the forests from field sampling plots
| 森林参数 Forest metrics | 针叶林 Coniferous forest (n = 13) | 阔叶林 Broad-leaf forest (n = 16) | 混交林 Mixed forest (n = 26) | ||||||
|---|---|---|---|---|---|---|---|---|---|
| 数值范围 Range | 平均值 Mean | 标准偏差 SD | 数值范围 Range | 平均值 Mean | 标准偏差 SD | 数值范围 Range | 平均值 Mean | 标准偏差 SD | |
| 地上生物量 WA (t·hm-2) | 47.66-102.76 | 76.52 | 18.44 | 32.03-151.45 | 91.02 | 31.74 | 49.65-192.22 | 87.28 | 28.22 |
| 地下生物量 WB (t·hm-2) | 14.42-32.59 | 22.81 | 5.34 | 10.31-37.39 | 26.27 | 6.08 | 15.69-61.89 | 25.82 | 8.41 |
| 特征变量 Metrics | 变量描述 Description |
|---|---|
| 原始单波段 Initial bands | |
| B2-B7 | OLI第2-7波段(经过大气校正和几何精校正) Second to seventh band from OLI (after atmospheric correction and geometric exact correction) |
| 波段组合 Band combination | |
| Albedo | Albedo = B2 + B3 + B4 + B5 + B6 + B7 |
| B4/Albedo | B4/Albedo = B4 / (B2 + B3 + B4 + B5 + B6 + B7) |
| B24 | B24 = B2 / B4 |
| B74 | B74 = B7 / B4 |
| B76 | B76 = B7 / B6 |
| B547 | B547 = B5 · B4 / B7 |
| B65 | B65 = B6 / B5 |
| B345 | B345 = B3 · B4 / B5 |
| B53 | B53 = B5 / B3 |
| VIS234 | VIS234 = B2 + B3 + B4 |
| 信息增强组 Information enhance | |
| 绿度 Greenness (TCG) | 提取缨帽变换绿度波段 Extract greenness from tasseled cap transform |
| 亮度 Brightness (TCB) | 提取缨帽变换亮度波段 Extract brightness from tasseled cap transform |
| 湿度 Wetness (TCW) | 提取缨帽变换湿度波段 Extract wetness from tasseled cap transform |
| 第一主成分 First principal component (PC1) | 提取主成分分析第一波段 Extract first band from principal component analysis |
| 第二主成分 Second principal component (PC2) | 提取主成分分析第二波段 Extract second band from principal component analysis |
| 第三主成分 Third principal component (PC3) | 提取主成分分析第三波段 Extract third band from principal component analysis |
| 最小噪声分离变换第一波段 First band of minimum noise fraction rotation (MNF1) | 提取MNF变换第一波段 Extract first band from minimum noise fraction rotation |
| 最小噪声分离变换第二波段 Second band of minimum noise fraction rotation (MNF2) | 提取MNF变换第二波段 Extract second band from minimum noise fraction rotation |
| 最小噪声分离变换第三波段 Third band of minimum noise fraction rotation (MNF3) | 提取MNF变换第三波段 Extract third band from minimum noise fraction rotation |
| 最小噪声分离变换第四波段 Forth band of minimum noise fraction rotation (MNF4) | 提取MNF变换第四波段 Extract forth band from minimum noise fraction rotation |
| 植被指数 Vegetation index | |
| 增强型植被指数 Enhanced vegetation index (EVI) |  |
| 归一化植被指数 Normalized difference vegetation index (NDVI) |  |
| 土壤调整植被指数 Soil-adjusted vegetation index (SAVI) |  |
| 有效叶面积指数 Specific leaf area vegetation index (SLAVI) |  |
| 简单比值植被指数 Ratio vegetation index (RVI) |  |
| 中红外植被指数 Mid-infrared vegetation index (VI3) |  |
| 垂直植被指数 Perpendicular vegetation index (PVI) |  |
| 土壤调整比值植被指 Soil-adjusted ratio vegetation index (SARVI) |  |
| 差值植被指数 Difference vegetation index (DVI) |  |
| 转换型植被指数 Transformed normalized difference vegetation index (TNDVI) |  |
| 大气阻抗植被指数 Atmospherically resistant vegetation index (ARVI) |  |
| 修正型土壤调整植被指数 Modified soil-adjusted vegetation index (MSAVI) |  |
| 修正型简单比值植被指数 Modified simple ratio vegetation index (MSR) |  |
| 非线性指数 Nonlinear index (NLI) |  |
| 重归一化植被指数 Renormalized difference vegetation index (RDVI) |  |
| 归一化植被指数 Normalized difference vegetation index (ND43) |  |
| 归一化植被指数 Normalized difference vegetation index (ND67) |  |
| 归一化植被指数 Normalized difference vegetation index (ND563) |  |
| 纹理信息 Texture information | |
| 相关度 Correlation (CR) |  |
| 对比度 Contrast (CO) |  |
| 相异性 Dissimilarity (DI) |  |
| 信息熵 Entropy (EN) |  |
| 均匀度 Homogeneity (HO) |  |
| 均值 Mean (ME) |  |
| 二阶矩 Second moment (SM) |  |
| 偏斜度 Skewness (SK) |  |
| 方差 Variance (VA) |  |
附录1 OLI特征变量汇总
Appendix 1 Summary of metrics computed from OLI multispectral data
| 特征变量 Metrics | 变量描述 Description |
|---|---|
| 原始单波段 Initial bands | |
| B2-B7 | OLI第2-7波段(经过大气校正和几何精校正) Second to seventh band from OLI (after atmospheric correction and geometric exact correction) |
| 波段组合 Band combination | |
| Albedo | Albedo = B2 + B3 + B4 + B5 + B6 + B7 |
| B4/Albedo | B4/Albedo = B4 / (B2 + B3 + B4 + B5 + B6 + B7) |
| B24 | B24 = B2 / B4 |
| B74 | B74 = B7 / B4 |
| B76 | B76 = B7 / B6 |
| B547 | B547 = B5 · B4 / B7 |
| B65 | B65 = B6 / B5 |
| B345 | B345 = B3 · B4 / B5 |
| B53 | B53 = B5 / B3 |
| VIS234 | VIS234 = B2 + B3 + B4 |
| 信息增强组 Information enhance | |
| 绿度 Greenness (TCG) | 提取缨帽变换绿度波段 Extract greenness from tasseled cap transform |
| 亮度 Brightness (TCB) | 提取缨帽变换亮度波段 Extract brightness from tasseled cap transform |
| 湿度 Wetness (TCW) | 提取缨帽变换湿度波段 Extract wetness from tasseled cap transform |
| 第一主成分 First principal component (PC1) | 提取主成分分析第一波段 Extract first band from principal component analysis |
| 第二主成分 Second principal component (PC2) | 提取主成分分析第二波段 Extract second band from principal component analysis |
| 第三主成分 Third principal component (PC3) | 提取主成分分析第三波段 Extract third band from principal component analysis |
| 最小噪声分离变换第一波段 First band of minimum noise fraction rotation (MNF1) | 提取MNF变换第一波段 Extract first band from minimum noise fraction rotation |
| 最小噪声分离变换第二波段 Second band of minimum noise fraction rotation (MNF2) | 提取MNF变换第二波段 Extract second band from minimum noise fraction rotation |
| 最小噪声分离变换第三波段 Third band of minimum noise fraction rotation (MNF3) | 提取MNF变换第三波段 Extract third band from minimum noise fraction rotation |
| 最小噪声分离变换第四波段 Forth band of minimum noise fraction rotation (MNF4) | 提取MNF变换第四波段 Extract forth band from minimum noise fraction rotation |
| 植被指数 Vegetation index | |
| 增强型植被指数 Enhanced vegetation index (EVI) | |
| 归一化植被指数 Normalized difference vegetation index (NDVI) | |
| 土壤调整植被指数 Soil-adjusted vegetation index (SAVI) | |
| 有效叶面积指数 Specific leaf area vegetation index (SLAVI) | |
| 简单比值植被指数 Ratio vegetation index (RVI) | |
| 中红外植被指数 Mid-infrared vegetation index (VI3) | |
| 垂直植被指数 Perpendicular vegetation index (PVI) | |
| 土壤调整比值植被指 Soil-adjusted ratio vegetation index (SARVI) | |
| 差值植被指数 Difference vegetation index (DVI) | |
| 转换型植被指数 Transformed normalized difference vegetation index (TNDVI) | |
| 大气阻抗植被指数 Atmospherically resistant vegetation index (ARVI) | |
| 修正型土壤调整植被指数 Modified soil-adjusted vegetation index (MSAVI) | |
| 修正型简单比值植被指数 Modified simple ratio vegetation index (MSR) | |
| 非线性指数 Nonlinear index (NLI) | |
| 重归一化植被指数 Renormalized difference vegetation index (RDVI) | |
| 归一化植被指数 Normalized difference vegetation index (ND43) | |
| 归一化植被指数 Normalized difference vegetation index (ND67) | |
| 归一化植被指数 Normalized difference vegetation index (ND563) | |
| 纹理信息 Texture information | |
| 相关度 Correlation (CR) | |
| 对比度 Contrast (CO) | |
| 相异性 Dissimilarity (DI) | |
| 信息熵 Entropy (EN) | |
| 均匀度 Homogeneity (HO) | |
| 均值 Mean (ME) | |
| 二阶矩 Second moment (SM) | |
| 偏斜度 Skewness (SK) | |
| 方差 Variance (VA) | |
| 特征变量 Metrics | 变量描述 Description |
|---|---|
| 高度百分位数 Percentile height | |
| h10, h20, h25, h30, h40, h50, h60, h70, h75, h80, h90, h95, h99 | 第一回波返回点的冠层高度分布百分位数(10th, 20th, 25th, 30th, 40th, 50th, 60th, 70th, 75th, 80th, 90th, 95th, 99th) The percentiles of the canopy height distributions (10th, 20th,…99th) of first returns |
| 高度变量 Height metrics | |
| hmin | 激光雷达树高的最小值 Minimum height above ground of all first returns |
| hskew | 激光雷达树高的偏斜度 Skewness of heights of all first returns |
| hkur | 激光雷达树高的峰度 Kurtosis of heights of all first returns |
| hiq | 激光雷达树高的75%和25%分位数的差值 Difference between 75% and 25% of canopy height of first returns |
| hmean | 激光雷达树高的平均值 Mean height above ground of all first returns |
| hmax | 激光雷达树高的最大值 Maximum height above ground of all first returns |
| hcv | 激光雷达树高的高度变异系数 Coefficient of variation of heights of all first returns |
| hmode | 激光雷达树高的众数 Mode of heights of all first returns |
| hvar | 激光雷达树高的方差 Variance of heights of all first returns |
| hstd | 激光雷达树高的标准差 Standard deviation of heights of all first returns |
| 冠层密度 Canopy density | |
| d0, d1, d2, d3, d4, d5, d6, d7, d8, d9 | 高于一定范围相对高度的冠层返回密度, 即第一回波中高于(0、10、20、…90)分位数的点占第一回波所有点的百分比(0-100%) The canopy return density over a range of relative heights, i.e., percentage (0%-100%) of first returns above the quantiles (0, 10, 20…90) to total number of first returns |
| 覆盖度 Cover | |
| c | 取高于2 m的冠层返回点在所有激光返回点中所占的比例 Percentages of first returns above 2 m |
附录2 LiDAR特征变量汇总
Appendix 2 Summary of metrics computed from LiDAR
| 特征变量 Metrics | 变量描述 Description |
|---|---|
| 高度百分位数 Percentile height | |
| h10, h20, h25, h30, h40, h50, h60, h70, h75, h80, h90, h95, h99 | 第一回波返回点的冠层高度分布百分位数(10th, 20th, 25th, 30th, 40th, 50th, 60th, 70th, 75th, 80th, 90th, 95th, 99th) The percentiles of the canopy height distributions (10th, 20th,…99th) of first returns |
| 高度变量 Height metrics | |
| hmin | 激光雷达树高的最小值 Minimum height above ground of all first returns |
| hskew | 激光雷达树高的偏斜度 Skewness of heights of all first returns |
| hkur | 激光雷达树高的峰度 Kurtosis of heights of all first returns |
| hiq | 激光雷达树高的75%和25%分位数的差值 Difference between 75% and 25% of canopy height of first returns |
| hmean | 激光雷达树高的平均值 Mean height above ground of all first returns |
| hmax | 激光雷达树高的最大值 Maximum height above ground of all first returns |
| hcv | 激光雷达树高的高度变异系数 Coefficient of variation of heights of all first returns |
| hmode | 激光雷达树高的众数 Mode of heights of all first returns |
| hvar | 激光雷达树高的方差 Variance of heights of all first returns |
| hstd | 激光雷达树高的标准差 Standard deviation of heights of all first returns |
| 冠层密度 Canopy density | |
| d0, d1, d2, d3, d4, d5, d6, d7, d8, d9 | 高于一定范围相对高度的冠层返回密度, 即第一回波中高于(0、10、20、…90)分位数的点占第一回波所有点的百分比(0-100%) The canopy return density over a range of relative heights, i.e., percentage (0%-100%) of first returns above the quantiles (0, 10, 20…90) to total number of first returns |
| 覆盖度 Cover | |
| c | 取高于2 m的冠层返回点在所有激光返回点中所占的比例 Percentages of first returns above 2 m |
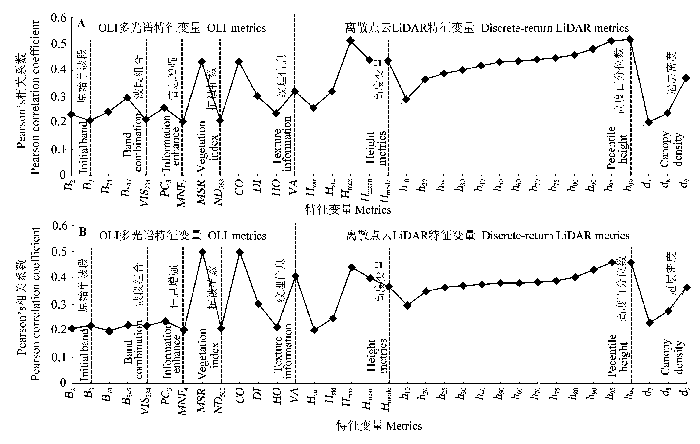
图3 特征变量与样地地上生物量(A)和地下生物量(B) Pearson’s相关系数。各特征变量的含义及计算公式见附录。
Fig. 3 Pearson correlation coefficient of determination (R2) between the metrics and above-ground biomass (A), below-ground biomass (B) in study area. The meaning and calculation of the metrics see appendixes.
| OLI模型 OLI model | LiDAR模型 LiDAR model | 综合模型 Combo model | ||||||||
|---|---|---|---|---|---|---|---|---|---|---|
| R2 | RMSE | rRMSE (%) | R2 | RMSE | rRMSE (%) | R2 | RMSE | rRMSE (%) | ||
| 地上生物量 Above-ground biomass | 所有样地 All plots | 0.41 | 21.89 | 26 | 0.65 | 16.96 | 20 | 0.65 | 16.95 | 20 |
| 针叶林 Coniferous forest | 0.67 | 12.89 | 17 | 0.82 | 9.61 | 13 | 0.86 | 8.59 | 11 | |
| 阔叶林 Broad-leaf forest | 0.74 | 19.02 | 20 | 0.93 | 9.52 | 10 | 0.93 | 9.52 | 10 | |
| 混交林 Mixed forest | 0.77 | 14.70 | 17 | 0.80 | 13.74 | 16 | 0.83 | 12.84 | 15 | |
| 地下生物量 Below-ground biomass | 所有样地 All plots | 0.57 | 4.90 | 19 | 0.64 | 4.47 | 17 | 0.69 | 4.17 | 16 |
| 针叶林 Coniferous forest | 0.70 | 3.59 | 16 | 0.75 | 3.24 | 14 | 0.91 | 2.00 | 9 | |
| 阔叶林 Broad-leaf forest | 0.80 | 3.11 | 12 | 0.86 | 2.69 | 10 | 0.92 | 2.03 | 8 | |
| 混交林 Mixed forest | 0.84 | 3.71 | 14 | 0.83 | 3.74 | 14 | 0.92 | 2.55 | 10 | |
表2 针对不同森林类型的3种模型的精度评价表
Table 2 Assessment accuracy of three empirical models by forest type
| OLI模型 OLI model | LiDAR模型 LiDAR model | 综合模型 Combo model | ||||||||
|---|---|---|---|---|---|---|---|---|---|---|
| R2 | RMSE | rRMSE (%) | R2 | RMSE | rRMSE (%) | R2 | RMSE | rRMSE (%) | ||
| 地上生物量 Above-ground biomass | 所有样地 All plots | 0.41 | 21.89 | 26 | 0.65 | 16.96 | 20 | 0.65 | 16.95 | 20 |
| 针叶林 Coniferous forest | 0.67 | 12.89 | 17 | 0.82 | 9.61 | 13 | 0.86 | 8.59 | 11 | |
| 阔叶林 Broad-leaf forest | 0.74 | 19.02 | 20 | 0.93 | 9.52 | 10 | 0.93 | 9.52 | 10 | |
| 混交林 Mixed forest | 0.77 | 14.70 | 17 | 0.80 | 13.74 | 16 | 0.83 | 12.84 | 15 | |
| 地下生物量 Below-ground biomass | 所有样地 All plots | 0.57 | 4.90 | 19 | 0.64 | 4.47 | 17 | 0.69 | 4.17 | 16 |
| 针叶林 Coniferous forest | 0.70 | 3.59 | 16 | 0.75 | 3.24 | 14 | 0.91 | 2.00 | 9 | |
| 阔叶林 Broad-leaf forest | 0.80 | 3.11 | 12 | 0.86 | 2.69 | 10 | 0.92 | 2.03 | 8 | |
| 混交林 Mixed forest | 0.84 | 3.71 | 14 | 0.83 | 3.74 | 14 | 0.92 | 2.55 | 10 | |
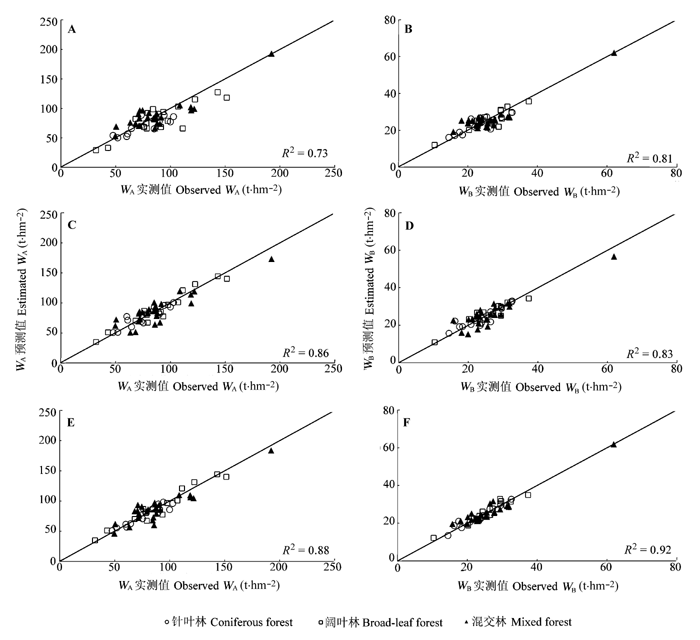
图4 基于不同森林类型地上和地下生物量样地实测值与模型(OLI模型、LiDAR模型和综合模型)预测值的对比散点图及1:1线图。A, OLI模型:地上生物量。B, OLI模型:地下生物量。C, LiDAR模型:地上生物量。D, LiDAR模型:地下生物量。E, 综合模型:地上生物量。F, 综合模型:地下生物量。
Fig. 4 Scatter plots and 1:1 line of between observed and estimated biomass using three different models by forest type. A, OLI model for WA. B, OLI model for WB. C, LiDAR model for WA. D, LiDAR model for WB. E, Combo model WA. F, Combo model for WB. WA, above-ground biomass; WB, below-ground biomass.
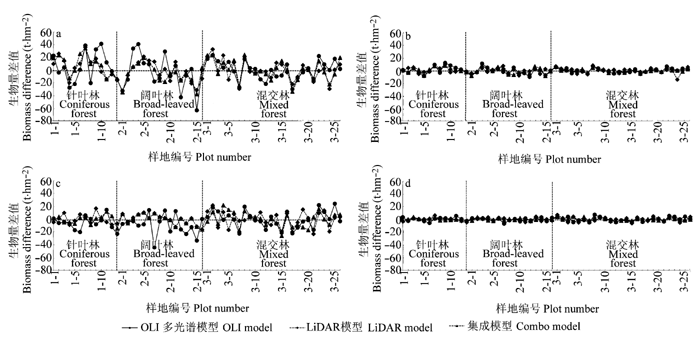
图5 分别3种模型(OLI模型、LiDAR模型以及综合模型)下应用总体模型和分类模型估测不同森林类型生物量的预测值和样地实测值的差值对比图。A, 总体模型:地上生物量。B, 总体模型:地下生物量。C, 分类模型:地上生物量。D, 分类模型:地下生物量。
Fig. 5 Difference between Observed and predicted biomass by using the general model and type-specific model. A, General model for WA. B, General model for WB. C, Type-specific model for WA. D, type-specific model for WB. WA, above-ground biomass; WB, below-ground biomass.
| 所有样地 All plots | 针叶林 Coniferous forest | 阔叶林 Broad-leaf forest | 混交林 Mixed forest | ||||||
|---|---|---|---|---|---|---|---|---|---|
| WA | WB | WA | WB | WA | WB | WA | WB | ||
| 截距 Intercept | 2 409.14 | 864.48 | 1.04E+09 | 2.85E+08 | 187.60 | 36.70 | 2446.32 | 914.45 | OLI模型 OLI model |
| B3 | 0.37 | ||||||||
| B547 | -0.035 | -0.007 | -0.15 | -0.06 | -0.009 | ||||
| VIS234 | 0.01 | 0.0065 | |||||||
| PC3 | -0.04 | ||||||||
| MNF4 | -96.44 | -36.26 | |||||||
| MSR | 4.10 | ||||||||
| CO | 218.01 | 80.05 | 1.04E+08 | 28 480 530 | 219.33 | 84.60 | |||
| DI | -1 335.77 | -491.58 | -6.3E+08 | -1.7E+08 | -1 338.25 | -520.93 | |||
| HO | -2 273.01 | -829.24 | -1E+09 | -2.8E+08 | -2 271.07 | -875.005 | |||
| VA | 273.39 | 58.36 | |||||||
| 置信区间 Confidence interval (t·hm-2) | [47.50- 192.26] | [11.56- 61.86] | [55.48- 96.23] | [16.03- 29.58] | [39.10- 135.24] | [12.32- 35.68] | [52.64- 192.38] | [19.05- 61.92] | |
| 截距 Intercept | -32.81 | -2.17 | -21.61 | 13.50 | -115.94 | 9.48 | -60.81 | -9.77 | LiDAR模型 LiDAR model |
| hmode | 13.94 | 3.49 | -5.87 | 2.73 | |||||
| hmax | -7.31 | ||||||||
| h30 | -120.56 | 138.36 | |||||||
| h40 | 235.50 | -218.91 | -87.73 | ||||||
| h50 | 325.85 | 21.61 | |||||||
| h60 | -284.52 | ||||||||
| h70 | -12.92 | -41.51 | |||||||
| h75 | -228.71 | ||||||||
| h80 | -93.72 | -27.86 | 16.68 | ||||||
| h90 | 123.51 | ||||||||
| h95 | 81.22 | 23.80 | 162.76 | 19.67 | 55.78 | 20.99 | |||
| h99 | -73.61 | -8.65 | |||||||
| d7 | 0.89 | 0.36 | 0.31 | ||||||
| d9 | -13.79 | ||||||||
| 置信区间 Confidence interval (t·hm-2) | [36.84- 162.70] | [13.74- 47.48] | [50.83- 100.67] | [15.71- 32.93] | [34.84- 144.47] | [10.90- 34.27] | [50.67- 173.34] | [15.24- 56.67] | |
表3 基于不同森林类型的OLI模型和LiDAR模型变量的选择及参数和置信区间
Table 3 Selected independent variables, R2, and confidence interval values for the OLI and LiDAR model by forest type
| 所有样地 All plots | 针叶林 Coniferous forest | 阔叶林 Broad-leaf forest | 混交林 Mixed forest | ||||||
|---|---|---|---|---|---|---|---|---|---|
| WA | WB | WA | WB | WA | WB | WA | WB | ||
| 截距 Intercept | 2 409.14 | 864.48 | 1.04E+09 | 2.85E+08 | 187.60 | 36.70 | 2446.32 | 914.45 | OLI模型 OLI model |
| B3 | 0.37 | ||||||||
| B547 | -0.035 | -0.007 | -0.15 | -0.06 | -0.009 | ||||
| VIS234 | 0.01 | 0.0065 | |||||||
| PC3 | -0.04 | ||||||||
| MNF4 | -96.44 | -36.26 | |||||||
| MSR | 4.10 | ||||||||
| CO | 218.01 | 80.05 | 1.04E+08 | 28 480 530 | 219.33 | 84.60 | |||
| DI | -1 335.77 | -491.58 | -6.3E+08 | -1.7E+08 | -1 338.25 | -520.93 | |||
| HO | -2 273.01 | -829.24 | -1E+09 | -2.8E+08 | -2 271.07 | -875.005 | |||
| VA | 273.39 | 58.36 | |||||||
| 置信区间 Confidence interval (t·hm-2) | [47.50- 192.26] | [11.56- 61.86] | [55.48- 96.23] | [16.03- 29.58] | [39.10- 135.24] | [12.32- 35.68] | [52.64- 192.38] | [19.05- 61.92] | |
| 截距 Intercept | -32.81 | -2.17 | -21.61 | 13.50 | -115.94 | 9.48 | -60.81 | -9.77 | LiDAR模型 LiDAR model |
| hmode | 13.94 | 3.49 | -5.87 | 2.73 | |||||
| hmax | -7.31 | ||||||||
| h30 | -120.56 | 138.36 | |||||||
| h40 | 235.50 | -218.91 | -87.73 | ||||||
| h50 | 325.85 | 21.61 | |||||||
| h60 | -284.52 | ||||||||
| h70 | -12.92 | -41.51 | |||||||
| h75 | -228.71 | ||||||||
| h80 | -93.72 | -27.86 | 16.68 | ||||||
| h90 | 123.51 | ||||||||
| h95 | 81.22 | 23.80 | 162.76 | 19.67 | 55.78 | 20.99 | |||
| h99 | -73.61 | -8.65 | |||||||
| d7 | 0.89 | 0.36 | 0.31 | ||||||
| d9 | -13.79 | ||||||||
| 置信区间 Confidence interval (t·hm-2) | [36.84- 162.70] | [13.74- 47.48] | [50.83- 100.67] | [15.71- 32.93] | [34.84- 144.47] | [10.90- 34.27] | [50.67- 173.34] | [15.24- 56.67] | |
| 所有样地 All plots | 针叶林 Coniferous forest | 阔叶林 Broad-leaf forest | 混交林 Mixed forest | |||||
|---|---|---|---|---|---|---|---|---|
| WA | WB | WA | WB | WA | WB | WA | WB | |
| 截距 Intercept | -34.93 | 785.68 | 1.32E+09 | -9.94 | -115.94 | 65.97 | 78.07 | 748.99 |
| B3 | 0.02 | |||||||
| B547 | -0.05 | |||||||
| CO | 10.31 | 76.24 | 1.32E+08 | 35.53 | 75.10 | |||
| DI | -462.14 | -7.9E+08 | -31.68 | -448.39 | ||||
| HO | -776.42 | -1.3E+09 | -743.58 | |||||
| VA | 17.21 | 55.73 | ||||||
| hmode | 10.53 | |||||||
| hmean | 8.57 | |||||||
| hvar | 7.42 | |||||||
| hstd | 8.76 | |||||||
| h30 | 138.36 | |||||||
| h40 | -218.91 | 2.27 | ||||||
| h50 | 1.58 | |||||||
| h70 | 112.63 | |||||||
| h80 | -49.47 | -114.51 | ||||||
| h95 | 45.75 | 162.76 | ||||||
| h99 | -73.61 | |||||||
| d7 | -1.80 | -0.25 | ||||||
| 置信区间 Confidence interval (t·hm-2) | [37.59- 169.87] | [16.16- 61.90] | [51.46- 99.03] | [13.44- 32.78] | [34.84- 144.47] | [12.17- 34.96] | [46.16- 184.05] | [19.59- 61.90] |
表4 基于不同森林类型的综合模型变量的选择及参数情况和置信区间
Table 4 Selected independent variables and associated statistics in our combo model by forest type
| 所有样地 All plots | 针叶林 Coniferous forest | 阔叶林 Broad-leaf forest | 混交林 Mixed forest | |||||
|---|---|---|---|---|---|---|---|---|
| WA | WB | WA | WB | WA | WB | WA | WB | |
| 截距 Intercept | -34.93 | 785.68 | 1.32E+09 | -9.94 | -115.94 | 65.97 | 78.07 | 748.99 |
| B3 | 0.02 | |||||||
| B547 | -0.05 | |||||||
| CO | 10.31 | 76.24 | 1.32E+08 | 35.53 | 75.10 | |||
| DI | -462.14 | -7.9E+08 | -31.68 | -448.39 | ||||
| HO | -776.42 | -1.3E+09 | -743.58 | |||||
| VA | 17.21 | 55.73 | ||||||
| hmode | 10.53 | |||||||
| hmean | 8.57 | |||||||
| hvar | 7.42 | |||||||
| hstd | 8.76 | |||||||
| h30 | 138.36 | |||||||
| h40 | -218.91 | 2.27 | ||||||
| h50 | 1.58 | |||||||
| h70 | 112.63 | |||||||
| h80 | -49.47 | -114.51 | ||||||
| h95 | 45.75 | 162.76 | ||||||
| h99 | -73.61 | |||||||
| d7 | -1.80 | -0.25 | ||||||
| 置信区间 Confidence interval (t·hm-2) | [37.59- 169.87] | [16.16- 61.90] | [51.46- 99.03] | [13.44- 32.78] | [34.84- 144.47] | [12.17- 34.96] | [46.16- 184.05] | [19.59- 61.90] |
| [1] | Cao L, Coops NC, Innes J, Dai JS, She GH (2014a). Mapping above- and below-ground biomass components in subtropical forests using small-footprint LiDAR.Forests, 5, 1356-1373. |
| [2] | Cao L, Coops NC, Hermosilla T, Innes J, Dai JS, She GH (2014b). Using small-footprint discrete and full-waveform airborne LiDAR metrics to estimate total biomass and biomass components in subtropical forests.Remote Sensing, 6, 7110-7135. |
| [3] | Cao L, Dai JS, Xu JX, Xu ZQ, She GH (2014). Optimized extraction of forest parameters in subtropical forests based on airborne small footprint LiDAR technology.Journal of Beijing Forestry University, 36(5), 13-21.(in Chinese with English abstract) |
| [曹林, 代劲松, 徐建新, 许子乾, 佘光辉 (2014). 基于机载小光斑LiDAR技术的亚热带森林参数信息优化提取. 北京林业大学学报, 36(5), 13-21.] | |
| [4] | Dixon RK, Solomon AM, Brown S, Houghton RA, Trexier MC, Wisniewski J (1994). Carbon pools and flux of global forest ecosystems.Science, 263, 185-190. |
| [5] | Dong LX (2008). Estimation of Forest Canopy Height and Biomass in Three Gorges Reservoir Area Based on Multi-source Remote Sensing Data. PhD dissertation, Graduate University of Chinese Academy of Sciences, Beijing.(in Chinese) |
| [董立新 (2008). 基于多源遥感数据的三峡库区森林冠层高度与生物量估算方法研究. 博士学位论文, 中国科学院研究生院, 北京.] | |
| [6] | Dubayah RO, Drake JB (2000). Lidar remote sensing for forestry.Journal of Forestry, 98(6), 44-46. |
| [7] | Fang JY, Chen AP, Zhao SQ, Ci LJ (2002). Estimating biomass carbon of China’s forests: Supplementary notes on report published in Science (291: 2320-2322) by FANG et al. (2001).Acta Phytoecologica Sinica, 26, 243-249.(in Chinese with English abstract) |
| [方精云, 陈安平, 赵淑清, 慈龙俊 (2002). 中国森林生物量的估算: 对Fang等Science一文(Science, 2001, 291: 2320-2322)的若干说明. 植物生态学报, 26, 243-249.] | |
| [8] | Fang JY, Wang W (2007). Soil respiration as a key below ground process: issues and perspectives. Journal of Plant Ecology (Chinese Version), 31, 345-347.(in Chinese with English abstract) |
| [方精云, 王娓 (2007). 作为地下过程的土壤呼吸: 我们理解了多少? 植物生态学报, 31, 345-347.] | |
| [9] | Feng ZW, Wang XK, Wu G (1999). The Forest Ecosystem Biomass and Productivity in China. Science Press, Beijing. 99-187.(in Chinese) |
| [冯宗炜, 王效科, 吴刚 (1999). 中国森林生态系统的生物量和生产力. 科学出版社, 北京. 99-187.] | |
| [10] | Fu T, Pang Y, Huang QF, Liu QW, Xu GC (2011). Prediction of subtropical forest parameters using airborne laser scanner.Journal of Remote Sensing, 15, 1092-1104.(in Chinese with English abstract) |
| [付甜, 庞勇, 黄庆丰, 刘清旺, 徐光彩 (2011). 亚热带森林参数的机载激光雷达估测. 遥感学报, 15, 1092-1104.] | |
| [11] | Guo ZF, Chi H, Sun GQ (2010). Estimating forest aboveground biomass using HJ-1 satellite CCD and ICESat GLAS waveform data.Science China Earth Sciences, 53, 16-25. |
| [12] | Jiang GZ, Han B, Gao YB, Yang CJ (2013). Review of 40-year earth observation with landsat series and prospects of LDCM.Journal of Remote Sensing, 17, 1033-1048.(in Chinese with English abstract) |
| [姜高珍, 韩冰, 高应波, 杨崇俊 (2013). Landsat系列卫星对地观测40年回顾及LDCM前瞻. 遥感学报, 17, 1033-1048.] | |
| [13] | Kraus K, Pfeifer N (1998). Determination of terrain models in wooded areas with airborne laser scanner data.ISPRS Journal of Photogrammetry and Remote Sensing, 53, 193-203. |
| [14] | Lefsky MA, Cohen WB, Parker GG, Harding DJ (2002). Lidar remote sensing for ecosystem studies.Bioscience, 52, 19-30. |
| [15] | Li MS, Tan Y, Pan J, Peng SK (2006). Modeling forest aboveground biomass by combining the spectrum, textures with topographic features.Remote Sensing Information, (6), 6-9.(in Chinese with English abstract) |
| [李明诗, 谭莹, 潘洁, 彭世揆 (2006). 结合光谱、纹理及地形特征的森林生物量建模研究. 遥感信息, (6), 6-9.] | |
| [16] | Liu LJ (2011). Forest Parameters Inversion Using Airborne LiDAR and Hyperspectral Data Fusion. PhD dissertation, Northeast Forestry University, Harbin.(in Chinese) |
| [刘丽娟 (2011). 基于机载LIDAR和高光谱融合的森林参数反演研究. 博士学位论文, 东北林业大学, 哈尔滨.] | |
| [17] | Lu DS, Mausel P, Brondzio E, Moran E (2003). Estimation of forest stand parameters using Landsat TM images in the brazilian amazon basin. International Symposium on Remote Sensing of Environment: Information for Risk Management and Sustainable Development, 423-426. |
| [18] | Ma LQ, Li AN (2011). Review of application of LiDAR to estimation of forest vertical structure parameters.World Forestry Research, 24(1), 41-45.(in Chinese with English abstract) |
| [马利群, 李爱农 (2011). 激光雷达在森林垂直结构参数估算中的应用. 世界林业研究, 24(1), 41-45.] | |
| [19] | Næsset E, Gobakken T (2008). Estimation of above- and below-ground biomass across regions of the boreal forest zone using airborne laser.Remote Sensing of Environment, 112, 3079-3090. |
| [20] | Pang Y, Li ZY (2012). Inversion of biomass components of the temperate forest using airborne lidar technology in Xiaoxing’an mountains, northeastern of China.Chinese Journal of Plant Ecology, 36, 1095-1105.(in Chinese with English abstract) |
| [庞勇, 李增元 (2012). 基于机载激光雷达的小兴安岭温带森林组分生物量反演. 植物生态学报, 36, 1095-1105.] | |
| [21] | Popescu SC, Wynne RH, Scrivani JA (2004). Fusion of small footprint LiDAR and multispectral data to estimate plot-level volume and biomass in deciduous and pine forests in Virginia, USA.Forest Sciences, 50, 551-565. |
| [22] | Post WM, Emanuel WR, Zinke PJ, Stangenberger AG (1982). Soil carbon pools and world life zones.Nature, 298, 156-159. |
| [23] | Xu HQ, Tang F (2013). Analysis of new characteristics of the first Landsat 8 image and their eco-environmental significance.Acta Ecologica Sinica, 33, 3249-3257.(in Chinese with English abstract) |
| [徐涵秋, 唐菲(2013). 新一代Landsat系列卫星: Landsat 8遥感影像新增特征及其生态环境意义. 生态学报, 33, 3249-3257.] | |
| [24] | Zhang Z, Tian X, Chen EX, He QS (2011). Review of methods on estimating forest above ground biomass.Journal of Beijing Forestry University, 33(5), 144-150.(in Chinese with English abstract) |
| [张志, 田昕, 陈尔学, 何祺胜 (2011). 森林地上生物量估测方法研究综述. 北京林业大学学报, 33(5), 144-150.] | |
| [25] | Zhu GL, Wei WS, Zhang SM, Wu DX (2008). An overview of methods of measuring underground-biomass and introduction of new technique.Chinese Journal of Grassland, 30(3), 94-99.(in Chinese with English abstract) |
| [朱桂林, 韦文珊, 张淑敏, 吴冬秀 (2008). 植物地下生物量测定方法概述及新技术介绍. 中国草地学报, 30(3), 94-99.] |
| [1] | 王蓉钧, 吴福忠, 吴秋霞, 朱晶晶, 倪祥银. 不同生活型植物叶片氮重吸收效率的差异[J]. 植物生态学报, 2026, 50(2): 344-351. |
| [2] | 邱丹妮, 彭清清, 张慧玲, 温辉辉, 吴福忠. 中亚热带常绿阔叶林典型乔木树种对蚂蚁群落季节性动态的影响[J]. 植物生态学报, 2025, 49(11): 1805-1816. |
| [3] | 冉佳鑫, 张宇辉, 王云, 杨智杰, 毛超. 增温和氮磷添加对亚热带森林凋落物溶解有机碳生物可降解性的影响[J]. 植物生态学报, 2024, 48(9): 1232-1242. |
| [4] | 陆啸飞, 覃张芬, 王斌, 旷远文. 氮添加对南亚热带常绿阔叶林林下植物-土壤植硅体碳的影响[J]. 植物生态学报, 2024, 48(10): 1302-1311. |
| [5] | 张慧玲, 张耀艺, 彭清清, 杨静, 倪祥银, 吴福忠. 中亚热带同质园不同生活型树种微量元素重吸收效率的差异[J]. 植物生态学报, 2023, 47(7): 978-987. |
| [6] | 万春燕, 余俊瑞, 朱师丹. 喀斯特与非喀斯特森林乔木叶性状及其相关性网络的差异[J]. 植物生态学报, 2023, 47(10): 1386-1397. |
| [7] | 赵晏平, 王忠武, 温都日根, 赵玉金, 白永飞. 基于Sentinel-2数据的草地植物功能多样性遥感反演及其与生产力的关系[J]. 植物生态学报, 2022, 46(10): 1234-1250. |
| [8] | 刘超, 李平, 武运涛, 潘胜难, 贾舟, 刘玲莉. 一种基于数码相机图像和群落冠层结构调查的草地地上生物量估算方法[J]. 植物生态学报, 2022, 46(10): 1280-1288. |
| [9] | 吴秋霞, 吴福忠, 胡仪, 康自佳, 张耀艺, 杨静, 岳楷, 倪祥银, 杨玉盛. 亚热带同质园11个树种新老叶非结构性碳水化合物含量比较[J]. 植物生态学报, 2021, 45(7): 771-779. |
| [10] | 曹嘉瑜, 刘建峰, 袁泉, 徐德宇, 樊海东, 陈海燕, 谭斌, 刘立斌, 叶铎, 倪健. 森林与灌丛的灌木性状揭示不同的生活策略[J]. 植物生态学报, 2020, 44(7): 715-729. |
| [11] | 陈思路, 蔡劲松, 林成芳, 宋豪威, 杨玉盛. 亚热带不同树种凋落叶分解对氮添加的响应[J]. 植物生态学报, 2020, 44(3): 214-227. |
| [12] | 梅孔灿, 程蕾, 张秋芳, 林开淼, 周嘉聪, 曾泉鑫, 吴玥, 徐建国, 周锦容, 陈岳民. 不同植物来源可溶性有机质对亚热带森林土壤酶活性的影响[J]. 植物生态学报, 2020, 44(12): 1273-1284. |
| [13] | 车俭, 郑洁, 蒋娅, 金毅, 乙引. 中国亚热带森林动态监测样地常绿和落叶木本被子植物谱系结构及生态习性差异[J]. 植物生态学报, 2020, 44(10): 1007-1014. |
| [14] | 张振振, 赵平, 张锦秀, 斯瑶. 亚热带常绿阔叶林散孔材和环孔材树种导管及叶片功能性状的比较[J]. 植物生态学报, 2019, 43(2): 131-138. |
| [15] | 张瑞英, 庞勇, 李增元, 包玉海. 结合机载LiDAR和LANDSAT ETM+数据的温带森林郁闭度估测[J]. 植物生态学报, 2016, 40(2): 102-115. |
| 阅读次数 | ||||||
|
全文 |
|
|||||
|
摘要 |
|
|||||
Copyright © 2026 版权所有 《植物生态学报》编辑部
地址: 北京香山南辛村20号, 邮编: 100093
Tel.: 010-62836134, 62836138; Fax: 010-82599431; E-mail: apes@ibcas.ac.cn, cjpe@ibcas.ac.cn
备案号: 京ICP备16067583号-19
![]()