
Chin J Plant Ecol ›› 2012, Vol. 36 ›› Issue (5): 372-381.DOI: 10.3724/SP.J.1258.2012.00372
• Research Articles • Previous Articles Next Articles
LI He1,2, ZHANG Wei-Kang1,3, WANG Guo-Hong1,*( )
)
Published:2012-05-04
Contact:
WANG Guo-Hong
LI He, ZHANG Wei-Kang, WANG Guo-Hong. Relationship between climatic factors and geographical distribution of spruce forests in China[J]. Chin J Plant Ecol, 2012, 36(5): 372-381.
Add to citation manager EndNote|Ris|BibTeX
URL: https://www.plant-ecology.com/EN/10.3724/SP.J.1258.2012.00372
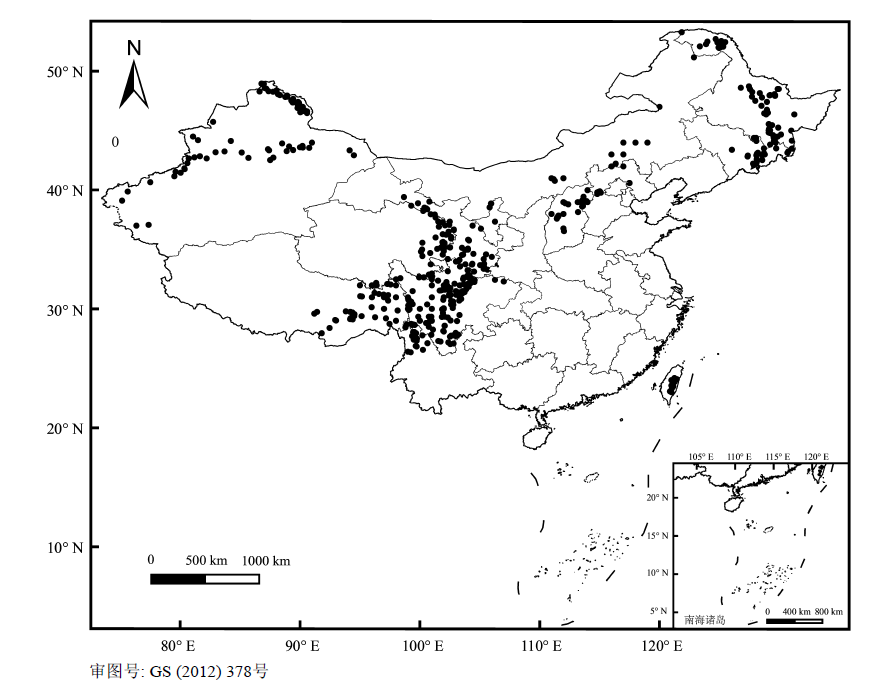
Fig. 1 Location of Chinese spruce forest distribution data.
| 海拔及其对应的气候因子 Altitude and corresponding climatic factors | 平均值 Mean | 标准误差 Standard error | 95%置信区间 95% confidence intervals | 最小值 Minimum | 最大值 Maximum | |
|---|---|---|---|---|---|---|
| 下限 Lower limit | 上限 Upper limit | |||||
| 海拔 Altitude (m) | 2 444.09 | 42.20 | 2 361.21 | 2 526.96 | 300.00 | 4 347.00 |
| 年平均气温 Mean annual air temperature (℃) | 3.38 | 0.19 | 3.00 | 3.75 | -9.18 | 20.10 |
| 最冷月平均气温 Mean air temperature of the coldest month (℃) | -9.75 | 0.34 | -10.43 | -9.07 | -30.51 | 11.52 |
| 最热月平均气温 Mean air temperature of the warmest month (℃) | 14.78 | 0.20 | 14.38 | 15.17 | 1.69 | 27.27 |
| ≥5 ℃积温 Growing degree days on a 5 ℃ basis (℃·d) | 1 227.83 | 35.46 | 1 158.20 | 1 297.46 | 0.00 | 5 527.56 |
| ≥0 ℃积温 Growing degree days on a 0 ℃ basis (℃·d) | 2 271.19 | 46.72 | 2 179.44 | 2 362.94 | 69.76 | 7 352.57 |
| 年降水量 Mean annual precipitation (mm) | 712.23 | 14.52 | 683.71 | 740.75 | 103.65 | 2 050.37 |
| 土壤水分含量 Soil moisture (%) | 80.02 | 0.83 | 78.40 | 81.64 | 0.00 | 97.83 |
| 干燥指数 Aridity index | 0.50 | 0.01 | 0.49 | 0.52 | 0.00 | 0.90 |
Table 1 Descriptive statistics of altitude and corresponding climatic factors in the geographical distribution area of Chinese spruce forests (n = 613)
| 海拔及其对应的气候因子 Altitude and corresponding climatic factors | 平均值 Mean | 标准误差 Standard error | 95%置信区间 95% confidence intervals | 最小值 Minimum | 最大值 Maximum | |
|---|---|---|---|---|---|---|
| 下限 Lower limit | 上限 Upper limit | |||||
| 海拔 Altitude (m) | 2 444.09 | 42.20 | 2 361.21 | 2 526.96 | 300.00 | 4 347.00 |
| 年平均气温 Mean annual air temperature (℃) | 3.38 | 0.19 | 3.00 | 3.75 | -9.18 | 20.10 |
| 最冷月平均气温 Mean air temperature of the coldest month (℃) | -9.75 | 0.34 | -10.43 | -9.07 | -30.51 | 11.52 |
| 最热月平均气温 Mean air temperature of the warmest month (℃) | 14.78 | 0.20 | 14.38 | 15.17 | 1.69 | 27.27 |
| ≥5 ℃积温 Growing degree days on a 5 ℃ basis (℃·d) | 1 227.83 | 35.46 | 1 158.20 | 1 297.46 | 0.00 | 5 527.56 |
| ≥0 ℃积温 Growing degree days on a 0 ℃ basis (℃·d) | 2 271.19 | 46.72 | 2 179.44 | 2 362.94 | 69.76 | 7 352.57 |
| 年降水量 Mean annual precipitation (mm) | 712.23 | 14.52 | 683.71 | 740.75 | 103.65 | 2 050.37 |
| 土壤水分含量 Soil moisture (%) | 80.02 | 0.83 | 78.40 | 81.64 | 0.00 | 97.83 |
| 干燥指数 Aridity index | 0.50 | 0.01 | 0.49 | 0.52 | 0.00 | 0.90 |
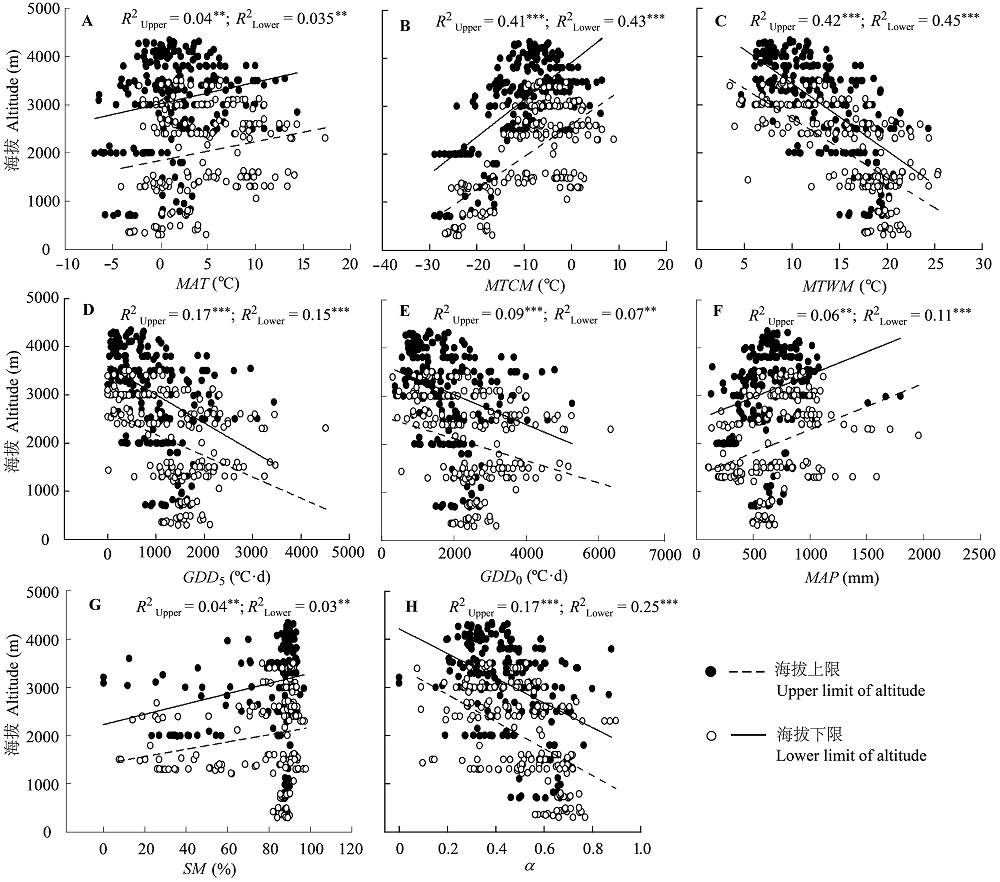
Fig. 2 Regression relationships between the lower and upper altitudinal limits of Chinese spruce forests and climatic factors. R2Upper represent determination coefficient of spruce upper distribution point with altitude; R2Lower represent determination coefficient of spruce lower distribution point with altitude. **, p < 0.01; ***, p < 0.001; α, aridity index; MAP, mean annual precipitation; MAT, mean annual air temperature; MTCM, mean air temperature of the coldest month; MTWM, mean air temperature of the warmest month; SM, soil moisture; GDD5, growing degree days on a 5 ℃ basis; GDD0, growing degree days on a 0 ℃ basis.
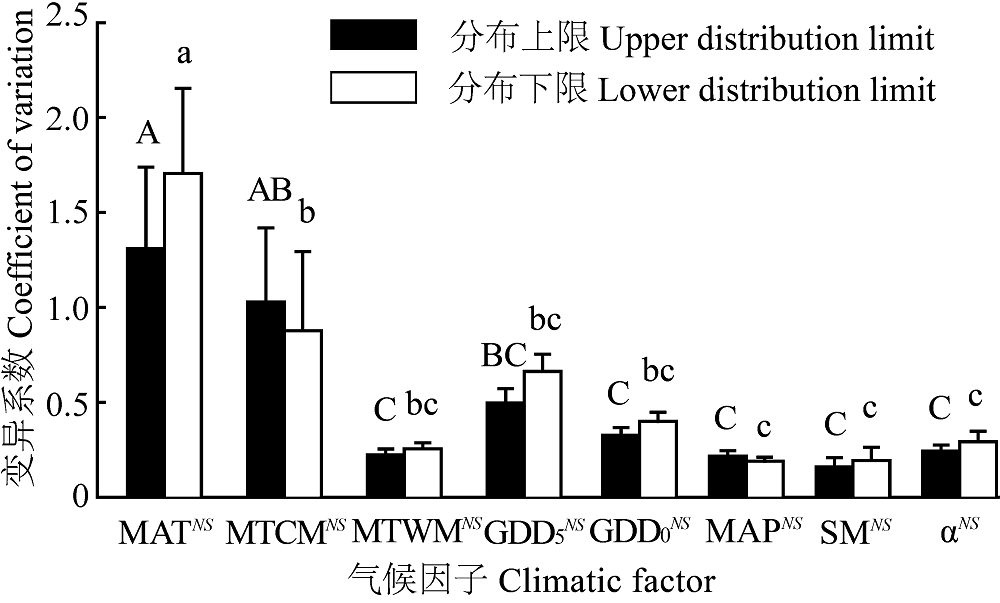
Fig. 3 Comparison of coefficient of variation among climatic factors in the distribution range of Chinese spruce forests. Climatic factors sharing no letters of the same series (upper limit or lower limit) in the histogram indicates that the difference is significant (p < 0.05); NS shows no significant differences between upper and lower distribution limit (p > 0.05); α, aridity index; MAP, mean annual precipitation; MAT, mean annual air temperature; MTCM, mean air temperature of the coldest month; MTWM, mean air temperature of the warmest month; GDD5, growing degree days on a 5 ℃ basis; GDD0, growing degree days on a 0 ℃ basis; SM, soil moisture.
| 气候因子 Climatic factor | 主分量载荷 Principal component (PC) loading value | ||||||
|---|---|---|---|---|---|---|---|
| 分布上限 Upper distribution limit | 分布下限 Lower distribution limit | ||||||
| PC1 | PC2 | PC3 | PC1 | PC2 | PC3 | ||
| 年平均气温 Mean annual air temperature (℃) | 0.89 | 0.31 | -0.28 | 0.87 | 0.32 | -0.34 | |
| 最冷月平均气温 Mean temperature of the coldest month (℃) | 0.51 | 0.74 | -0.38 | 0.42 | 0.75 | -0.48 | |
| 最热月平均气温 Mean temperature of the warmest month (℃) | 0.79 | -0.56 | 0.12 | 0.79 | -0.57 | 0.14 | |
| ≥5 ℃积温 Growing degree days on a 5 ℃ basis (℃·d) | 0.93 | -0.33 | -0.06 | 0.96 | -0.25 | -0.05 | |
| ≥0 ℃积温 Growing degree days on a 0 ℃ basis (℃·d) | 0.96 | -0.20 | -0.12 | 0.98 | -0.12 | -0.09 | |
| 年降水量 Mean annual precipitation (mm) | 0.47 | 0.75 | 0.12 | 0.25 | 0.88 | 0.15 | |
| 土壤水分含量 Soil moisture (%) | 0.17 | 0.72 | 0.60 | 0.06 | 0.78 | 0.58 | |
| 干燥指数 Aridity index | 0.72 | -0.26 | 0.49 | 0.74 | -0.08 | 0.62 | |
| 特征值 Eigenvalue | 4.24 | 2.26 | 0.87 | 4.06 | 2.46 | 1.12 | |
| 信息量 Information amount (%) | 53.02 | 28.22 | 10.90 | 50.77 | 30.81 | 11.06 | |
Table 2 The principal component analysis of climatic factors at upper and lower altitudinal limits of Chinese spruce forests
| 气候因子 Climatic factor | 主分量载荷 Principal component (PC) loading value | ||||||
|---|---|---|---|---|---|---|---|
| 分布上限 Upper distribution limit | 分布下限 Lower distribution limit | ||||||
| PC1 | PC2 | PC3 | PC1 | PC2 | PC3 | ||
| 年平均气温 Mean annual air temperature (℃) | 0.89 | 0.31 | -0.28 | 0.87 | 0.32 | -0.34 | |
| 最冷月平均气温 Mean temperature of the coldest month (℃) | 0.51 | 0.74 | -0.38 | 0.42 | 0.75 | -0.48 | |
| 最热月平均气温 Mean temperature of the warmest month (℃) | 0.79 | -0.56 | 0.12 | 0.79 | -0.57 | 0.14 | |
| ≥5 ℃积温 Growing degree days on a 5 ℃ basis (℃·d) | 0.93 | -0.33 | -0.06 | 0.96 | -0.25 | -0.05 | |
| ≥0 ℃积温 Growing degree days on a 0 ℃ basis (℃·d) | 0.96 | -0.20 | -0.12 | 0.98 | -0.12 | -0.09 | |
| 年降水量 Mean annual precipitation (mm) | 0.47 | 0.75 | 0.12 | 0.25 | 0.88 | 0.15 | |
| 土壤水分含量 Soil moisture (%) | 0.17 | 0.72 | 0.60 | 0.06 | 0.78 | 0.58 | |
| 干燥指数 Aridity index | 0.72 | -0.26 | 0.49 | 0.74 | -0.08 | 0.62 | |
| 特征值 Eigenvalue | 4.24 | 2.26 | 0.87 | 4.06 | 2.46 | 1.12 | |
| 信息量 Information amount (%) | 53.02 | 28.22 | 10.90 | 50.77 | 30.81 | 11.06 | |
| [1] |
Bergmann F (1978). The allelic distribution at an acid phosphatase locus in Norway spruce (Picea abies) along similar climatic gradients. Theoretical and Applied Genetics, 52, 57-64.
DOI URL PMID |
| [2] | Cao YF (曹玉芳), Xu F (许方), Yao DY (姚敦义) (1995). Tsugae plants and the development of male and female gametophyte embryogenesis. Journal of Laiyang Agriculture College (莱阳农学院学报), ( 3), 206-212. (in Chinese with English abstract) |
| [3] | Chinese Vegetation Editorial Committee (《中国植被》编辑委员会) (1980). Chinese Vegetation (中国植被). Science Press, Beijing. (in Chinese) |
| [4] | Committee of China Forest Compiler (《中国森林》编辑委员会) (2000). China Forest (中国森林). China Forestry Publishing House, Beijing. (in Chinese) |
| [5] |
Fall PL (1997). Timberline fluctuations and late Quaternary paleoclimates in the Southern Rocky Mountains, Colorado. Bulletin of the Geological Society of America, 109, 1306-1320.
DOI URL |
| [6] |
Fang JY, Kyoji Y (1988). Climate and vegetation in China. I. Changes in the altitudinal lapse rate of temperature and distribution of sea level temperature. Ecological Research, 3, 37-51.
DOI URL |
| [7] |
Fang JY, Kyoji Y (1991). Climate and vegetation in China V. Effect of climatic factors on the upper limit of distribution of evergreen broadleaf forest. Ecological Research, 6, 113-125.
DOI URL |
| [8] |
Fang JY, Lechowicz MJ (2006). Climatic limits for the present distribution of beech (Fagus L.) species in the world. Journal of Biogeography, 33, 1804-1819.
DOI URL |
| [9] | Fang JY (方精云), Li Y (李莹) (2002). Climatic factors for limiting northward distribution of eight temperate tree species in Eastern North America. Acta Botanica Sinica (植物学报), 44, 199-203. (in Chinese with English abstract) |
| [10] |
Haxeltine A, Prentice IC (1996). BIOME3, an equilibrium terrestrial biosphere model based on ecophysiological constraints, resource availability, and competition among plant functional types. Global Biogeochemical Cycles, 10, 693-709.
DOI URL |
| [11] | Jiang XB (蒋雪彬), Li JM (李建民), Gao TY (高廷玉), Xu GS (徐桂生), She SQ (佘绍强) (2000). Spruce evolution and distribution. Forest Investigation Design (林业勘查设计), 113, 30-33. (in Chinese) |
| [12] |
Jobbácy EG, Jackson RB (2000). Global controls of forest line elevation in the northern and southern hemispheres. Global Ecology and Biogeography, 9, 253-268.
DOI URL |
| [13] | Kira T (1945). A New Classification of Climate in Eastern Asia As the Basis for Agricultural Geography. Horticultural Institute, Kyoto University, Kyoto. (in Japanese) |
| [14] | Kira T (1977). A climatological interpretation of Japanese vegetation zones. In: Miyawaki A, Tüxen R eds. Vegeta- tion Science and Environmental Protection. Maruzen, Tokyo. (in Japanese) |
| [15] |
Kirkpatrick JB, Hassall DC (1985). The vegetation and flora along an altitudinal transect through tropical forest at Mount Korobaba, Fiji. New Zealand Journal of Botany, 23, 33-46.
DOI URL |
| [16] |
Körner C (1998). A re-assessment of high elevation treeline positions and their explanation. Oecologia, 115, 445-459.
DOI URL PMID |
| [17] | Li WH (李文华), Chou PC (周沛村) (1979). The geographical distribution of the dark coniferous forest in Eurasian continent and its modelling. Natural Resources (自然资源), ( 1), 21-34. (in Chinese) |
| [18] |
Li WH, Chou PC (1984). The geographical distribution of the spruce-fir forest in China and its modelling. Mountain Research and Development, 4, 203-212.
DOI URL |
| [19] |
Liu ZL (刘增力), Fang JY (方精云), Piao SL (朴世龙) (2002). Geographical distribution of species in genera Abies, Picea and Larix in China. Acta Geographica Sinica (地理学报), 57, 577-586. (in Chinese with English abstract)
DOI URL |
| [20] | Mergen F, Burley J, Furnival GM (1965). Embryo and seedling development in Picea glauca (Moench) Voss after self-, cross-, and wind-pollination. Silvae Genetica, 14, 188-194. 26 |
| [21] |
Millar CI, Robert DW (2010). Distribution and climatic relationships of the American pika (Ochotona princeps) in the Sierra Nevada and Western Great Basin, U.S.A.; Periglacial Landforms as Refugia in Warming Climates. Arctic, Antarctic, and Alpine Research, 42, 76-88.
DOI URL |
| [22] | Ni J (倪健) (1996). Relationship between geographical distribution of Schima superba, its forest and climate in China. Journal of Plant Resources and Environment (植物资源与环境), 3, 28-34. (in Chinese with English abstract) |
| [23] |
Ni J, Sykes MT, Prentice IC, Cramer W (2000). Modelling the vegetation of China using the process-based equilibrium terrestrial biosphere model BIOME3 . Global Ecology and Biogeography, 9, 463-479.
DOI URL |
| [24] | Meunier C, Sirois L, Begin Y (2007). Climate and Picea mariana seed maturation relationships: a multi-scale perspective. Ecological Monographs, 77, 361-376. |
| [25] |
Ohsawa M (1990). An interpretation of latitudinal patterns of forest limits in south and east Asian mountains. Journal of Ecology, 78, 326-339.
DOI URL |
| [26] | Owens JN, Johnsen Ø, Dæhlen OG, Skrøppa T (2001). Potential effects of temperature on early reproductive development and progeny performance in Picea abies(L.) Karst. Scandinavian Journal of Forest Research, 16, 221-237. |
| [27] | Peng JF, Gou XH, Chen FH, Li JB, Liu PX, Zhang Y (2008). Altitudinal variability of climate-tree growth relationships along a consistent slope of Anyemaqen Mountains, northeastern Tibetan Plateau. Dendrochronologia, 26, 87-96. |
| [28] | Pollard DFW, Logan KT (1977). The effects of light intensity, photoperiod, soil moisture potential, and temperature on bud morphogenesis in Picea species. Canadian Journal of Forest Research, 7, 415-421. |
| [29] | Takahashi K (2003). Effects of climatic conditions on shoot elongation of alpine dwarf pine (Pinus pumila) at its upper and lower altitudinal limits in central Japan. Arctic, Antarctic, and Alpine Research, 35, 1-7. |
| [30] | Tchebakova NM, Parfenova EI, Soja AJ (2010). Potential climate-induced vegetation change in Siberia in the Twenty-First Century. Advances in Global Change Rese- arch, 40, 67-82. |
| [31] | Толмачев AИ (1954). The History and Development of Dark Coniferous Taiga. Publishing House of USSR Academy of Sciences, Moscow, Russia. (in Russian) |
| [32] | Tranquillini W (1979). Physiological Ecology of the Alpine Timberline: Tree Existence at High Altitudes with Special Reference to the European Alps. Springer-Verlag, New York. |
| [33] | Wang J (王建) (1990). Statistical analysis of temperatures of both the upper and lower bounds of of sub-alpine dark conifer forests in China. Scientia Geographica Sinica (地理科学), 2, 142-149, 191. (in Chinese with English abstract) |
| [34] | Woodward FI (1990). Climate and Plant Distribution. Cambridge University Press, Cambridge, UK. |
| [35] | Wu XH (吴锡浩) (1983). Temperature research of dark coniferous forest zone. Chinese Science Bulletin (科学通报), 28, 1451-1454. (in Chinese) |
| [36] | Wu Y, Liu Q, He H, Lin B, Yin HJ (2004). Effects of light and temperature on seed germination of Picea asperata and Betula albo-sinensis. The Journal of Applied Ecology, 15, 2229-2232. |
| [37] | Xiong Y (熊毅), Li QK (李庆逵) (1987). Chinese Soil (中国土壤) 2nd edn. Science Press, Beijing. 1987. (in Chinese) |
| [38] | Zhang Y (张芸), Kong ZC (孔昭宸), Yan S (阎顺), Yang ZJ (杨振京), Ni J (倪健) (2006). Late Holocene northern slope of Tianshan spruce forest line changes and paleo- environment. Chinese Science Bulletin (科学通报), 51, 1450-1458. (in Chinese) |
| [1] | WU Chen, CHEN Xin-Yi, LIU Yuan-Hao, HUANG Jin-Xue, XIONG De-Cheng. Effects of warming on fine root growth, mortality and turnover: a review [J]. Chin J Plant Ecol, 2023, 47(8): 1043-1054. |
| [2] | CHEN Xin-Yi, WU Chen, HUANG Jin-Xue, XIONG De-Cheng. Effects of warming on fine root phenology of forests: a review [J]. Chin J Plant Ecol, 2023, 47(11): 1471-1482. |
| [3] | CHENG Si-Qi, JIANG Feng, JIN Guang-Ze. Leaf economics spectrum of broadleaved seedlings and its relationship with defense traits in a temperate forest [J]. Chin J Plant Ecol, 2022, 46(6): 678-686. |
| [4] | SUN Wen-Tai, MA Ming. Response of soil physical degradation and fine root growth on long-term film mulching in apple orchards on Loess Plateau [J]. Chin J Plant Ecol, 2021, 45(9): 972-986. |
| [5] | DONG Lin-Lin, PU Xiao-Yan, ZHANG Lu-Lu, SONG Liang, LU Zhi-Yun, LI Su. Pressure-volume curve analysis of epiphytic lichens and its applicability in subtropical forests [J]. Chin J Plant Ecol, 2021, 45(3): 274-285. |
| [6] | DONG Zheng-Wu, ZHAO Ying, LEI Jia-Qiang, XI Yin-Qiao. Distribution pattern and influencing factors of soil salinity at Tamarix cones in the Taklimakan Desert [J]. Chin J Plant Ecol, 2018, 42(8): 873-884. |
| [7] | Yuan-Feng SUN, Hong-Wei WAN, Yu-Jin ZHAO, Shi-Ping CHEN, Yong-Fei BAI. Spatial patterns and drivers of root turnover in grassland ecosystems in China [J]. Chin J Plan Ecolo, 2018, 42(3): 337-348. |
| [8] | YAN Bao-Long, WANG Zhong-Wu, QU Zhi-Qiang, WANG Jing, HAN Guo-Dong. Effects of enclosure on carbon density of plant-soil system in typical steppe and desert steppe in Nei Mongol, China [J]. Chin J Plant Ecol, 2018, 42(3): 327-336. |
| [9] | ZHU Hong, ZHU Shu-Xia, LI Yong-Fu, YI Xian-Gui, DUAN Yi-Fan, WANG Xian-Rong. Leaf phenotypic variation in natural populations of Cerasus dielsiana [J]. Chin J Plant Ecol, 2018, 42(12): 1168-1178. |
| [10] | YAN Min, LI Zeng-Yuan, TIAN Xin, CHEN Er-Xue, GU Cheng-Yan. Remote sensing estimation of gross primary productivity and its response to climate change in the upstream of Heihe River Basin [J]. Chin J Plant Ecol, 2016, 40(1): 1-12. |
| [11] | YAN Xiao-Li, DAI Teng-Fei, JIA Li-Ming, DAI Li-Li, and XIN Fu-Mei. Responses of the fine root morphology and vertical distribution of Populus × euramericana ‘Guariento’ to the coupled effect of water and nitrogen [J]. Chin J Plan Ecolo, 2015, 39(8): 825-837. |
| [12] | WANG Xin-Qi,WANG Chuan-Kuan,HAN Yi. Effects of tree species on soil organic carbon density: A common garden experiment of five temperate tree species [J]. Chin J Plan Ecolo, 2015, 39(11): 1033-1043. |
| [13] | LIU Wan-De,SU Jian-Rong,LI Shuai-Feng,LANG Xue-Dong,ZHANG Zhi-Jun,HUANG Xiao-Bo. Leaf carbon, nitrogen and phosphorus stoichiometry at different growth stages in dominant tree species of a monsoon broad-leaved evergreen forest in Pu’er, Yunnan Province, China [J]. Chin J Plan Ecolo, 2015, 39(1): 52-62. |
| [14] | CHEN Tian-Yi, LIU Zeng-Hui, LOU An-Ru. Phenotypic variation in populations of Solanum rostratum in different distribution areas in China [J]. Chin J Plant Ecol, 2013, 37(4): 344-353. |
| [15] | WANG Min, SU Yong-Zhong, YANG Rong, YANG Xiao. Allocation patterns of above- and belowground biomass in desert grassland in the middle reaches of Heihe River, Gansu Province, China [J]. Chin J Plant Ecol, 2013, 37(3): 209-219. |
| Viewed | ||||||||||||||||||||||||||||||||||||||||||||||||||
|
Full text 4844
|
|
|||||||||||||||||||||||||||||||||||||||||||||||||
|
Abstract 3686
|
|
|||||||||||||||||||||||||||||||||||||||||||||||||
Copyright © 2022 Chinese Journal of Plant Ecology
Tel: 010-62836134, 62836138, E-mail: apes@ibcas.ac.cn, cjpe@ibcas.ac.cn