
植物生态学报 ›› 2010, Vol. 34 ›› Issue (6): 704-712.DOI: 10.3773/j.issn.1005-264x.2010.06.010
张玉森, 姚霞, 田永超, 曹卫星, 朱艳*( )
)
收稿日期:2009-07-07
接受日期:2010-03-30
出版日期:2010-07-07
发布日期:2010-06-01
通讯作者:
朱艳
作者简介:* E-mail: yanzhu@njau.edu.cn
ZHANG Yu-Sen, YAO Xia, TIAN Yong-Chao, CAO Wei-Xing, ZHU Yan*()
Received:2009-07-07
Accepted:2010-03-30
Online:2010-07-07
Published:2010-06-01
Contact:
ZHU Yan
摘要:
以水稻(Oryza sativa)新鲜叶片和干叶粉末两种状态的样品为研究对象, 基于近红外光谱(NIRS)技术, 应用偏最小二乘法(PLS)、主成分回归(PCR)和逐步多元回归(SMLR), 建立并评价了水稻叶片氮含量(NC)近红外光谱模型。结果表明, 基于PLS建立的模型表现最好, 鲜叶氮含量近红外光谱校正模型校正决定系数RC2为0.940, 校正标准误差RMSEC为0.226; 干叶粉末氮含量的近红外光谱校正模型RC2为0.977, RMSEC为0.136。模型的内部交叉验证分析表明, 预测鲜叶氮含量内部验证决定系数RCV2为0.866, 内部验证标准误差RMSECV为0.243; 预测干叶粉末氮含量RCV2为0.900, RMSECV为0.202。模型的外部验证分析表明, 预测水稻鲜叶氮含量的外部验证决定系数RV2大于0.800, 外部验证标准误差RMSEP小于0.500, 预测干叶粉末氮含量的RV2为0.944, RMSEP为0.142。说明, 近红外光谱分析技术与化学分析方法一致性较好, 且基于干叶粉末建立的近红外光谱预测模型的准确性和精确度较新鲜叶片高。
张玉森, 姚霞, 田永超, 曹卫星, 朱艳. 应用近红外光谱预测水稻叶片氮含量. 植物生态学报, 2010, 34(6): 704-712. DOI: 10.3773/j.issn.1005-264x.2010.06.010
ZHANG Yu-Sen, YAO Xia, TIAN Yong-Chao, CAO Wei-Xing, ZHU Yan. Estimating leaf nitrogen content with near infrared reflectance spectroscopy in rice. Chinese Journal of Plant Ecology, 2010, 34(6): 704-712. DOI: 10.3773/j.issn.1005-264x.2010.06.010
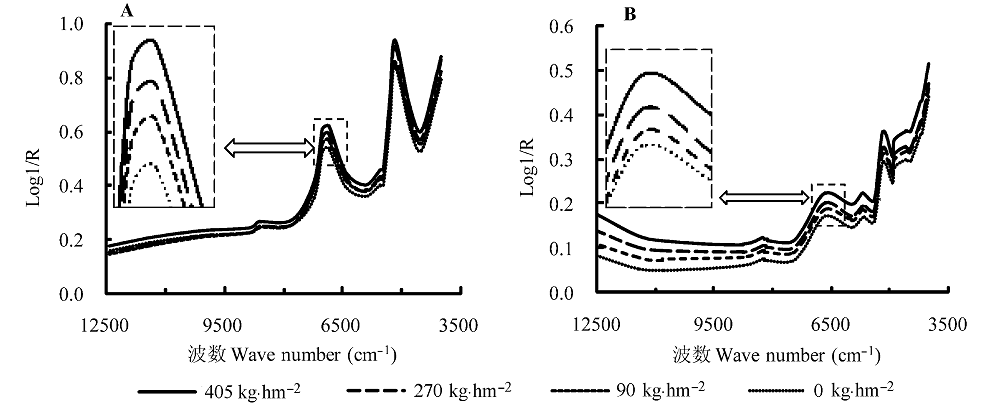
图1 不同施氮水平下‘9915’品种开花期叶片光谱Log1/R的变化模式。 A, 鲜叶; B, 干叶粉末。
Fig. 1 The Log1/R change patterns for ‘9915’ rice at anthesis under varied N rates. A, Fresh leaf; B, Leaf powder.

图2 N2处理下‘27123’品种叶片光谱Log1/R随生育期的变化动态。 A, 鲜叶; B, 干叶粉末。
Fig. 2 The Log1/R change patterns for ‘27123’ rice at N2 rate with growth development. A, Fresh leaf; B, Leaf powder.
| 叶片状态 Form of leaf | 校正集 Calibration set | 检验集 Validation set | |||||||
|---|---|---|---|---|---|---|---|---|---|
| 样品数 No. of sample | 变幅 Range (%) | 平均值 Mean (%) | 标准差 SD | 样品数 No. of sample | 变幅 Range (%) | 平均值 Mean (%) | 标准差SD | ||
| 鲜叶 Fresh leaf | 234 | 0.94-3.93 | 2.55 | 0.67 | 44 | 1.07-3.54 | 2.24 | 0.71 | |
| 干叶粉末 Leaf powder | 230 | 1.01-4.06 | 2.67 | 0.64 | 62 | 1.27-3.63 | 2.53 | 0.57 | |
表1 校正集和检验集氮含量的基本参数
Table 1 Basic parameters of nitrogen content (NC) in calibration set and validation set
| 叶片状态 Form of leaf | 校正集 Calibration set | 检验集 Validation set | |||||||
|---|---|---|---|---|---|---|---|---|---|
| 样品数 No. of sample | 变幅 Range (%) | 平均值 Mean (%) | 标准差 SD | 样品数 No. of sample | 变幅 Range (%) | 平均值 Mean (%) | 标准差SD | ||
| 鲜叶 Fresh leaf | 234 | 0.94-3.93 | 2.55 | 0.67 | 44 | 1.07-3.54 | 2.24 | 0.71 | |
| 干叶粉末 Leaf powder | 230 | 1.01-4.06 | 2.67 | 0.64 | 62 | 1.27-3.63 | 2.53 | 0.57 | |
| 叶片状态 Form of leaf | 化学计量学方法 Chemical metrology method | 氮含量 NC | ||
|---|---|---|---|---|
| RC2 | RMSEC | RMSEP | ||
| 鲜叶 Fresh leaf | 偏最小二乘法 PLS | 0.945 | 0.228 | 0.390 |
| 主成分回归 PCR | 0.472 | 0.568 | 0.979 | |
| 逐步多元回归 SMLR | 0.426 | 0.602 | 0.907 | |
| 叶片粉末 Leaf powder | 偏最小二乘法 PLS | 0.962 | 0.176 | 0.133 |
| 主成分回归 PCR | 0.821 | 0.365 | 0.415 | |
| 逐步多元回归 SMLR | 0.741 | 0.429 | 0.410 | |
表2 基于不同方法构建的氮含量预测模型表现比较
Table 2 Comparison of model performance for nitrogen content (NC) prediction by different methods
| 叶片状态 Form of leaf | 化学计量学方法 Chemical metrology method | 氮含量 NC | ||
|---|---|---|---|---|
| RC2 | RMSEC | RMSEP | ||
| 鲜叶 Fresh leaf | 偏最小二乘法 PLS | 0.945 | 0.228 | 0.390 |
| 主成分回归 PCR | 0.472 | 0.568 | 0.979 | |
| 逐步多元回归 SMLR | 0.426 | 0.602 | 0.907 | |
| 叶片粉末 Leaf powder | 偏最小二乘法 PLS | 0.962 | 0.176 | 0.133 |
| 主成分回归 PCR | 0.821 | 0.365 | 0.415 | |
| 逐步多元回归 SMLR | 0.741 | 0.429 | 0.410 | |
| 叶片状态 Form of leaf | 光谱预处理方法 Spectral-pretreatment method | 氮含量NC | ||
|---|---|---|---|---|
| RC2 | RMSEC | RMSEP | ||
| 鲜叶 Fresh leaf | 原始光谱 Original spectrum | 0.945 | 0.228 | 0.390 |
| 基线校正 Baseline correction | 0.945 | 0.218 | 0.290 | |
| 一阶导数 First derivative | 0.976 | 0.144 | 0.553 | |
| 二阶导数 Second derivative | 0.922 | 0.257 | 0.840 | |
| 多元散射校正 (multiplicative signal correction, MSC) | 0.927 | 0.248 | 0.297 | |
| Norris平滑 (norris derivative filter, NDF) | 0.944 | 0.219 | 0.421 | |
| First derivative + MSC | 0.972 | 0.155 | 0.471 | |
| First derivative + MSC + NDF | 0.931 | 0.284 | 0.411 | |
| 叶片粉末 Leaf powder | 原始光谱 Original spectrum | 0.962 | 0.176 | 0.133 |
| 基线校正 Baseline correction | 0.961 | 0.176 | 0.133 | |
| 一阶导数 First derivative | 0.975 | 0.143 | 0.208 | |
| 二阶导数 Second derivative | 0.954 | 0.151 | 0.565 | |
| 多元散射校正 MSC | 0.951 | 0.197 | 0.120 | |
| Norris平滑 NDF | 0.961 | 0.177 | 0.144 | |
| First derivative + MSC | 0.969 | 0.159 | 0.210 | |
| First derivative + MSC + NDF | 0.967 | 0.166 | 0.209 | |
表3 基于不同光谱预处理方法构建的氮含量测模型表现比较
Table 3 Comparison of model performance for (nitrogen content, NC) prediction with different spectral-pretreatment methods
| 叶片状态 Form of leaf | 光谱预处理方法 Spectral-pretreatment method | 氮含量NC | ||
|---|---|---|---|---|
| RC2 | RMSEC | RMSEP | ||
| 鲜叶 Fresh leaf | 原始光谱 Original spectrum | 0.945 | 0.228 | 0.390 |
| 基线校正 Baseline correction | 0.945 | 0.218 | 0.290 | |
| 一阶导数 First derivative | 0.976 | 0.144 | 0.553 | |
| 二阶导数 Second derivative | 0.922 | 0.257 | 0.840 | |
| 多元散射校正 (multiplicative signal correction, MSC) | 0.927 | 0.248 | 0.297 | |
| Norris平滑 (norris derivative filter, NDF) | 0.944 | 0.219 | 0.421 | |
| First derivative + MSC | 0.972 | 0.155 | 0.471 | |
| First derivative + MSC + NDF | 0.931 | 0.284 | 0.411 | |
| 叶片粉末 Leaf powder | 原始光谱 Original spectrum | 0.962 | 0.176 | 0.133 |
| 基线校正 Baseline correction | 0.961 | 0.176 | 0.133 | |
| 一阶导数 First derivative | 0.975 | 0.143 | 0.208 | |
| 二阶导数 Second derivative | 0.954 | 0.151 | 0.565 | |
| 多元散射校正 MSC | 0.951 | 0.197 | 0.120 | |
| Norris平滑 NDF | 0.961 | 0.177 | 0.144 | |
| First derivative + MSC | 0.969 | 0.159 | 0.210 | |
| First derivative + MSC + NDF | 0.967 | 0.166 | 0.209 | |
| 叶片状态 Form of leaf | 波数范围 Range of wave numbers (cm-1) | 氮含量NC | ||
|---|---|---|---|---|
| RC2 | RMSEC | RMSEP | ||
| 鲜叶 Fresh leaf | 12 500-4 000 | 0.945 | 0.218 | 0.390 |
| 8 000-4 500 | 0.940 | 0.226 | 0.442 | |
| 8 000-6 000 | 0.932 | 0.240 | 0.573 | |
| 6 700-5 500 | 0.935 | 0.236 | 0.398 | |
| 5 500-4 500 | 0.925 | 0.236 | 0.403 | |
| 叶片粉末 Leaf powder | 12 500-4 000 | 0.962 | 0.176 | 0.133 |
| 8 000-4 500 | 0.951 | 0.201 | 0.129 | |
| 8 000-6 000 | 0.946 | 0.207 | 0.210 | |
| 6 700-5 500 | 0.966 | 0.165 | 0.161 | |
| 5 500-4 500 | 0.944 | 0.210 | 0.141 | |
表4 基于不同光谱波段范围构建的氮含量预测模型表现 比较
Table 4 Performance comparisons of nitrogen content (NC) prediction models with different range of wave numbers
| 叶片状态 Form of leaf | 波数范围 Range of wave numbers (cm-1) | 氮含量NC | ||
|---|---|---|---|---|
| RC2 | RMSEC | RMSEP | ||
| 鲜叶 Fresh leaf | 12 500-4 000 | 0.945 | 0.218 | 0.390 |
| 8 000-4 500 | 0.940 | 0.226 | 0.442 | |
| 8 000-6 000 | 0.932 | 0.240 | 0.573 | |
| 6 700-5 500 | 0.935 | 0.236 | 0.398 | |
| 5 500-4 500 | 0.925 | 0.236 | 0.403 | |
| 叶片粉末 Leaf powder | 12 500-4 000 | 0.962 | 0.176 | 0.133 |
| 8 000-4 500 | 0.951 | 0.201 | 0.129 | |
| 8 000-6 000 | 0.946 | 0.207 | 0.210 | |
| 6 700-5 500 | 0.966 | 0.165 | 0.161 | |
| 5 500-4 500 | 0.944 | 0.210 | 0.141 | |
| 叶片状态 Form of leaf | 校正 Calibration | 内部检验 Cross-validation | 外部检验 Validation | |||||
|---|---|---|---|---|---|---|---|---|
| RC2 | RMSEC | RCV2 | RMSECV | RV2 | RMSEP | |||
| 鲜叶 Fresh leave | 0.940 | 0.226 | 0.866 | 0.243 | 0.840 | 0.477 | ||
| 干叶粉末 Leaf powder | 0.977 | 0.136 | 0.900 | 0.202 | 0.944 | 0.142 | ||
表5 近红外模型校正、内部交叉验证和外部验证结果参数
Table 5 The statistic parameters of calibration, cross-validation and validation for NIRs models
| 叶片状态 Form of leaf | 校正 Calibration | 内部检验 Cross-validation | 外部检验 Validation | |||||
|---|---|---|---|---|---|---|---|---|
| RC2 | RMSEC | RCV2 | RMSECV | RV2 | RMSEP | |||
| 鲜叶 Fresh leave | 0.940 | 0.226 | 0.866 | 0.243 | 0.840 | 0.477 | ||
| 干叶粉末 Leaf powder | 0.977 | 0.136 | 0.900 | 0.202 | 0.944 | 0.142 | ||
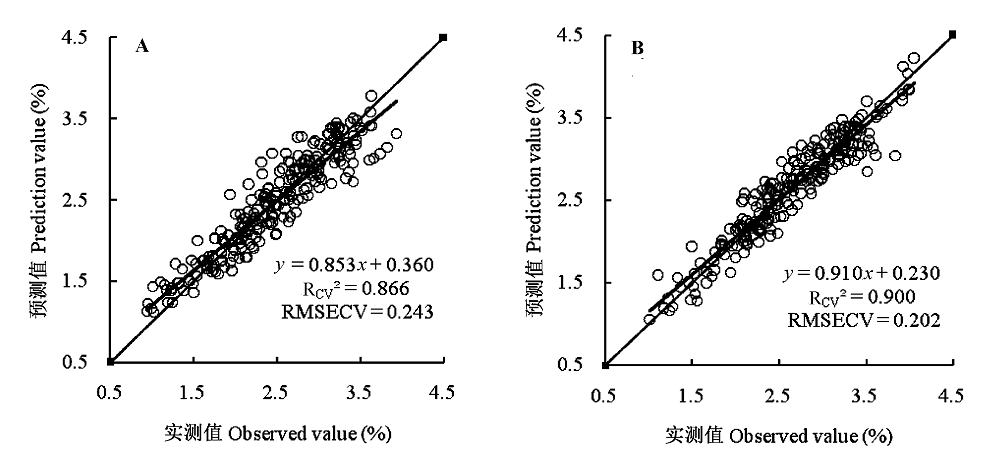
图3 近红外模型内部交叉验证真实值和预测值的1:1关系图。 A, 鲜叶氮含量; B, 粉末氮含量。
Fig. 3 The 1:1 relationship between the predicted and observed values in cross validation for NIR models. A, Fresh leaf nitrogen content; B, Leaf powder nitrogen content.
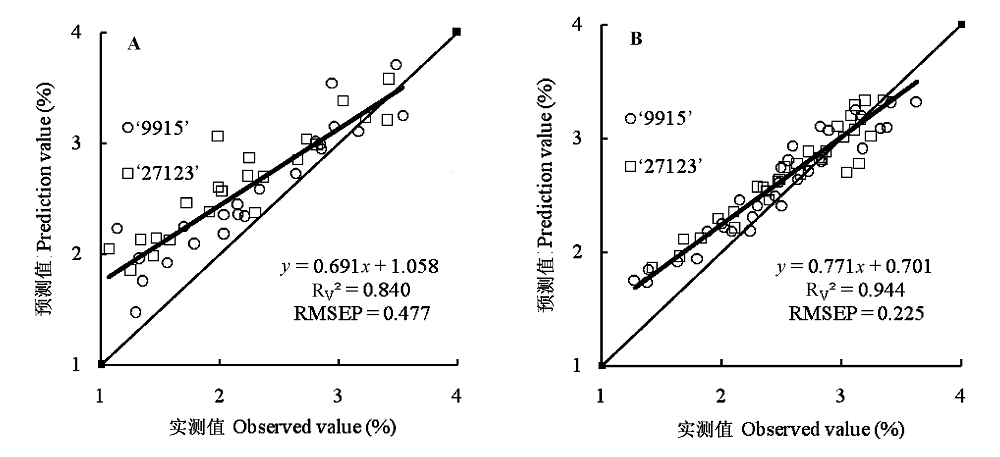
图4 近红外模型外部验证真实值和预测值的1:1关系图。 A, 鲜叶氮含量; B, 粉末氮含量。
Fig. 4 The 1:1 relationship between the predicted and observed values in validation for NIR models of rice. A, Fresh leaf nitrogen content; B, Leaf powder nitrogen content.
| [1] | Blanco M, Coello J, Montoliu I, Romero MA (2001). Orthogonal signal correction in near infrared calibration. Analytica Chimica Acta, 434, 125-132. |
| [2] | Curran PJ, Dungan JL, Peterson DL (2001). Estimating the foliar biochemical concentration of leaves with reflectance spectrometry: testing the kokaly and clark methodologies. Remote Sensing of Environment, 76, 349-359. |
| [3] | Cao G (曹干), Tan ZW (谭中文), Liang JN (梁计南), Long YH (龙永惠), Zhou XQ (周学秋) (2003). Mathematic models for analysis of quality components in sugarcane juice with Fourier transform near infrared spectroscopy. Scientia Agricultura Sinica (中国农业科学), 36, 254-258. (in Chinese with English abstract) |
| [4] | Delwiche SR, Mckenzie KS, Web BD (1996). Quality characteristics in rice by near-infrared reflectance analysis of whole-grain milled samples. Cereal Chemistry, 73, 257-263. |
| [5] | Fang LM (方利民), Lin M (林敏) (2008). A method of near infrared multi-component analysis based on independent component analysis and neural networks model. Chinese Journal of Analytical Chemistry (分析化学), 36, 815-818. (in Chinese with English abstract) |
| [6] | Feng W (冯伟), Yao Y (姚霞), Zhu Y (朱艳), Tian YC (田永超), Cao WX (曹卫星) (2008). Monitoring leaf nitrogen concentration by hyperspectral remote sensing in wheat. Journal of Triticeae Crops (麦类作物学报), 28, 851-860. (in Chinese with English abstract) |
| [7] | Fu XG, Yan GZ, Chen B, Li HB (2005). Application of wavelet transform to improve prediction precision of near infrared spectra. Journal of Food Engineering, 69, 461-466. |
| [8] | Jiang HY (蒋焕煜), Ying YB (应义斌) (2007). Measurement of chlorophyll content in pepper leaves by near infrared analysis. Spectroscopy and Spectral Analysis (光谱学与光谱分析), 27, 499-502. (in Chinese with English abstract) |
| [9] | Kokaly RF, Clark RN (1999). Spectroscopic determination of leaf biochemistry using band-depth analysis of absorption features and stepwise multiple linear regression. Remote Sensing of Environment, 67, 267-287. |
| [10] | Liu F (刘飞), Fang H (方慧), Zhang F (张帆), Jin ZL (金宗来), Zhou WJ (周伟军), He Y (何勇) (2009). Nondestructive determination of acetolactate synthase in oilseed rape leaves using visible and near infrared spectroscopy. Chinese Journal of Analytical Chemistry (分析化学), 37, 67-71. (in Chinese with English abstract) |
| [11] | Mroczyk WB, Michalski KM (1995). Quantitative and qualitative analyses in near infrared analysis of basic compounds in sugar beet leaf. Computers Chemistry, 19, 299-301. |
| [12] | Miryeong S, Franklin EB, Anna MM (2004). Near-infrared spectroscopy for determination of protein and amylose in rice powder through use of derivatives. Cereal Chemistry, 8, 341-344. |
| [13] |
Petisco C, Garcia-Criado B, Mediavilla S, de Aldana BRV, Zabalgogeazcoa I, Garcia-Ciudad A (2006). Near-infrared reflectance spectroscopy as a fast and non-destructive tool to predict foliar organic constituents of several woody species. Analytical and Bioanalytical Chemistry, 386, 1823-1833.
DOI URL PMID |
| [14] |
Read JJ, Tarpley L, Mckinion JM (2002). Narrow-waveband reflectance rations for remote estimation of nitrogen status in cotton. Journal of Environmental Quality, 31, 1442-1452.
DOI URL PMID |
| [15] | Stone ML, Solie JB, Raun WB (1996). Use of spectral radiance for correcting in season fertilizer nitrogen deficiencies in winter wheat. Transaction of the ASAE, 39, 1623-1631. |
| [16] | Takebe M, Yoneyama T, Inada K (1990). Spectral reflectance ratio of rice canopy for estimating crop nitrogen status. Plant and Soil, 122, 295-297. |
| [17] | Tarpley L, Reddy KR, Gretchen FSC (2000). Reflectance indices with precision and accuracy in predicting cotton leaf nitrogen concentration. Crop Science, 40, 1814-1819. |
| [18] | Tang YL (唐延林), Wang JH (王纪华), Huang JF (黄敬峰), Wang RC (王人潮), He QX (何秋霞) (2003). Variation law of hypersprctral data and chlorophyll and carotenoid for rice in mature process. Transactions of CSAE (农业工程学报), 19, 167-173. (in Chinese with English abstract) |
| [19] | Wang JH (王纪华), Huang WJ (黄文江), Lao CL (劳彩莲), Zhang LD (张录达), Luo CB (罗长兵), Wang T (王韬), Liu LY (刘良云), Song XY (宋晓宇), Ma ZH (马智宏) (2007). Inversion of winter wheat foliage vertical distribution based on canopy reflected spectrum by partial least squares regression method. Spectroscopy and Spectral Analysis (光谱学与光谱分析), 27, 319-322. (in Chinese with English abstract) |
| [20] | Windham W, Lyon BG, Champagne ET (1997). Prediction of cooked rice texture quality using near-infrared reflectance spectroscopy. Cereal Chemistry, 74, 626-632. |
| [21] | Xue LH (薛利红), Cao WX (曹卫星), Luo WH (罗卫红), Jiang D (姜东), Meng YL (孟亚利), Zhu Y (朱艳) (2003). Diagnosis of nitrogen status in rice leaves with the canopy spectral reflectance. Scientia Agricultura Sinica (中国农业科学), 37, 807-812. (in Chinese with English abstract) |
| [22] | Xue LH (薛利红), Cao WX (曹卫星), Luo WH (罗卫红), Zhang X (张宪) (2004). Correlation between leaf nitrogen status and canopy spectral characteristics in wheat. Acta Phytoecologica Sinica (植物生态学报), 28, 172-177. (in Chinese with English abstract) |
| [23] | Yan YL (严衍禄) (2005). Theory and Application of Near Infrared Spectroscopy (近红外光谱分析基础与应用). China Light Industry Press, Beijing. (in Chinese) |
| [24] | Yang XH (杨小红), Guo YQ (郭玉秋), Fu Y (傅旸), Hu JY (胡洁云), Chai YC (柴宇超), Zhang YR (张义荣), Li JS (李建生) (2009). Measuring fatty acid concentration in maize grain by near-infrared reflectance spectroscopy. Spectroscopy and Spectral Analysis (光谱学与光谱分析), 29, 106-109. (in Chinese with English abstract) |
| [25] | Zhang LD (张录达), Shen XN (沈晓南), Zhao LL (赵龙莲), Li HJ (李军会), Zhang JP (张建平), Xie WY (谢雯燕), Shu RX (束茹欣) (2000). Application of principal component-all possible regression in quantitative analysis of flue-cured tobacco and wheat using near-infrared spectroscopy. Chinese Journal of Analytical Chemistry (分析化学), 28, 23-26. (in Chinese with English abstract) |
| [26] | Zhang X (张霞), Liu LY (刘良云), Zhao CJ (赵春江), Zhang B (张兵) (2003). Estimating wheat nitrogen concentration with high spectral resolution image. Journal of Remote Sensing (遥感学报), 7, 176-181. (in Chinese with English abstract) |
| [27] | Zhu Y (朱艳), Li YX (李映雪), Zhou DQ (周冬琴), Tian YC (田永超), Yao Y (姚霞), Cao WX (曹卫星) (2006). Quantitative relationship between leaf nitrogen concentration and canopy reflectance spectra in rice and wheat. Acta Ecologica Sinica (生态学报), 26, 3463-3469. (in Chinese with English abstract) |
| [28] | Zhou DQ (周冬琴), Tian YC (田永超), Yao Y (姚霞), Zhu Y (朱艳), Cao WX (曹卫星) (2008). Quantitative relationships between leaf total nitrogen concentration and canopy reflectance spectra of rice. Chinese Journal of Applied Ecology (应用生态学报), 19, 337-344. (in Chinese with English abstract) |
| [1] | 罗源林, 马文红, 张芯毓, 苏闯, 史亚博, 赵利清. 内蒙古锦鸡儿属植物地理替代分布种的功能性状沿环境梯度的变化[J]. 植物生态学报, 2022, 46(11): 1364-1375. |
| [2] | 武运涛, 杨森, 王欣, 黄俊胜, 王斌, 刘卫星, 刘玲莉. 草地土壤有机质不同组分氮库对长期氮添加的响应[J]. 植物生态学报, 2021, 45(7): 790-798. |
| [3] | 于青含, 金光泽, 刘志理. 植株大小、枝龄和环境共同驱动红松枝性状的变异[J]. 植物生态学报, 2020, 44(9): 939-950. |
| [4] | 梅孔灿, 程蕾, 张秋芳, 林开淼, 周嘉聪, 曾泉鑫, 吴玥, 徐建国, 周锦容, 陈岳民. 不同植物来源可溶性有机质对亚热带森林土壤酶活性的影响[J]. 植物生态学报, 2020, 44(12): 1273-1284. |
| [5] | 张静, 刘耘华, 盛建东, 柴强, 李瑞霞, 赵丹. 新疆北部草地典型灌木的碳氮特征[J]. 植物生态学报, 2018, 42(3): 307-316. |
| [6] | 颉洪涛, 虞木奎, 成向荣. 光照强度变化对5种耐阴植物氮磷养分含量、分配以及限制状况的影响[J]. 植物生态学报, 2017, 41(5): 559-569. |
| [7] | 司晓林, 王文银, 高小刚, 徐当会. 氮硅添加对高寒草甸垂穗披碱草叶片全氮含量及净光合速率的影响[J]. 植物生态学报, 2016, 40(12): 1238-1244. |
| [8] | 王乔姝怡, 郑成洋, 张歆阳, 曾发旭, 邢娟. 氮添加对武夷山亚热带常绿阔叶林植物叶片氮磷化学计量特征的影响[J]. 植物生态学报, 2016, 40(11): 1124-1135. |
| [9] | 王常顺, 汪诗平. 植物叶片性状对气候变化的响应研究进展[J]. 植物生态学报, 2015, 39(2): 206-216. |
| [10] | 杨浩, 罗亚晨. 糙隐子草功能性状对氮添加和干旱的响应[J]. 植物生态学报, 2015, 39(1): 32-42. |
| [11] | 闫霜,张黎,景元书,何洪林,于贵瑞. 植物叶片最大羧化速率与叶氮含量关系的变异性[J]. 植物生态学报, 2014, 38(6): 640-652. |
| [12] | 沙依然·外力,李秉柏,张佳华,杨沈斌. 水稻模拟模型在高温敏感性研究中的应用[J]. 植物生态学报, 2014, 38(5): 515-528. |
| [13] | 张林, 阎恩荣, 魏海霞, 刘新圣, 沈维. 藏东南色季拉山林线过渡带7种灌木植物的叶氮回收潜力[J]. 植物生态学报, 2014, 38(12): 1325-1332. |
| [14] | 邹媛媛, 刘琳, 刘洋, 赵亮, 邓启云, 吴俊, 庄文, 宋未. 不同水稻品种种子固有细菌群落的多样性[J]. 植物生态学报, 2012, 36(8): 880-890. |
| [15] | 隗溟,廖学群,李冬霞,段海龙. 水稻分蘖节位生产力比较[J]. 植物生态学报, 2012, 36(4): 324-332. |
| 阅读次数 | ||||||
|
全文 |
|
|||||
|
摘要 |
|
|||||
Copyright © 2022 版权所有 《植物生态学报》编辑部
地址: 北京香山南辛村20号, 邮编: 100093
Tel.: 010-62836134, 62836138; Fax: 010-82599431; E-mail: apes@ibcas.ac.cn, cjpe@ibcas.ac.cn
备案号: 京ICP备16067583号-19