
Chin J Plant Ecol ›› 2021, Vol. 45 ›› Issue (1): 23-37.DOI: 10.17521/cjpe.2020.0048
Special Issue: 生物多样性
• Research Articles • Previous Articles Next Articles
LI Song-Song1, WANG Ning-Xin1, ZHENG Wei1,2,*( ), ZHU Ya-Qiong1, WANG Xiang1, MA Jun1, ZHU Jin-Zhong1,2
Received:2020-02-24
Accepted:2020-09-27
Online:2021-01-20
Published:2020-12-09
Contact:
ZHENG Wei
Supported by:LI Song-Song, WANG Ning-Xin, ZHENG Wei, ZHU Ya-Qiong, WANG Xiang, MA Jun, ZHU Jin-Zhong. Comparison of transgressive overyielding effect and plant diversity effects of annual and perennial legume-grass mixtures[J]. Chin J Plant Ecol, 2021, 45(1): 23-37.
Add to citation manager EndNote|Ris|BibTeX
URL: https://www.plant-ecology.com/EN/10.17521/cjpe.2020.0048
| 处理编号 Treatment number | 混播比例 Mixed ratio | 豆科牧草 Legume | 禾本科牧草 Grass | ||
|---|---|---|---|---|---|
| 物种 Species | 分播量 Sowing quantity (kg·hm-2) | 物种 Species | 分播量 Sowing quantity (kg·hm-2) | ||
| AM2-1 | 6:4 | 救荒野豌豆 Vicia sativa | 72.00 | 燕麦 Avena sativa | 60.00 |
| AM2-2 | 5:5 | 救荒野豌豆 V. sativa | 60.00 | 燕麦 A. sativa | 75.00 |
| AM2-3 | 4:6 | 救荒野豌豆 V. sativa | 48.00 | 燕麦 A. sativa | 90.00 |
| PM2-A1 | 6:4 | 驴食草 Onobrychis viciaefolia | 36.00 | 无芒雀麦 Bromus inermis | 12.00 |
| PM2-A2 | 5:5 | 驴食草 O. viciifolia | 30.00 | 无芒雀麦 B. inermis | 15.00 |
| PM2-A3 | 4:6 | 驴食草 O. viciifolia | 24.00 | 无芒雀麦 B. inermis | 18.00 |
| PM2-B1 | 6:4 | 驴食草 O. viciifolia | 36.00 | 猫尾草 Phleum pratense | 6.00 |
| PM2-B2 | 5:5 | 驴食草 O. viciifolia | 30.00 | 猫尾草P. pratense | 7.50 |
| PM2-B3 | 4:6 | 驴食草 O. viciifolia | 24.00 | 猫尾草P. pratense | 9.00 |
| PM2-C1 | 6:4 | 红车轴草 Trifolium pratense | 9.00 | 无芒雀麦 B. inermis | 12.00 |
| PM2-C2 | 5:5 | 红车轴草 T. pratense | 7.50 | 无芒雀麦 B. inermis | 15.00 |
| PM2-C3 | 4:6 | 红车轴草 T. pratense | 6.00 | 无芒雀麦 B. inermis | 18.00 |
| PM2-D1 | 6:4 | 红车轴草 T. pratense | 9.00 | 猫尾草 P. pratense | 6.00 |
| PM2-D2 | 5:5 | 红车轴草 T. pratense | 7.50 | 猫尾草P. pratense | 7.50 |
| PM2-D3 | 4:6 | 红车轴草 T. pratense | 6.00 | 猫尾草P. pratense | 9.00 |
| PM4-1 | 6:4 | 驴食草 O. viciifolia | 18.00 | 无芒雀麦B. inermis | 6.00 |
| 红车轴草 T. pratense | 4.50 | 猫尾草P. pratense | 3.00 | ||
| PM4-2 | 5:5 | 驴食草O. viciifolia | 4.50 | 无芒雀麦B. inermis | 7.50 |
| 红车轴草T. pratense | 3.75 | 猫尾草P. pratense | 3.75 | ||
| PM4-3 | 4:6 | 驴食草O. viciifolia | 12.00 | 无芒雀麦B. inermis | 9.00 |
| 红车轴草T. pratense | 3.00 | 猫尾草P. pratense | 4.50 | ||
| PM6-1 | 6:4 | 驴食草O. viciifolia | 12.00 | 无芒雀麦B. inermis | 4.00 |
| 红车轴草 T. pratense | 3.00 | 猫尾草P. pretense | 2.00 | ||
| 紫花苜蓿 Medicage sativa | 3.00 | 鸭茅 Dactylis glomerata | 2.00 | ||
| PM6-2 | 5:5 | 驴食草O. viciifolia | 10.00 | 无芒雀麦B. inermis | 5.00 |
| 红车轴草 T. pratense | 2.00 | 猫尾草P. pretense | 2.50 | ||
| 紫花苜蓿M. sativa | 2.00 | 鸭茅D. glomerata | 2.50 | ||
| PM6-3 | 4:6 | 驴食草O. viciifolia | 8.00 | 无芒雀麦B. inermis | 6.00 |
| 红车轴草 T. pratense | 2.50 | 猫尾草P. pretense | 3.00 | ||
| 紫花苜蓿 M. sativa | 2.50 | 鸭茅D. glomerata | 3.00 | ||
Table 1 Mixed sowing ratios and sowing quantity of legume-grass mixtures
| 处理编号 Treatment number | 混播比例 Mixed ratio | 豆科牧草 Legume | 禾本科牧草 Grass | ||
|---|---|---|---|---|---|
| 物种 Species | 分播量 Sowing quantity (kg·hm-2) | 物种 Species | 分播量 Sowing quantity (kg·hm-2) | ||
| AM2-1 | 6:4 | 救荒野豌豆 Vicia sativa | 72.00 | 燕麦 Avena sativa | 60.00 |
| AM2-2 | 5:5 | 救荒野豌豆 V. sativa | 60.00 | 燕麦 A. sativa | 75.00 |
| AM2-3 | 4:6 | 救荒野豌豆 V. sativa | 48.00 | 燕麦 A. sativa | 90.00 |
| PM2-A1 | 6:4 | 驴食草 Onobrychis viciaefolia | 36.00 | 无芒雀麦 Bromus inermis | 12.00 |
| PM2-A2 | 5:5 | 驴食草 O. viciifolia | 30.00 | 无芒雀麦 B. inermis | 15.00 |
| PM2-A3 | 4:6 | 驴食草 O. viciifolia | 24.00 | 无芒雀麦 B. inermis | 18.00 |
| PM2-B1 | 6:4 | 驴食草 O. viciifolia | 36.00 | 猫尾草 Phleum pratense | 6.00 |
| PM2-B2 | 5:5 | 驴食草 O. viciifolia | 30.00 | 猫尾草P. pratense | 7.50 |
| PM2-B3 | 4:6 | 驴食草 O. viciifolia | 24.00 | 猫尾草P. pratense | 9.00 |
| PM2-C1 | 6:4 | 红车轴草 Trifolium pratense | 9.00 | 无芒雀麦 B. inermis | 12.00 |
| PM2-C2 | 5:5 | 红车轴草 T. pratense | 7.50 | 无芒雀麦 B. inermis | 15.00 |
| PM2-C3 | 4:6 | 红车轴草 T. pratense | 6.00 | 无芒雀麦 B. inermis | 18.00 |
| PM2-D1 | 6:4 | 红车轴草 T. pratense | 9.00 | 猫尾草 P. pratense | 6.00 |
| PM2-D2 | 5:5 | 红车轴草 T. pratense | 7.50 | 猫尾草P. pratense | 7.50 |
| PM2-D3 | 4:6 | 红车轴草 T. pratense | 6.00 | 猫尾草P. pratense | 9.00 |
| PM4-1 | 6:4 | 驴食草 O. viciifolia | 18.00 | 无芒雀麦B. inermis | 6.00 |
| 红车轴草 T. pratense | 4.50 | 猫尾草P. pratense | 3.00 | ||
| PM4-2 | 5:5 | 驴食草O. viciifolia | 4.50 | 无芒雀麦B. inermis | 7.50 |
| 红车轴草T. pratense | 3.75 | 猫尾草P. pratense | 3.75 | ||
| PM4-3 | 4:6 | 驴食草O. viciifolia | 12.00 | 无芒雀麦B. inermis | 9.00 |
| 红车轴草T. pratense | 3.00 | 猫尾草P. pratense | 4.50 | ||
| PM6-1 | 6:4 | 驴食草O. viciifolia | 12.00 | 无芒雀麦B. inermis | 4.00 |
| 红车轴草 T. pratense | 3.00 | 猫尾草P. pretense | 2.00 | ||
| 紫花苜蓿 Medicage sativa | 3.00 | 鸭茅 Dactylis glomerata | 2.00 | ||
| PM6-2 | 5:5 | 驴食草O. viciifolia | 10.00 | 无芒雀麦B. inermis | 5.00 |
| 红车轴草 T. pratense | 2.00 | 猫尾草P. pretense | 2.50 | ||
| 紫花苜蓿M. sativa | 2.00 | 鸭茅D. glomerata | 2.50 | ||
| PM6-3 | 4:6 | 驴食草O. viciifolia | 8.00 | 无芒雀麦B. inermis | 6.00 |
| 红车轴草 T. pratense | 2.50 | 猫尾草P. pretense | 3.00 | ||
| 紫花苜蓿 M. sativa | 2.50 | 鸭茅D. glomerata | 3.00 | ||
| 年份 Year | 处理编号 Treatment number | 产量 Yield (kg·m-2) | 超产 Overyielding (kg·m-2) | 超产效应1 Transgressive overyielding effect 1 (OV1) | 超产效应2 Transgressive overyielding effect 2 (OV2) | 豆科产量比 Legume proportion (%) | |||
|---|---|---|---|---|---|---|---|---|---|
| 混播处理 Mixed treatment | 单播对照 Monoculture control | 与单播相比 Difference by monoculture control | 与PM2相比 Difference by PM2 | 与PM4相比 Difference by PM4 | |||||
| 2013 | AM2 | 1.26 ± 0.11 a | 1.22 ± 0.37 | 0.04 | 0.07 ± 0.14 b | 0.08 ± 0.05 b | 12.33 ± 1.52 c | ||
| PM2-A | 0.70 ± 0.06 b | 0.39 ± 0.12 | 0.28 | 0.77 ± 0.13 a | 0.92 ± 0.24 a | 21.67 ± 5.40 b | |||
| PM2-B | 0.68 ± 0.12 b | 0.40 ± 0.15 | 0.28 | 0.15 ± 0.09 b | 0.62 ± 0.21 ab | 27.03 ± 17.02 b | |||
| PM2-C | 0.28 ± 0.07 c | 0.22 ± 0.06 | 0.06 | -0.09 ± 0.04 c | -0.31 ± 0.17 c | 34.00 ± 5.53 b | |||
| PM2-D | 0.28 ± 0.05 c | 0.24 ± 0.13 | 0.04 | -0.13 ± 0.11 c | 0.08 ± 0.03 b | 81.67 ± 3.47 a | |||
| PM4 | 0.73 ± 0.07 b | 0.31 ± 0.06 | 0.42 | 0.42 | 0.86 ± 0.15 a | 1.54 ± 0.35 a | 29.33 ± 3.79 b | ||
| PM6 | 0.63 ± 0.10 b | 0.28 ± 0.10 | 0.35 | 0.32 | 0.32 | 0.62 ± 0.15 a | 1.30 ± 0.24 a | 32.33 ± 18.13 b | |
| 2014 | AM2 | 0.75 ± 0.05 a | 0.79 ± 0.33 | -0.04 | -0.15 ± 0.06 c | -0.06 ± 0.06 cd | 32.33 ± 1.53 b | ||
| PM2-A | 0.33 ± 0.01 bc | 0.14 ± 0.02 | 0.19 | 0.55 ± 0.17 b | 0.19 ± 0.06 b | 10.00 ± 9.64 d | |||
| PM2-B | 0.26 ± 0.04 cd | 0.09 ± 0.03 | 0.17 | 0.23 ± 0.13 b | 0.07 ± 0.03 cd | 21.33 ± 11.59 c | |||
| PM2-C | 0.19 ± 0.01 d | 0.16 ± 0.11 | 0.03 | -0.02 ± 0.01 c | -0.15 ± 0.10 d | 15.67 ± 5.13 cd | |||
| PM2-D | 0.15 ± 0.03 d | 0.10 ± 0.07 | 0.05 | 0.30 ± 0.12 b | 0.10 ± 0.02 b | 52.33 ± 15.57 a | |||
| PM4 | 0.41 ± 0.03 b | 0.13 ± 0.06 | 0.28 | 0.18 | 1.01 ± 0.17 a | 0.36 ± 0.03 a | 13.67 ± 6.43 cd | ||
| PM6 | 0.35 ± 0.04 bc | 0.32 ± 0.21 | 0.03 | 0.12 | 0.22 | -0.76 ± 0.02 d | -0.07 ± 0.04 cd | 12.00 ± 6.56 cd | |
| 2015 | AM2 | 0.36 ± 0.03 a | 0.21 ± 0.10 | 0.16 | 0.17 ± 0.14 a | 0.80 ± 0.17 a | 29.33 ± 8.33 c | ||
| PM2-A | 0.25 ± 0.04 c | 0.27 ± 0.07 | -0.02 | 0.01 ± 0.09 ab | 0.64 ± 0.18 ab | 4.33 ± 1.15 d | |||
| PM2-B | 0.29 ± 0.02 b | 0.39 ± 0.16 | -0.10 | -0.04 ± 0.06 b | 0.25 ± 0.11 b | 10.67 ± 0.58 d | |||
| PM2-C | 0.33 ± 0.03 ab | 0.37 ± 0.15 | -0.04 | -0.30 ± 0.12 d | -0.08 ± 0.04 c | 8.33 ± 2.31 d | |||
| PM2-D | 0.36 ± 0.01 a | 0.31 ± 0.13 | 0.05 | -0.06 ± 0.13 b | -0.18 ± 0.11 c | 80.67 ± 4.04 a | |||
| PM4 | 0.25 ± 0.03 b | 0.87 ± 0.29 | -0.62 | -0.08 | -0.31 ± 0.06 d | -0.07 ± 0.06 c | 42.26 ± 4.62 b | ||
| PM6 | 0.31 ± 0.01 b | 0.27 ± 0.14 | 0.04 | -0.02 | -0.56 | -0.21 ± 0.06 bc | 0.29 ± 0.06 bc | 21.67 ± 2.31 c | |
| 3年平均值 Three years average | AM2 | 0.80 ± 0.25 a | 0.74 ± 0.34 | 0.06 | 0.03 ± 0.07 b | 0.27 ± 0.10 a | 21.33 ± 2.08 b | ||
| PM2-A | 0.46 ± 0.10 b | 0.27 ± 0.08 | 0.19 | 0.44 ± 0.10 a | 0.58 ± 0.12 a | 21.00 ± 10.44 b | |||
| PM2-B | 0.43 ± 0.07 b | 0.29 ± 0.17 | 0.14 | 0.10 ± 0.23 ab | 0.15 ± 0.20 ab | 23.33 ± 10.41 b | |||
| PM2-C | 0.26 ± 0.03 c | 0.25 ± 0.12 | 0.01 | 0.04 ± 0.10 b | -0.20 ± 0.10 b | 19.33 ± 1.53 b | |||
| PM2-D | 0.23 ± 0.05 c | 0.22 ± 0.09 | 0.01 | -0.01 ± 0.08 b | -0.21 ± 0.24 b | 74.67 ± 4.04 a | |||
| PM4 | 0.48 ± 0.01 b | 0.44 ± 0.12 | 0.04 | 0.22 | 0.52 ± 0.14 a | 0.61 ± 0.18 a | 29.67 ± 2.89 b | ||
| PM6 | 0.46 ± 0.04 b | 0.29 ± 0.13 | 0.17 | 0.12 | 0.02 | -0.09 ± 0.12 b | 0.51 ± 0.14 a | 28.00 ± 11.53 b | |
Table 2 Comparison of forage yield, overyielding and legume yield proportion under different mixed patterns (mean ± SE)
| 年份 Year | 处理编号 Treatment number | 产量 Yield (kg·m-2) | 超产 Overyielding (kg·m-2) | 超产效应1 Transgressive overyielding effect 1 (OV1) | 超产效应2 Transgressive overyielding effect 2 (OV2) | 豆科产量比 Legume proportion (%) | |||
|---|---|---|---|---|---|---|---|---|---|
| 混播处理 Mixed treatment | 单播对照 Monoculture control | 与单播相比 Difference by monoculture control | 与PM2相比 Difference by PM2 | 与PM4相比 Difference by PM4 | |||||
| 2013 | AM2 | 1.26 ± 0.11 a | 1.22 ± 0.37 | 0.04 | 0.07 ± 0.14 b | 0.08 ± 0.05 b | 12.33 ± 1.52 c | ||
| PM2-A | 0.70 ± 0.06 b | 0.39 ± 0.12 | 0.28 | 0.77 ± 0.13 a | 0.92 ± 0.24 a | 21.67 ± 5.40 b | |||
| PM2-B | 0.68 ± 0.12 b | 0.40 ± 0.15 | 0.28 | 0.15 ± 0.09 b | 0.62 ± 0.21 ab | 27.03 ± 17.02 b | |||
| PM2-C | 0.28 ± 0.07 c | 0.22 ± 0.06 | 0.06 | -0.09 ± 0.04 c | -0.31 ± 0.17 c | 34.00 ± 5.53 b | |||
| PM2-D | 0.28 ± 0.05 c | 0.24 ± 0.13 | 0.04 | -0.13 ± 0.11 c | 0.08 ± 0.03 b | 81.67 ± 3.47 a | |||
| PM4 | 0.73 ± 0.07 b | 0.31 ± 0.06 | 0.42 | 0.42 | 0.86 ± 0.15 a | 1.54 ± 0.35 a | 29.33 ± 3.79 b | ||
| PM6 | 0.63 ± 0.10 b | 0.28 ± 0.10 | 0.35 | 0.32 | 0.32 | 0.62 ± 0.15 a | 1.30 ± 0.24 a | 32.33 ± 18.13 b | |
| 2014 | AM2 | 0.75 ± 0.05 a | 0.79 ± 0.33 | -0.04 | -0.15 ± 0.06 c | -0.06 ± 0.06 cd | 32.33 ± 1.53 b | ||
| PM2-A | 0.33 ± 0.01 bc | 0.14 ± 0.02 | 0.19 | 0.55 ± 0.17 b | 0.19 ± 0.06 b | 10.00 ± 9.64 d | |||
| PM2-B | 0.26 ± 0.04 cd | 0.09 ± 0.03 | 0.17 | 0.23 ± 0.13 b | 0.07 ± 0.03 cd | 21.33 ± 11.59 c | |||
| PM2-C | 0.19 ± 0.01 d | 0.16 ± 0.11 | 0.03 | -0.02 ± 0.01 c | -0.15 ± 0.10 d | 15.67 ± 5.13 cd | |||
| PM2-D | 0.15 ± 0.03 d | 0.10 ± 0.07 | 0.05 | 0.30 ± 0.12 b | 0.10 ± 0.02 b | 52.33 ± 15.57 a | |||
| PM4 | 0.41 ± 0.03 b | 0.13 ± 0.06 | 0.28 | 0.18 | 1.01 ± 0.17 a | 0.36 ± 0.03 a | 13.67 ± 6.43 cd | ||
| PM6 | 0.35 ± 0.04 bc | 0.32 ± 0.21 | 0.03 | 0.12 | 0.22 | -0.76 ± 0.02 d | -0.07 ± 0.04 cd | 12.00 ± 6.56 cd | |
| 2015 | AM2 | 0.36 ± 0.03 a | 0.21 ± 0.10 | 0.16 | 0.17 ± 0.14 a | 0.80 ± 0.17 a | 29.33 ± 8.33 c | ||
| PM2-A | 0.25 ± 0.04 c | 0.27 ± 0.07 | -0.02 | 0.01 ± 0.09 ab | 0.64 ± 0.18 ab | 4.33 ± 1.15 d | |||
| PM2-B | 0.29 ± 0.02 b | 0.39 ± 0.16 | -0.10 | -0.04 ± 0.06 b | 0.25 ± 0.11 b | 10.67 ± 0.58 d | |||
| PM2-C | 0.33 ± 0.03 ab | 0.37 ± 0.15 | -0.04 | -0.30 ± 0.12 d | -0.08 ± 0.04 c | 8.33 ± 2.31 d | |||
| PM2-D | 0.36 ± 0.01 a | 0.31 ± 0.13 | 0.05 | -0.06 ± 0.13 b | -0.18 ± 0.11 c | 80.67 ± 4.04 a | |||
| PM4 | 0.25 ± 0.03 b | 0.87 ± 0.29 | -0.62 | -0.08 | -0.31 ± 0.06 d | -0.07 ± 0.06 c | 42.26 ± 4.62 b | ||
| PM6 | 0.31 ± 0.01 b | 0.27 ± 0.14 | 0.04 | -0.02 | -0.56 | -0.21 ± 0.06 bc | 0.29 ± 0.06 bc | 21.67 ± 2.31 c | |
| 3年平均值 Three years average | AM2 | 0.80 ± 0.25 a | 0.74 ± 0.34 | 0.06 | 0.03 ± 0.07 b | 0.27 ± 0.10 a | 21.33 ± 2.08 b | ||
| PM2-A | 0.46 ± 0.10 b | 0.27 ± 0.08 | 0.19 | 0.44 ± 0.10 a | 0.58 ± 0.12 a | 21.00 ± 10.44 b | |||
| PM2-B | 0.43 ± 0.07 b | 0.29 ± 0.17 | 0.14 | 0.10 ± 0.23 ab | 0.15 ± 0.20 ab | 23.33 ± 10.41 b | |||
| PM2-C | 0.26 ± 0.03 c | 0.25 ± 0.12 | 0.01 | 0.04 ± 0.10 b | -0.20 ± 0.10 b | 19.33 ± 1.53 b | |||
| PM2-D | 0.23 ± 0.05 c | 0.22 ± 0.09 | 0.01 | -0.01 ± 0.08 b | -0.21 ± 0.24 b | 74.67 ± 4.04 a | |||
| PM4 | 0.48 ± 0.01 b | 0.44 ± 0.12 | 0.04 | 0.22 | 0.52 ± 0.14 a | 0.61 ± 0.18 a | 29.67 ± 2.89 b | ||
| PM6 | 0.46 ± 0.04 b | 0.29 ± 0.13 | 0.17 | 0.12 | 0.02 | -0.09 ± 0.12 b | 0.51 ± 0.14 a | 28.00 ± 11.53 b | |
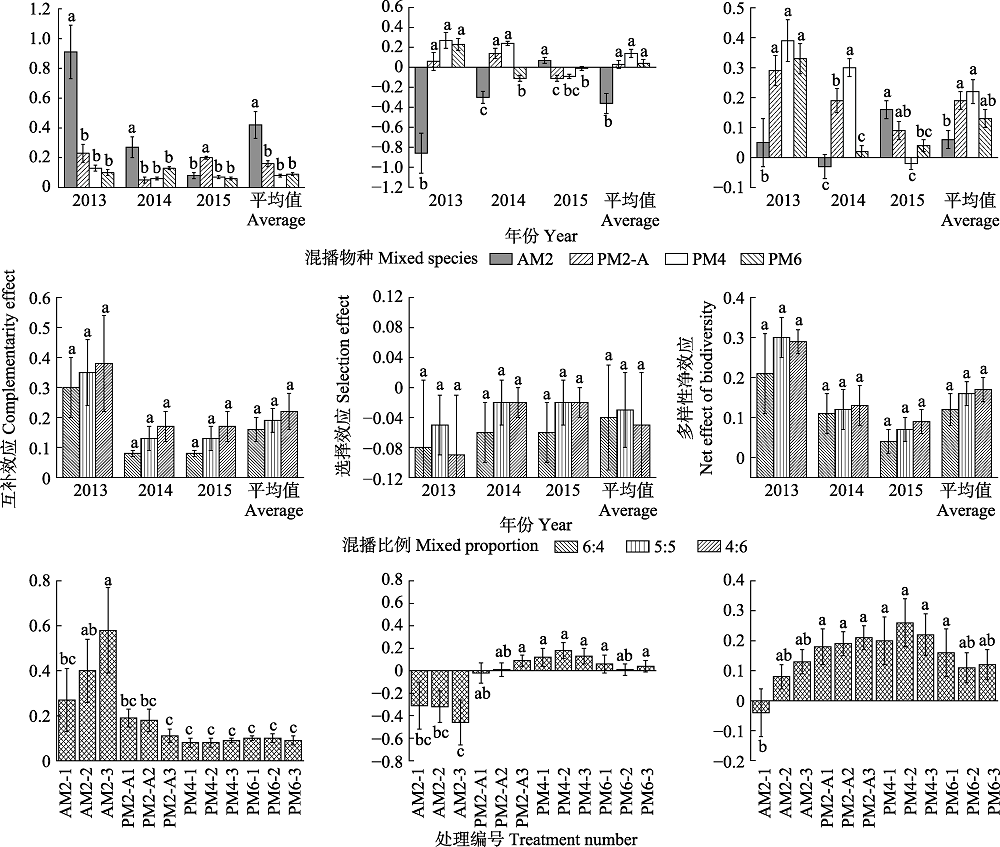
Fig. 1 Comparison of complementarities effect, selection effect and net effects of biodiversity under different mixed species, mixed proportion and treatments (three years average ± SE). Different lowercase letters within the same year indicate significant difference (p < 0.05). Mixed species and treatment number see Table 1.
| 参数 Parameter | 变异来源 Source of variation | 自由度 df | 均方根 Mean square | F | p |
|---|---|---|---|---|---|
| 产量 Yield | 混播物种 Mixed species | 6 | 0.852 | 12.756 | 0.000** |
| 混播比例 Mixed proportion | 2 | 0.005 | 0.080 | 0.923 | |
| 年份 Year | 2 | 18.983 | 96.640 | 0.000** | |
| 混播物种×混播比例 Mixed species × Mixed proportion | 9 | 0.017 | 0.262 | 0.994 | |
| 混播物种×年份 Mixed species × Year | 9 | 2.746 | 13.978 | 0.000** | |
| 混播比例×年份 Mixed proportion ×Year | 4 | 0.013 | 0.068 | 0.991 | |
| 混播物种×混播比例×年份 Mixed species × Mixed proportion × Year | 12 | 0.046 | 0.235 | 0.996 | |
| 误差 Error | 171 | 0.067 | |||
| 总计 Total | 192 | ||||
| 互补效应 Complementary effect | 混播物种 Mixed species | 3 | 0.665 | 10.564 | 0.000** |
| 混播比例 Mixed proportion | 2 | 0.030 | 0.473 | 0.625 | |
| 年份 Year | 2 | 0.285 | 20.190 | 0.000** | |
| 混播物种×混播比例 Mixed species × Mixed proportion | 6 | 0.070 | 1.106 | 0.365 | |
| 混播物种×年份 Mixed species × Year | 6 | 0.130 | 9.221 | 0.000** | |
| 混播比例×年份 Mixed proportion × Year | 4 | 0.018 | 1.258 | 0.295 | |
| 混播物种×混播比例×年份 Mixed species × Mixed proportion × Year | 12 | 0.006 | 0.445 | 0.939 | |
| 误差 Error | 96 | 0.063 | |||
| 总计 Total | 108 | ||||
| 选择效应 Selection effect | 混播物种 Mixed species | 3 | 1.324 | 12.407 | 0.000** |
| 混播比例 Mixed proportion | 2 | 0.004 | 0.035 | 0.966 | |
| 年份 Year | 2 | 0.337 | 1.148 | 0.323 | |
| 混播物种×混播比例 Mixed species × Mixed proportion | 6 | 0.033 | 0.313 | 0.929 | |
| 混播物种×年份 Mixed species × Year | 6 | 5.210 | 17.742 | 0.000** | |
| 混播比例×年份 Mixed proportion × Year | 4 | 0.134 | 0.455 | 0.768 | |
| 混播物种×混播比例×年份 Mixed species × Mixed proportion × Year | 12 | 0.137 | 0.468 | 0.927 | |
| 误差 Error | 96 | 0.107 | |||
| 总计 Total | 108 | ||||
| 多样性净效应 Net effect of biodiversity | 混播物种 Mixed species | 3 | 0.143 | 4.168 | 0.008** |
| 混播比例 Mixed proportion | 2 | 0.022 | 0.630 | 0.535 | |
| 年份 Year | 2 | 1.405 | 15.086 | 0.000** | |
| 混播物种×混播比例 Mixed species × Mixed proportion | 6 | 0.022 | 0.637 | 0.701 | |
| 混播物种×年份 Mixed species × Year | 6 | 2.450 | 26.300 | 0.000** | |
| 混播比例×年份 Mixed proportion × Year | 4 | 0.007 | 0.077 | 0.989 | |
| 混播物种×混播比例×年份 Mixed species × Mixed proportion × Year | 12 | 0.058 | 0.625 | 0.815 | |
| 误差 Error | 96 | 0.034 | |||
| 总计 Total | 108 |
Table 3 Two-way ANOVA analysis of mixed species and mixed proportion
| 参数 Parameter | 变异来源 Source of variation | 自由度 df | 均方根 Mean square | F | p |
|---|---|---|---|---|---|
| 产量 Yield | 混播物种 Mixed species | 6 | 0.852 | 12.756 | 0.000** |
| 混播比例 Mixed proportion | 2 | 0.005 | 0.080 | 0.923 | |
| 年份 Year | 2 | 18.983 | 96.640 | 0.000** | |
| 混播物种×混播比例 Mixed species × Mixed proportion | 9 | 0.017 | 0.262 | 0.994 | |
| 混播物种×年份 Mixed species × Year | 9 | 2.746 | 13.978 | 0.000** | |
| 混播比例×年份 Mixed proportion ×Year | 4 | 0.013 | 0.068 | 0.991 | |
| 混播物种×混播比例×年份 Mixed species × Mixed proportion × Year | 12 | 0.046 | 0.235 | 0.996 | |
| 误差 Error | 171 | 0.067 | |||
| 总计 Total | 192 | ||||
| 互补效应 Complementary effect | 混播物种 Mixed species | 3 | 0.665 | 10.564 | 0.000** |
| 混播比例 Mixed proportion | 2 | 0.030 | 0.473 | 0.625 | |
| 年份 Year | 2 | 0.285 | 20.190 | 0.000** | |
| 混播物种×混播比例 Mixed species × Mixed proportion | 6 | 0.070 | 1.106 | 0.365 | |
| 混播物种×年份 Mixed species × Year | 6 | 0.130 | 9.221 | 0.000** | |
| 混播比例×年份 Mixed proportion × Year | 4 | 0.018 | 1.258 | 0.295 | |
| 混播物种×混播比例×年份 Mixed species × Mixed proportion × Year | 12 | 0.006 | 0.445 | 0.939 | |
| 误差 Error | 96 | 0.063 | |||
| 总计 Total | 108 | ||||
| 选择效应 Selection effect | 混播物种 Mixed species | 3 | 1.324 | 12.407 | 0.000** |
| 混播比例 Mixed proportion | 2 | 0.004 | 0.035 | 0.966 | |
| 年份 Year | 2 | 0.337 | 1.148 | 0.323 | |
| 混播物种×混播比例 Mixed species × Mixed proportion | 6 | 0.033 | 0.313 | 0.929 | |
| 混播物种×年份 Mixed species × Year | 6 | 5.210 | 17.742 | 0.000** | |
| 混播比例×年份 Mixed proportion × Year | 4 | 0.134 | 0.455 | 0.768 | |
| 混播物种×混播比例×年份 Mixed species × Mixed proportion × Year | 12 | 0.137 | 0.468 | 0.927 | |
| 误差 Error | 96 | 0.107 | |||
| 总计 Total | 108 | ||||
| 多样性净效应 Net effect of biodiversity | 混播物种 Mixed species | 3 | 0.143 | 4.168 | 0.008** |
| 混播比例 Mixed proportion | 2 | 0.022 | 0.630 | 0.535 | |
| 年份 Year | 2 | 1.405 | 15.086 | 0.000** | |
| 混播物种×混播比例 Mixed species × Mixed proportion | 6 | 0.022 | 0.637 | 0.701 | |
| 混播物种×年份 Mixed species × Year | 6 | 2.450 | 26.300 | 0.000** | |
| 混播比例×年份 Mixed proportion × Year | 4 | 0.007 | 0.077 | 0.989 | |
| 混播物种×混播比例×年份 Mixed species × Mixed proportion × Year | 12 | 0.058 | 0.625 | 0.815 | |
| 误差 Error | 96 | 0.034 | |||
| 总计 Total | 108 |
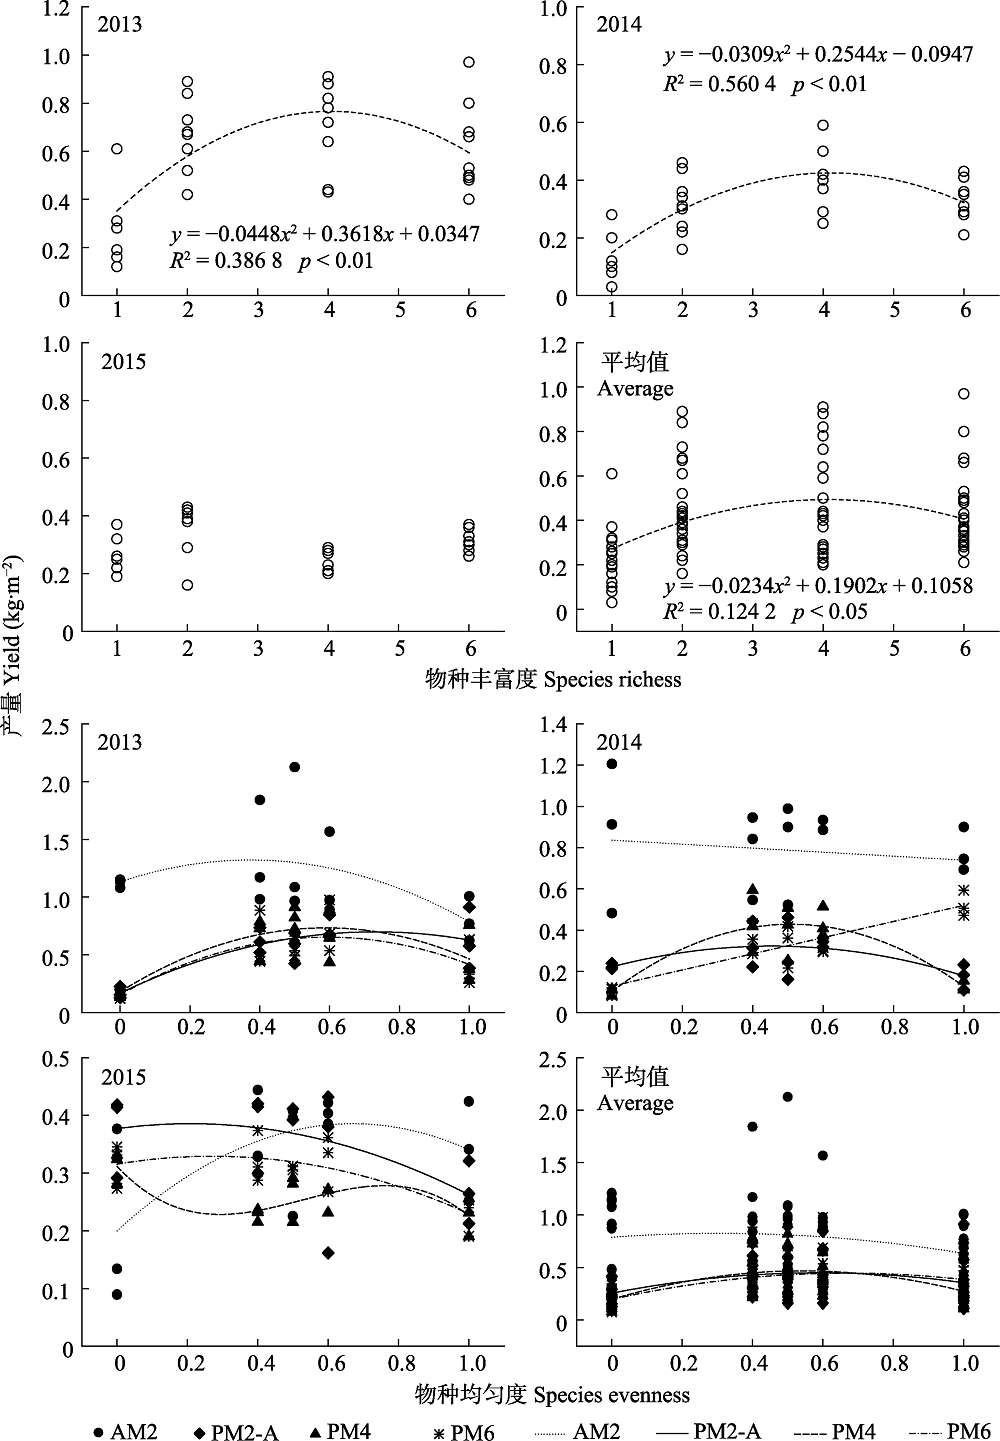
Fig. 2 Relationship between species richness, evenness and forage yield. AM2, PM2-A, PM4, PM6 see Table 1.
| 年份 Year | 处理编号 Treatment number | 拟合曲线 Fitting curve | R2 | p |
|---|---|---|---|---|
| 2013 | AM2 | y = -1.3682x2 + 1.0218x + 1.1065 | 0.282 5 | >0.05 |
| PM2-A | y = -1.0161x2 + 1.4789x + 0.1569 | 0.688 1 | <0.01 | |
| PM4 | y = -1.6284x2 + 1.8951x + 0.1763 | 0.667 3 | <0.01 | |
| PM6 | y = -1.3567x2 + 1.624x + 0.1476 | 0.601 7 | <0.01 | |
| 2014 | AM2 | y = -0.0333x + 0.7827 | 0.002 7 | >0.05 |
| PM2-A | y = -0.6501x2+ 0.5594x + 0.2012 | 0.416 8 | <0.05 | |
| PM4 | y = -1.2421x2 + 1.2671x + 0.0981 | 0.777 1 | <0.01 | |
| PM6 | y = 0.3897x + 0.1251 | 0.769 9 | <0.01 | |
| 2015 | AM2 | y = -0.6322x2 + 0.8796x + 0.0887 | 0.782 0 | <0.01 |
| PM2-A | y = -0.2212x2 + 0.1058x + 0.3687 | 0.307 4 | <0.05 | |
| PM4 | y = -1.125x3 + 1.7721x2 - 0.7338x + 0.3097 | 0.603 1 | <0.01 | |
| PM6 | y = -0.1765x2 + 0.0925x + 0.3122 | 0.535 4 | <0.01 | |
| 3年平均值 Three years average | AM2 | y = -0.7384x2 + 0.7472x + 0.6114 | 0.042 2 | >0.05 |
| PM2-A | y = -0.5024x2 + 0.6473x + 0.2434 | 0.164 4 | <0.05 | |
| PM4 | y = -0.9286x2 + 1.0004x + 0.1930 | 0.258 7 | <0.05 | |
| PM6 | y = -0.5301x2 + 0.7211x + 0.1922 | 0.237 5 | <0.05 |
Table 4 Function fitting models between species evenness and forage yield
| 年份 Year | 处理编号 Treatment number | 拟合曲线 Fitting curve | R2 | p |
|---|---|---|---|---|
| 2013 | AM2 | y = -1.3682x2 + 1.0218x + 1.1065 | 0.282 5 | >0.05 |
| PM2-A | y = -1.0161x2 + 1.4789x + 0.1569 | 0.688 1 | <0.01 | |
| PM4 | y = -1.6284x2 + 1.8951x + 0.1763 | 0.667 3 | <0.01 | |
| PM6 | y = -1.3567x2 + 1.624x + 0.1476 | 0.601 7 | <0.01 | |
| 2014 | AM2 | y = -0.0333x + 0.7827 | 0.002 7 | >0.05 |
| PM2-A | y = -0.6501x2+ 0.5594x + 0.2012 | 0.416 8 | <0.05 | |
| PM4 | y = -1.2421x2 + 1.2671x + 0.0981 | 0.777 1 | <0.01 | |
| PM6 | y = 0.3897x + 0.1251 | 0.769 9 | <0.01 | |
| 2015 | AM2 | y = -0.6322x2 + 0.8796x + 0.0887 | 0.782 0 | <0.01 |
| PM2-A | y = -0.2212x2 + 0.1058x + 0.3687 | 0.307 4 | <0.05 | |
| PM4 | y = -1.125x3 + 1.7721x2 - 0.7338x + 0.3097 | 0.603 1 | <0.01 | |
| PM6 | y = -0.1765x2 + 0.0925x + 0.3122 | 0.535 4 | <0.01 | |
| 3年平均值 Three years average | AM2 | y = -0.7384x2 + 0.7472x + 0.6114 | 0.042 2 | >0.05 |
| PM2-A | y = -0.5024x2 + 0.6473x + 0.2434 | 0.164 4 | <0.05 | |
| PM4 | y = -0.9286x2 + 1.0004x + 0.1930 | 0.258 7 | <0.05 | |
| PM6 | y = -0.5301x2 + 0.7211x + 0.1922 | 0.237 5 | <0.05 |
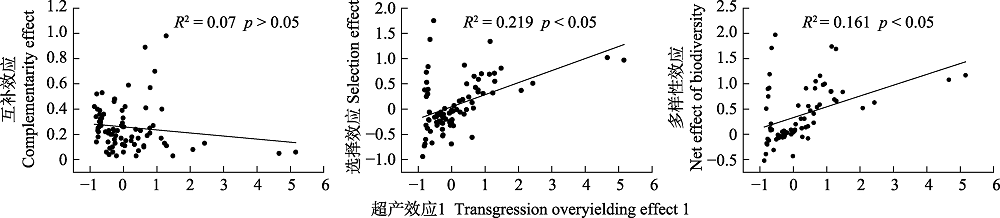
Fig. 3 Relationship between transgressive overyielding effect 1 and complementary effect, selection effect and net effect of biodiversity.
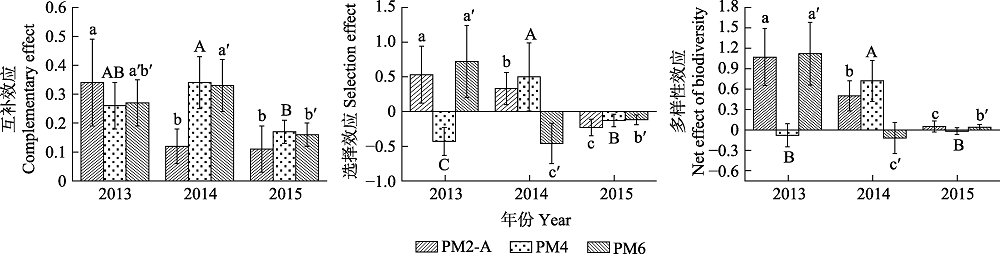
Fig. 4 Change of the complementary effect, selection effect and net effect of biodiversity with establishment years (mean ± SE). Different lowercase letters, uppercase letters, and a′, b′ and c′ symbols respectively indicate significant differences of PM2-A, PM4 and PM6 treatments from 2013 to 2015 (p < 0.05). PM2-A、PM4、PM6 see Table 1.
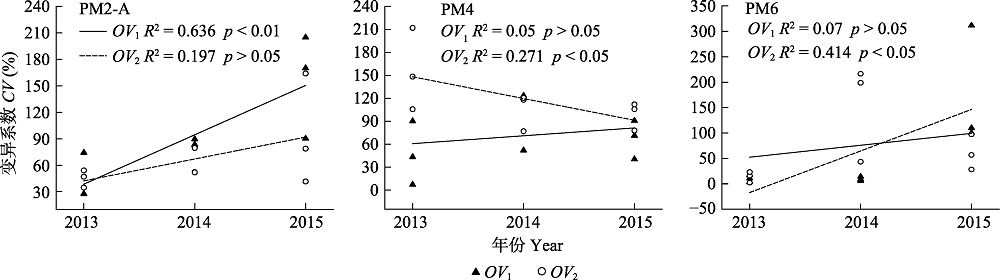
Fig. 5 Stability analysis of transgressive overyieding effect (OV) for PM2-A, PM4 and PM6. CV, coefficient of variation. PM2-A, PM4, PM6 see Table 1.
| [1] |
Atwater DZ, Callaway RM (2015). Testing the mechanisms of diversity-dependent overyielding in a grass species. Ecology, 96,3332-3342.
PMID |
| [2] |
Beckage B, Gross LJ (2006). Overyielding and species diversity: What should we expect? New Phytologist, 172,140-148.
PMID |
| [3] |
Cardinale BJ, Wright JP, Cadotte MW, Carroll IT, Hector A, Srivastava DS, Loreau M, Weis JJ (2007). Impacts of plant diversity on biomass production increase through time because of species complementarity. Proceedings of the National Academy of Sciences of the United States of America, 104,18123-18128.
PMID |
| [4] | Chang SH, Hou FJ, Yu YW, Nan ZB (2004). Vegetation and soil characteristic of three forage legume pastures on the Loess Plateau. Acta Ecologica Sinica, 24,932-937. |
| [ 常生华, 侯扶江, 于应文, 南志标 (2004). 黄土丘陵沟壑区三种豆科人工草地的植被与土壤特征. 生态学报, 24,932-937.] | |
| [5] | Chen C, Zhu ZH, Li YN, Yao TH, Pan SY, Wei XH, Kong BB, Du JL (2016). Effects of interspecific trait dissimilarity and species evenness on the relationship between species diversity and functional diversity in an alpine meadow. Acta Ecologica Sinica, 36,661-674. |
| [ 陈超, 朱志红, 李英年, 姚天华, 潘石玉, 卫欣华, 孔彬彬, 杜家丽 (2016). 高寒草甸种间性状差异和物种均匀度对物种多样性与功能多样性关系的影响. 生态学报, 36,661-674.] | |
| [6] |
Chen N, Zhang YJ, Zhu JT, Li JX, Liu YJ, Zu JX, Cong N, Huang K, Wang L (2018). Nonlinear responses of productivity and diversity of alpine meadow communities to degradation. Chinese Journal of Plant Ecology, 42,50-65.
DOI URL PMID |
|
[ 陈宁, 张扬建, 朱军涛, 李军祥, 刘瑶杰, 俎佳星, 丛楠, 黄珂, 王荔 (2018). 高寒草甸退化过程中群落生产力和物种多样性的非线性响应机制研究. 植物生态学报, 42,50-65.]
DOI PMID |
|
| [7] | Chen YX, Liu J, Chen XP, Zhang CC, Huang W, Tang YQ, Xu KW (2013). Dry matter accumulation, yield and nitrogen use efficiency of crops rotation and intercropping systems in Sichuan. Journal of China Agricultural University, 18(6),68-79. |
| [ 陈远学, 刘静, 陈新平, 张朝春, 黄蔚, 唐义琴, 徐开未 (2013). 四川轮套作体系的干物质积累、产量及氮素利用效率研究. 中国农业大学学报, 18(6),68-79.] | |
| [8] |
Cox S, Peel MD, Creech JE, Waldron BL, Eun JS, Zobell DR, Miller LR, Snyder DL (2017). Forage production of grass-legume binary mixtures on Intermountain Western USA irrigated pastures. Crop Science, 57,1742-1753.
DOI URL |
| [9] |
Dai W, Zhang R, Du ZB, Wang F (2009). Soil fertility and species identity control community productivity in an experimental plant community in an area of subalpine meadow. Chinese Journal of Plant Ecology, 33,45-52.
PMID |
|
[ 代巍, 张荣, 独占彪, 王璠 (2009). 土壤肥力和物种属性决定亚高寒草甸实验群落的生产力. 植物生态学报, 33,45-52.]
DOI PMID |
|
| [10] |
de Mazancourt C, Isbell F, Larocque A, Berendse F, de Luca E, Grace JB, Haegeman B, Polley HW, Roscher C, Schmid B, Tilman D, van Ruijven J, Weigelt A, Wilsey BJ, Loreau M (2013). Predicting ecosystem stability from community composition and biodiversity. Ecology Letters, 16,617-625.
DOI PMID |
| [11] |
Finn JA, Kirwan L, Connonlly J, Sebastià MT, Helgadottir A, Baadshaug OH, Belanger G, Black A, Brophy C, Collins RP, Cop J, Dalmannsdóttir S, Delgodo I, Elgersma A, Fothergill M, et al. (2013). Ecosystem function enhanced by combining four functional types of plant species in intensively managed grassland mixtures: a 3-year continental scale field experiment. Journal of Applied Ecology, 50,365-375.
DOI URL |
| [12] |
Frankow-Lindberg BE, Halling M, Höglind M, Forkman J (2009). Yield and stability of yield of single- and multi-clover grass-clover swards in two contrasting temperate environments. Grass and Forage Science, 64,236-245.
DOI URL |
| [13] |
Grime JP (1998). Benefits of plant diversity to ecosystems: immediate, filter and founder effects. Journal of Ecology, 86,902-910.
DOI URL |
| [14] |
Hector A, Hautier Y, Saner P, Wacker L, Bagchi R, Joshi J, Scherer-Lorenzen M, Spehn EM, Bazeley-White E, Weilenmann M, Caldeira MC, Dimitrakopoulos PG, Finn JA, Huss-Danell K, Jumpponen A, et al. (2010). General stabilizing effects of plant diversity on grassland productivity through population asynchrony and overyielding. Ecology, 91,2213-2220.
PMID |
| [15] |
Hector A, Schmid B, Beierkuhnlein C, Caldeira MC, Diemer M, Dimitrakopoulos PG, Finn JA, Freitas H, Giller PS, Good J, Harris R, Högberg P, Huss-Danell K, Joshi J, Jumpponen A, et al. (1999). Plant diversity and productivity experiments in European grasslands. Science, 286,1123-1127.
DOI URL |
| [16] |
Hendriks M, Mommer L, de Caluwe H, Smit-Tiekstra AE, van der Putten WH, de Kroon H (2013). Independent variations of plant and soil mixtures reveal soil feedback effects on plant community overyielding. Journal of Ecology, 101,287-297.
DOI URL |
| [17] |
Hooper DU, Chapin III FS, Ewel JJ, Hector A, Inchausti P, Lavorel S, Lawton JH, Lodge DM, Loreau M, Naeem S, Schmid B, Setälä H, Symstad AJ, Vandermeer J, Wardle DA (2005). Effects of biodiversity on ecosystem functioning: a consensus of current knowledge. Ecological Monographs, 75,3-35.
DOI URL |
| [18] | Hu ZZ, Dong SK, Long RJ (2001). Evaluation of ecological efficiency of mixed pastures with perennial grasses in alpine region of China//China Association of Agricultural Science Societies, Chinese Grassland Society. Grassland Science Outlook of 21 Century—Proceedings of International Prataculture (Grassland) Congress. 482-487. |
| [ 胡自治, 董世魁, 龙瑞军 (2001). 高寒地区多年生禾草混播草地生产——生态效益评价//中国农学会, 中国草原学会. 21世纪草业科学展望——国际草业(草地)学术大会论文集.482-487.] | |
| [19] |
Huston MA, Aarssen LW, Austin MP, Cade BS, Fridley JD, Garnier E, Grime JP, Hodgson J, Lauenroth WK, Thompson K, Vandermeer JH, Wardle DA (2000). No consistent effect of plant diversity on productivity. Science, 289, 1255a. DOI: 10.1126/science.289.5483.1255a.
DOI |
| [20] |
Isbell FI, Polley HW, Wilsey BJ (2009). Biodiversity, productivity and the temporal stability of productivity: patterns and processes. Ecology Letters, 12,443-451.
DOI URL |
| [21] | Jiang XL, Li WQ, Yue J, Hao M, Zhang WG, Liu YJ, Li F (2010). Effects of available soil space on the diversity- productivity relationship of species. Journal of Lanzhou University(Natural Sciences), 46(6),62-67. |
| [ 江小雷, 李伟绮, 岳静, 郝敏, 张卫国, 刘允佳, 李飞 (2010). 土壤有效空间对物种多样性-生产力关系的影响. 兰州大学学报(自然科学版), 46(6),62-67.] | |
| [22] |
Jiang XL, Zhang WG, Duan ZH (2005). Effects of complementarity on diversity-productivity relationship. Acta Phytoecologica Sinica, 29,523-529.
PMID |
|
[ 江小雷, 张卫国, 段争虎 (2005). 资源互补效应对多样性-生产力关系的影响. 植物生态学报, 29,523-529.]
DOI PMID |
|
| [23] | Jiao NY, Ning TY, Zhao C, Wang Y, Shi ZQ, Hou LT, Fu GZ, Jiang XD, Li ZJ (2006). Characters of photosynthesis in intercropping system of maize and peanut. Acta Agronomica Sinica, 32,917-923. |
| [ 焦念元, 宁堂原, 赵春, 王芸, 史忠强, 侯连涛, 付国占, 江晓东, 李增嘉 (2006). 玉米花生间作复合体系光合特性的研究. 作物学报, 32,917-923.] | |
| [24] |
Küchenmeister F, Küchenmeister K, Wrage N, Kayser M, Isselstein J (2012). Yield and yield stability in mixtures of productive grassland species: Does species number or functional group composition matter? Grassland Science, 58,94-100.
DOI URL |
| [25] | Li A, Zhang M, Du GZ (2012). Impacts of species composition, richness, sowing density, and soil nutrients on the complementary effect of plant communities. Chinese Journal of Ecology, 31,2443-2448. |
| [ 李昂, 张鸣, 杜国祯 (2012). 物种组成、丰富度、播种密度和土壤养分对群落补偿效应的影响. 生态学杂志, 31,2443-2448.] | |
| [26] |
Li CJ, Li YY, Yu CB, Sun JH, Christie P, An M, Zhang FS, Li L (2011). Crop nitrogen use and soil mineral nitrogen accumulation under different crop combinations and patterns of strip intercropping in northwest China. Plant and Soil, 342,221-231.
DOI URL |
| [27] | Li L, Li SM, Sun JH, Zhou LL, Bao XG, Zhang HG, Zhang FS (2007). Diversity enhances agricultural productivity via rhizosphere phosphorus facilitation on phosphorus- deficient soils. Proceedings of the National Academy of Sciences of the United States of America, 104,11192-11196. |
| [28] |
Li L, Tilman D, Lambers H, Zhang FS (2014). Plant diversity and overyielding: insights from belowground facilitation of intercropping in agriculture. New Phytologist, 203,63-69.
DOI URL |
| [29] |
Li L, Zhang F, Li X, Christie P, Sun J, Yang S, Tang C (2003). Interspecific facilitation of nutrient uptake by intercropped maize and faba bean. Nutrient Cycling in Agroecosystems, 65,61-71.
DOI URL |
| [30] |
Lithourgidis AS, Vasilakoglou IB, Dhima KV, Dordas CA, Yiakoulaki MD (2006). Forage yield and quality of common vetch mixtures with oat and triticale in two seeding ratios. Field Crops Research, 99,106-113.
DOI URL |
| [31] | Liu WH, Zhang YJ, Shi SL, Sun J, Wei XX (2017). Effect of variety, fertilization and mixture sowing on oat biomass allocation in the alpine cultivated pasture. Journal of Plant Nutrition and Fertilizer, 23,398-407. |
| [ 刘文辉, 张英俊, 师尚礼, 孙建, 魏小星 (2017). 高寒地区燕麦(Avena sativa L.)人工草地生物量分配对施肥和混播措施的响应. 植物营养与肥料学报, 23,398-407.] | |
| [32] |
Loreau M (1998). Separating sampling and other effects in biodiversity experiments. Oikos, 82,600-602.
DOI URL |
| [33] |
Loreau M, Hector A (2001). Partitioning selection and complementarity in biodiversity experiments. Nature, 412,72-76.
PMID |
| [34] | Ma CH, Han JG, Li HX, Mao PS, Rong YP (1999). The dynamical studies on biomass, quality and interspecific competition in annual forage crop swards. Acta Agrestia Sinica, 7(1),62-71. |
| [ 马春晖, 韩建国, 李鸿祥, 毛培胜, 戎郁萍 (1999). 一年生混播草地生物量和品质以及种间竞争的动态研究. 草地学报, 7(1),62-71.] | |
| [35] |
Mulder C, Jumpponen A, Högberg P, Huss-Danell K (2002). How plant diversity and legumes affect nitrogen dynamics in experimental grassland communities. Oecologia, 133,412-421.
DOI PMID |
| [36] |
Nyfeler D, Huguenin-Elie O, Suter M, Frossard E, Connolly J, Lüscher A (2009). Strong mixture effects among four species in fertilized agricultural grassland led to persistent and consistent transgressive overyielding. Journal of Applied Ecology, 46,683-691.
DOI URL |
| [37] | Pacala S, Tilman D (2001). The transition from sampling to complementarity//Kinzig A, Pacala S, Tilman D. The Functional Consequences of Biodiversity: Empirical Progress and Theoretical Extensions. Princeton University Press, Princeton. |
| [38] |
Russelle MP (1992). Nitrogen cycling in pasture and range. Journal of Production Agriculture, 5,13-23.
DOI URL |
| [39] |
Schuldt A, Bruelheide H, Härdtle W, Assmann T, Li Y, Ma K, von Oheimb G, Zhang J (2015). Early positive effects of tree species richness on herbivory in a large-scale forest biodiversity experiment influence tree growth. Journal of Ecology, 103,563-571.
DOI URL |
| [40] |
Siebenkäs A, Schumacher J, Roscher C (2016). Resource availability alters biodiversity effects in experimental grass-forb mixtures. PLOS ONE, 11,e0158110. DOI: 10.1371/journal.pone.0158110.
DOI URL |
| [41] | Song R, Mu Y, Wang YL, Wu CS, Guo JX (2002). Effects of intercropping of maize and soybean on the morphological character of roots. Journal of Northeast Normal University(Natural Science Edition), 34(3),83-86. |
| [ 宋日, 牟瑛, 王玉兰, 吴春胜, 郭继勋 (2002). 玉米、大豆间作对两种作物根系形态特征的影响. 东北师大学报(自然科学版), 34(3),83-86.] | |
| [42] |
Thibaut LM, Connolly SR (2013). Understanding diversity stability relationships: towards a unified model of portfolio effects. Ecology Letters, 16,140-150.
DOI PMID |
| [43] |
Tilman D, Downing JA (1994). Biodiversity and stability in grasslands. Nature, 367,363-365.
DOI URL |
| [44] |
Tilman D, Reich PB, Knops J, Wedin D, Mielke T, Lehman C (2001). Diversity and productivity in a long-term grassland experiment. Science, 294,843-845.
DOI URL |
| [45] |
Wang HD, Zhang LL, Zhu ZH (2013). Effects of clipping and fertilizing on the relationships between species diversity and ecosystem functioning and mechanisms of community stability in alpine meadow. Chinese Journal of Plant Ecology, 37,279-295.
DOI URL PMID |
|
[ 王海东, 张璐璐, 朱志红 (2013). 刈割、施肥对高寒草甸物种多样性与生态系统功能关系的影响及群落稳定性机制. 植物生态学报, 37,279-295.]
DOI PMID |
|
| [46] | Wang P, Wang TH, Zhou DW (2007). The productivity of grass-legume mixture in Songnen area of China. Sciencepaper Online, 2(2),121-128. |
| [ 王平, 王天慧, 周道玮 (2007). 松嫩地区禾-豆混播草地生产力研究. 中国科技论文在线, 2(2),121-128.] | |
| [47] | Wang P, Zhou DW, Jiang SC (2010). Research on biological nitrogen fixation of grass-legume mixtures in a semi-arid area of China. Acta Prataculturae Sinica, 19(6),276-280. |
| [ 王平, 周道玮, 姜世成 (2010). 半干旱地区禾-豆混播草地生物固氮作用研究. 草业学报, 19(6),276-280.] | |
| [48] | Wang P, Zhou DW, Zhang BT (2009). Coexistence and inter- specific competition in grass-legume mixture. Acta Ecologica Sinica, 29,2560-2567. |
| [ 王平, 周道玮, 张宝田 (2009). 禾-豆混播草地种间竞争与共存. 生态学报, 29,2560-2567.] | |
| [49] | Wang YK, Ding XF, Wang XP, Wu M, Gao SB, Yang X, Zhao NX, Gao YB (2019). Genotypic diversity of a dominant species Leymus chinensis inhibited ecological function of species diversity in the Inner Mongolia Steppe. Acta Ecologica Sinica, 39,1507-1516. |
| [ 王宇坤, 丁新峰, 王小平, 吴曼, 高韶勃, 杨雪, 赵念席, 高玉葆 (2019). 内蒙古典型草原建群种羊草基因型多样性抑制群落物种多样性的生态功能. 生态学报, 39,1507-1516.] | |
| [50] |
Wilsey BJ, Potvin C (2000). Biodiversity and ecosystem functioning: importance of species evenness in an old field. Ecology, 81,887-892.
DOI URL |
| [51] | Xiao YB, Li L, Zhang FS (2005). The interspecific nitrogen facilitation and the subsequent nitrogen transfer between the intercropped wheat and faba bean. Scientia Agricultura Sinica, 38,965-973. |
| [ 肖焱波, 李隆, 张福锁 (2005). 小麦/蚕豆间作体系中的种间相互作用及氮转移研究. 中国农业科学, 38,965-973.] | |
| [52] | Xie KY, Zhao Y, Li XL, He F, Wan LQ, Wang D, Han DM (2013). Relationships between grasses and legumes in mixed grassland: a review. Acta Prataculturae Sinica, 22(3),284-296. |
| [ 谢开云, 赵云, 李向林, 何峰, 万里强, 王丹, 韩冬梅 (2013). 豆-禾混播草地种间关系研究进展. 草业学报, 22(3),284-296.] | |
| [53] | Yang XC, Hu YG, Qian X, Ren CZ, Lin YC, Guo LC, Wang CL, Zeng ZH (2012). Effects of nitrogen application level on system productivity, nitrogen absorption and accumulation in mung bean ‖ oat intercropping system. Journal of China Agricultural University, 17(4),46-53. |
| [ 杨学超, 胡跃高, 钱欣, 任长忠, 林叶春, 郭来春, 王春龙, 曾昭海 (2012). 施氮量对绿豆‖燕麦间作系统生产力及氮吸收累积的影响. 中国农业大学学报, 17(4),46-53.] | |
| [54] | Zhang JH, Huang YM (2016). Biodiversity and stability mechanisms: understanding and future research. Acta Ecologica Sinica, 36,3859-3870. |
| [ 张景慧, 黄永梅 (2016). 生物多样性与稳定性机制研究进展. 生态学报, 36,3859-3870.] | |
| [55] |
Zhang QG, Zhang DY (2006). Resource availability and biodiversity effects on the productivity, temporal variability and resistance of experimental algal communities. Oikos, 114,385-396.
DOI URL |
| [56] | Zhao C, Chai Q, Qiao YY, Wang JK (2016). Effect of cereal- legume spacing in intercropping system on alleviating “N inhibition” in pea plants. Chinese Journal of Eco- Agriculture, 24,1169-1176. |
| [ 赵财, 柴强, 乔寅英, 王建康 (2016). 禾豆间距对间作豌豆“氮阻遏”减缓效应的影响. 中国生态农业学报, 24,1169-1176.] | |
| [57] | Zhao CX, He WQ, Hu YG, Dong HM, She XL (2006). Effect of intercropping or mixture and harvest time on forage yield and quality of oat and pea under low soil nitrogen environment. Agricultural Research in the Arid Areas, 23(4),5-9. |
| [ 赵彩霞, 何文清, 胡跃高, 董慧明, 佘小玲 (2006). 低氮环境下燕麦与箭筈豌豆间混作与刈割时间对饲草产量及质量特性的影响. 干旱地区农业研究, 23(4),5-9.] | |
| [58] | Zheng W, Jianaerguli, Tang GR, Zhu JZ (2015). Effects of nitrogen addition on competitive ability and productive performance of legume-grass mixture. Acta Agrestia Sinica, 23,422-425. |
| [ 郑伟, 加娜尔古丽, 唐高溶, 朱进忠 (2015). 氮素添加对豆禾牧草种间竞争力与生产性能的影响. 草地学报, 23,422-425.] | |
| [59] | Zheng W, Zhu JZ, Jianaerguli (2012). A comprehensive evaluation of the productive performance of legume-grass mixture under different mixed sowing patterns. Acta Prataculturae Sinica, 21(6),242-251. |
| [ 郑伟, 朱进忠, 加娜尔古丽 (2012). 不同混播方式豆禾混播草地生产性能的综合评价. 草业学报, 21(6),242-251.] | |
| [60] | Zhu SX, Chang J, Ge Y, Wang H, Wang FY, Zhang JM, Su CH (2014). Effects of plant diversity on productivity and diversity effect in a full-scale constructed wetland. Ecology and Environmental Sciences, 23,35-42. |
| [ 朱四喜, 常杰, 葛滢, 王海, 王凤友, 张建民, 苏春花 (2014). 全尺度人工湿地中植物多样性对生产力与多样性效应的影响. 生态环境学报, 23,35-42.] | |
| [61] | Zhu YQ, Zheng W, Wang X, Guan ZX (2018). Effects plant spacing pattern on root morphological and architectural characteristics of legume-grass mixtures. Acta Prataculturae Sinica, 27(1),73-85. |
| [ 朱亚琼, 郑伟, 王祥, 关正翾 (2018). 混播方式对豆禾混播草地植物根系构型特征的影响. 草业学报, 27(1),73-85.] |
| [1] | RAN Song-Song, YU Zai-Peng, WAN Xiao-Hua, FU Yan-Rong, ZOU Bing-Zhang, WANG Si-Rong, HUANG Zhi-Qun. Effects of neighborhood tree species diversity on foliar nitrogen-phosphorus stoichiometry of Cunninghamia lanceolata [J]. Chin J Plant Ecol, 2023, 47(7): 932-942. |
| [2] | LI Wei, ZHANG Rong. Case verification of community structure determining community productivity in subalpine meadow [J]. Chin J Plant Ecol, 2023, 47(5): 713-723. |
| [3] | ZHONG Jiao, JIANG Chao, LIU Shi-Rong, LONG Wen-Xing, SUN Osbert Jianxin. Spatial distribution patterns in potential species richness of foraging plants for Hainan gibbons [J]. Chin J Plant Ecol, 2023, 47(4): 491-505. |
| [4] | LI Jie, HAO Min-Hui, FAN Chun-Yu, ZHANG Chun-Yu, ZHAO Xiu-Hai. Effect of tree species and functional diversity on ecosystem multifunctionality in temperate forests of northeast China [J]. Chin J Plant Ecol, 2023, 47(11): 1507-1522. |
| [5] | CUI Guang-Shuai, LUO Tian-Xiang, LIANG Er-Yuan, ZHANG Lin. Advances in the study of shrubland facilitation on herbs in arid and semi-arid regions [J]. Chin J Plant Ecol, 2022, 46(11): 1321-1333. |
| [6] | Hanula TASIKEN, CAI Hui-Ying, JIN Guang-Ze. Effects of canopy structure on productivity in a typical mixed broadleaved-Korean pine forest [J]. Chin J Plant Ecol, 2021, 45(1): 38-50. |
| [7] | Dong-Ting ZOU, Qing-Gang WANG, Ao LUO, Zhi-Heng WANG. Species richness patterns and resource plant conservation assessments of Rosaceae in China [J]. Chin J Plant Ecol, 2019, 43(1): 1-15. |
| [8] | Qian YANG, Wei WANG, Hui ZENG. Effects of nitrogen addition on the plant diversity and biomass of degraded grasslands of Nei Mongol, China [J]. Chin J Plant Ecol, 2018, 42(4): 430-441. |
| [9] | ZHANG Li-Wen, HAN Guang-Xuan. A review on the relationships between plant genetic diversity and ecosystem functioning [J]. Chin J Plan Ecolo, 2018, 42(10): 977-989. |
| [10] | Jing WANG, Shan-Shan WANG, Xian-Guo QIAO, Ang LI, Jian-Guo XUE, Muqier HASI, Xue-Yao ZHANG, Jian-Hui HUANG. Influence of nitrogen addition on the primary production in Nei Mongol degraded grassland [J]. Chin J Plan Ecolo, 2016, 40(10): 980-990. |
| [11] | LUO Jun-Yu, LIU Chuan-Liang, ZHANG Shuai, WANG Chun-Yi, LÜ Li-Min, LI Chun-Hua, LI Fu-Guang, CUI Jin-Jie. Growth vigour and yield of transgenic RRM2 (RNA recognition motif 2) cotton and their effects on arthropod community in cotton field [J]. Chin J Plant Ecol, 2014, 38(7): 785-794. |
| [12] | WU Yu-Peng, XU Han, LI Yi-De, LUO Tu-Shou, CHEN De-Xiang, LIN Ming-Xian, YANG Huai. Associations between species richness and individual densities of varying spatial scales and diameter classifications in tropical montane rainforest in Jianfengling, Hainan Island, China [J]. Chin J Plant Ecol, 2014, 38(4): 325-333. |
| [13] | LI Wen-Huai, ZHENG Shu-Xia, BAI Yong-Fei. Effects of grazing intensity and topography on species abundance distribution in a typical steppe of Inner Mongolia [J]. Chin J Plant Ecol, 2014, 38(2): 178-187. |
| [14] | YANG Zhong-Ling, SU Fang-Long, MIAO Yuan, ZHONG Ming-Xing, XIAO Rui. Effects of fertilization and grazing on species richness in an alpine meadow of Qinghai-Xizang Plateau [J]. Chin J Plant Ecol, 2014, 38(10): 1074-1081. |
| [15] | MA Wen-Jing,ZHANG Qing,NIU Jian-Ming,KANG Sarula,LIU Peng-Tao,HE Xin,YANG Yan,ZHANG Yan-Nan,WU Jian-Guo. Relationship of ecosystem primary productivity to species diversity and functional group diversity: evidence from Stipa breviflora grassland in Nei Mongol [J]. Chin J Plant Ecol, 2013, 37(7): 620-630. |
| Viewed | ||||||
|
Full text |
|
|||||
|
Abstract |
|
|||||
Copyright © 2026 Chinese Journal of Plant Ecology
Tel: 010-62836134, 62836138, E-mail: apes@ibcas.ac.cn, cjpe@ibcas.ac.cn
![]()