
Chin J Plant Ecol ›› 2022, Vol. 46 ›› Issue (2): 162-175.DOI: 10.17521/cjpe.2020.0387
Special Issue: 全球变化与生态系统
• Research Articles • Previous Articles Next Articles
YUAN Yuan1,2, MU Yan-Mei1,2, DENG Yu-Jie1, LI Xin-Hao1,2, JIANG Xiao-Yan1,2, GAO Sheng-Jie1,2, ZHA Tian- Shan1,2,3, JIA Xin1,2,3,*( )
)
Received:2020-11-23
Accepted:2021-05-25
Online:2022-02-20
Published:2021-07-22
Contact:
JIA Xin
Supported by:YUAN Yuan, MU Yan-Mei, DENG Yu-Jie, LI Xin-Hao, JIANG Xiao-Yan, GAO Sheng-Jie, ZHA Tian- Shan, JIA Xin. Effects of land cover and phenology changes on the gross primary productivity in an Artemisia ordosica shrubland[J]. Chin J Plant Ecol, 2022, 46(2): 162-175.
Add to citation manager EndNote|Ris|BibTeX
URL: https://www.plant-ecology.com/EN/10.17521/cjpe.2020.0387
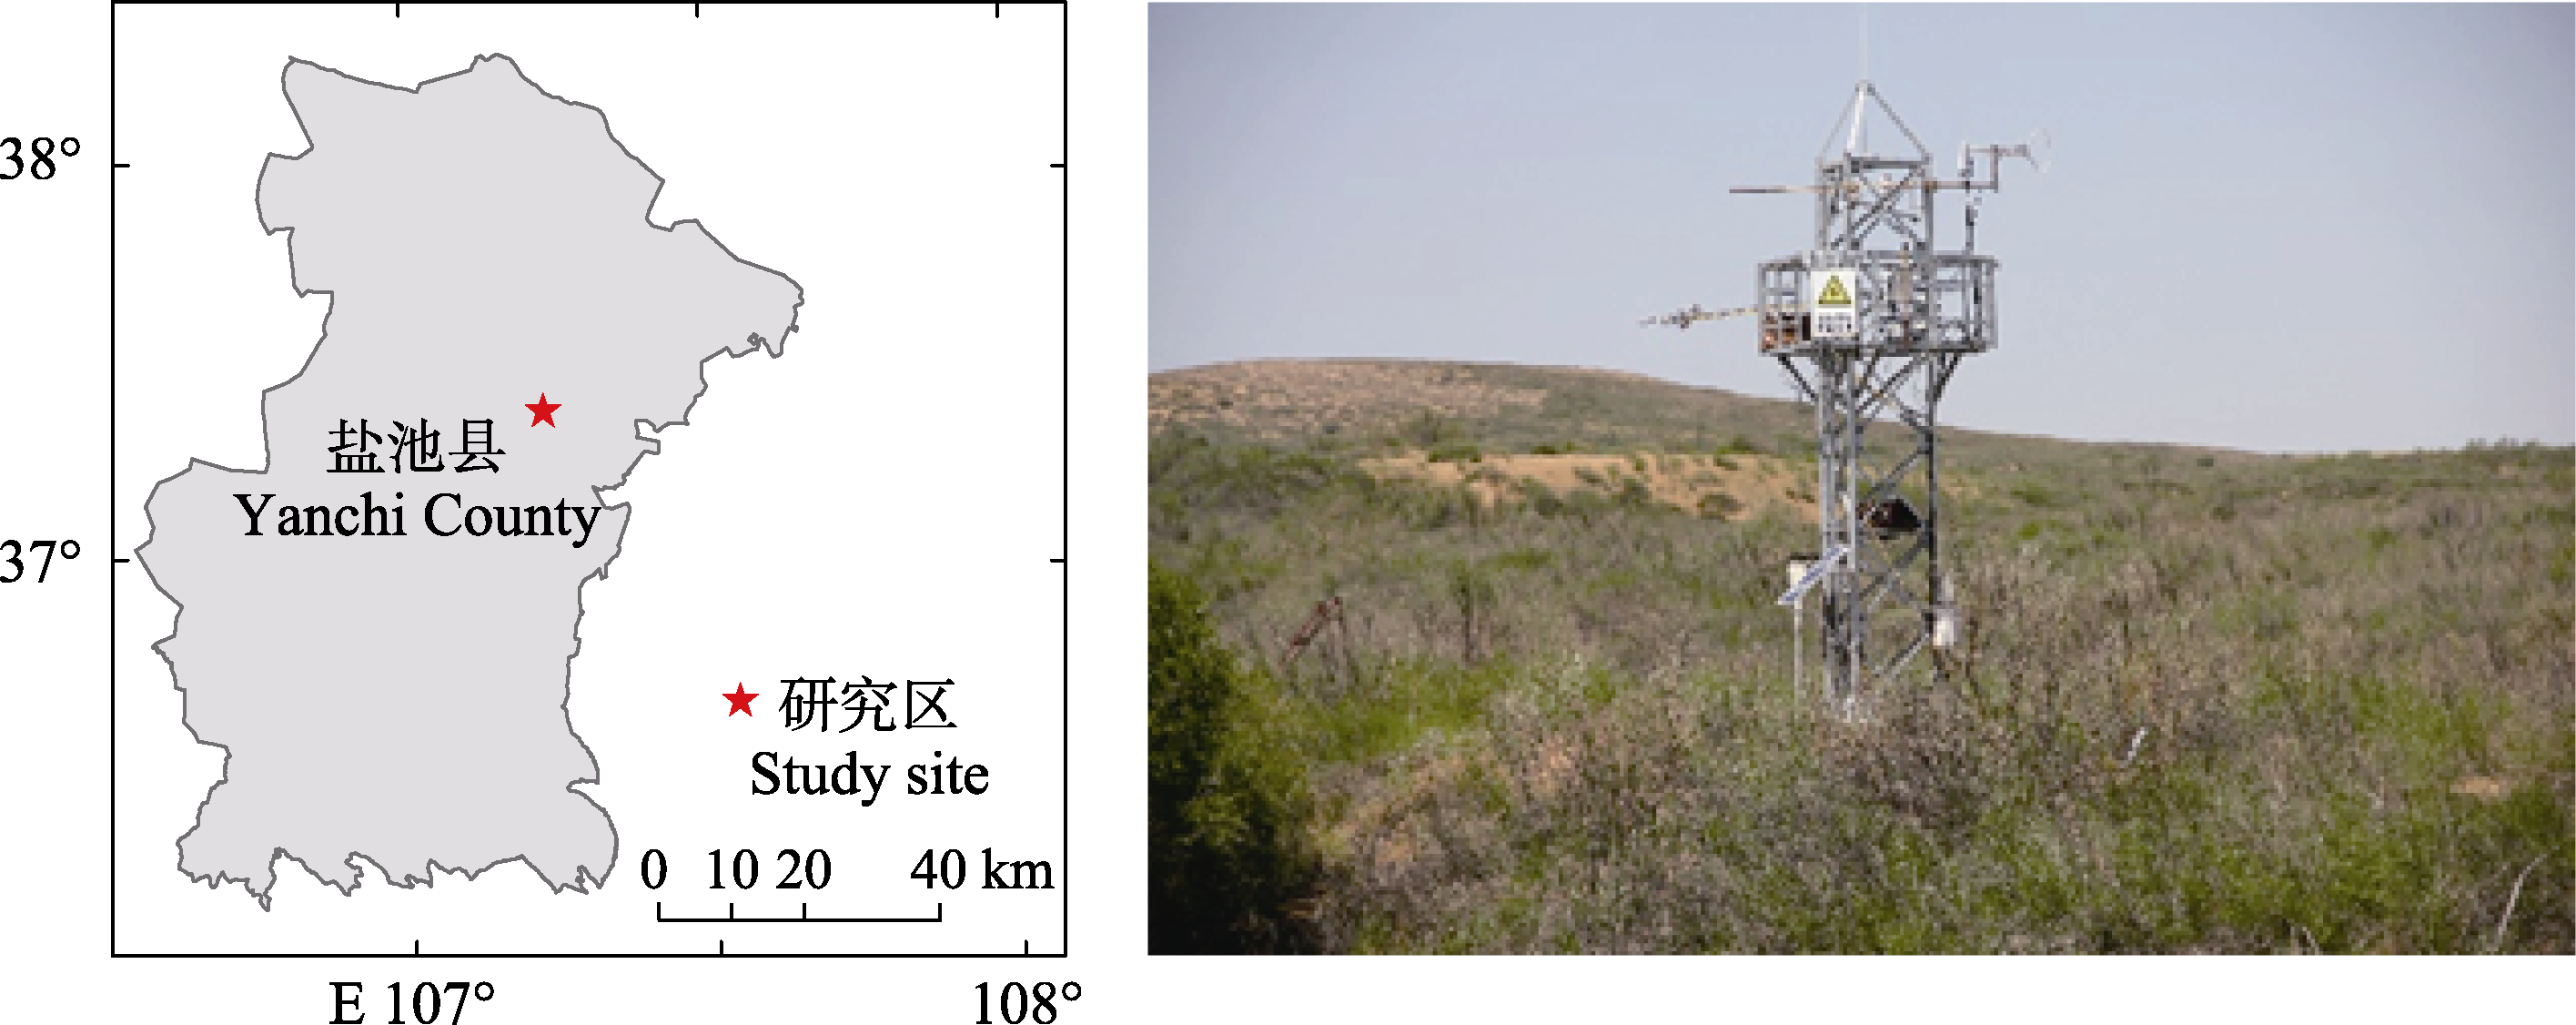
Fig. 1 Overview of the Artemisia ordosica shrubland at the Yanchi ecology research station of Mau Us Desert study site in Ningxia.
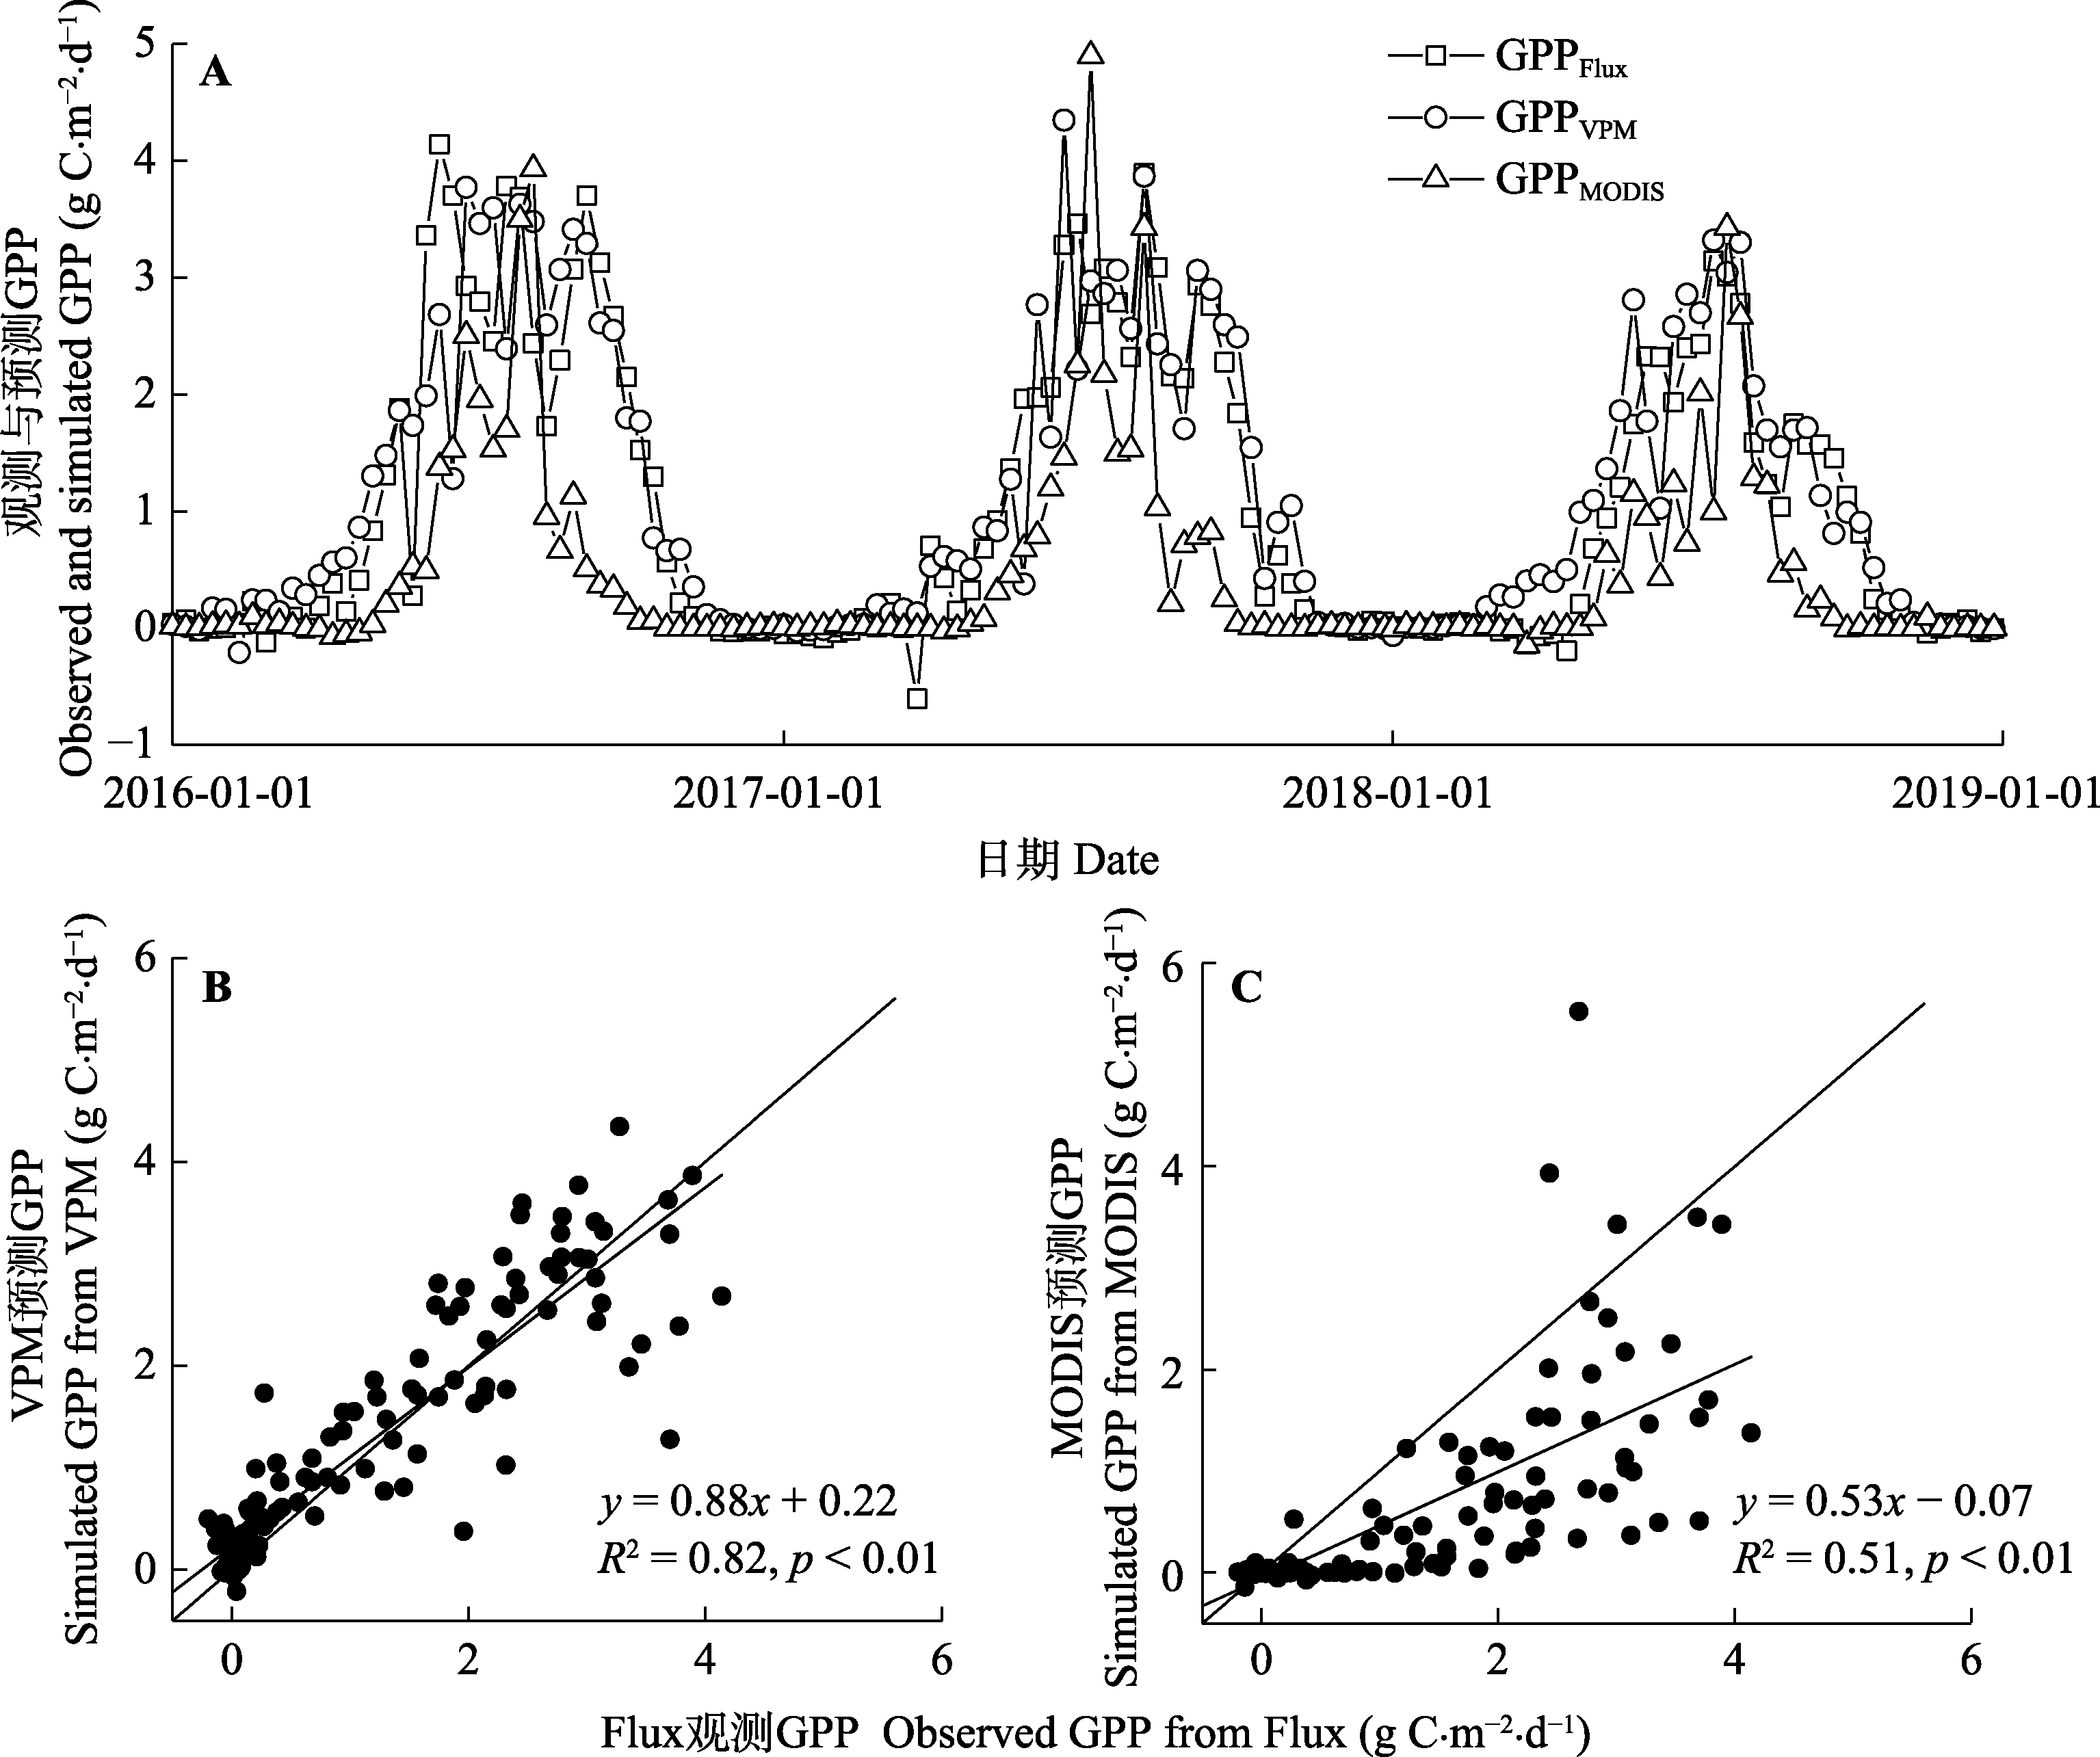
Fig. 2 Comparison of flux observation gross primary productivity (GPP)(GPPFlux) and vegetation photosynthesis model (VPM) prediction GPP (GPPVPM) and MOD17A2H product GPP (GPPMODIS) in Mau Us Desert in Ningxia from 2016 to 2018. Each data point represents the daily average value. The flux observation GPP in 2012-2015 was used for model parameterization, and the flux observation GPP in 2016-2018 was used for model validation.
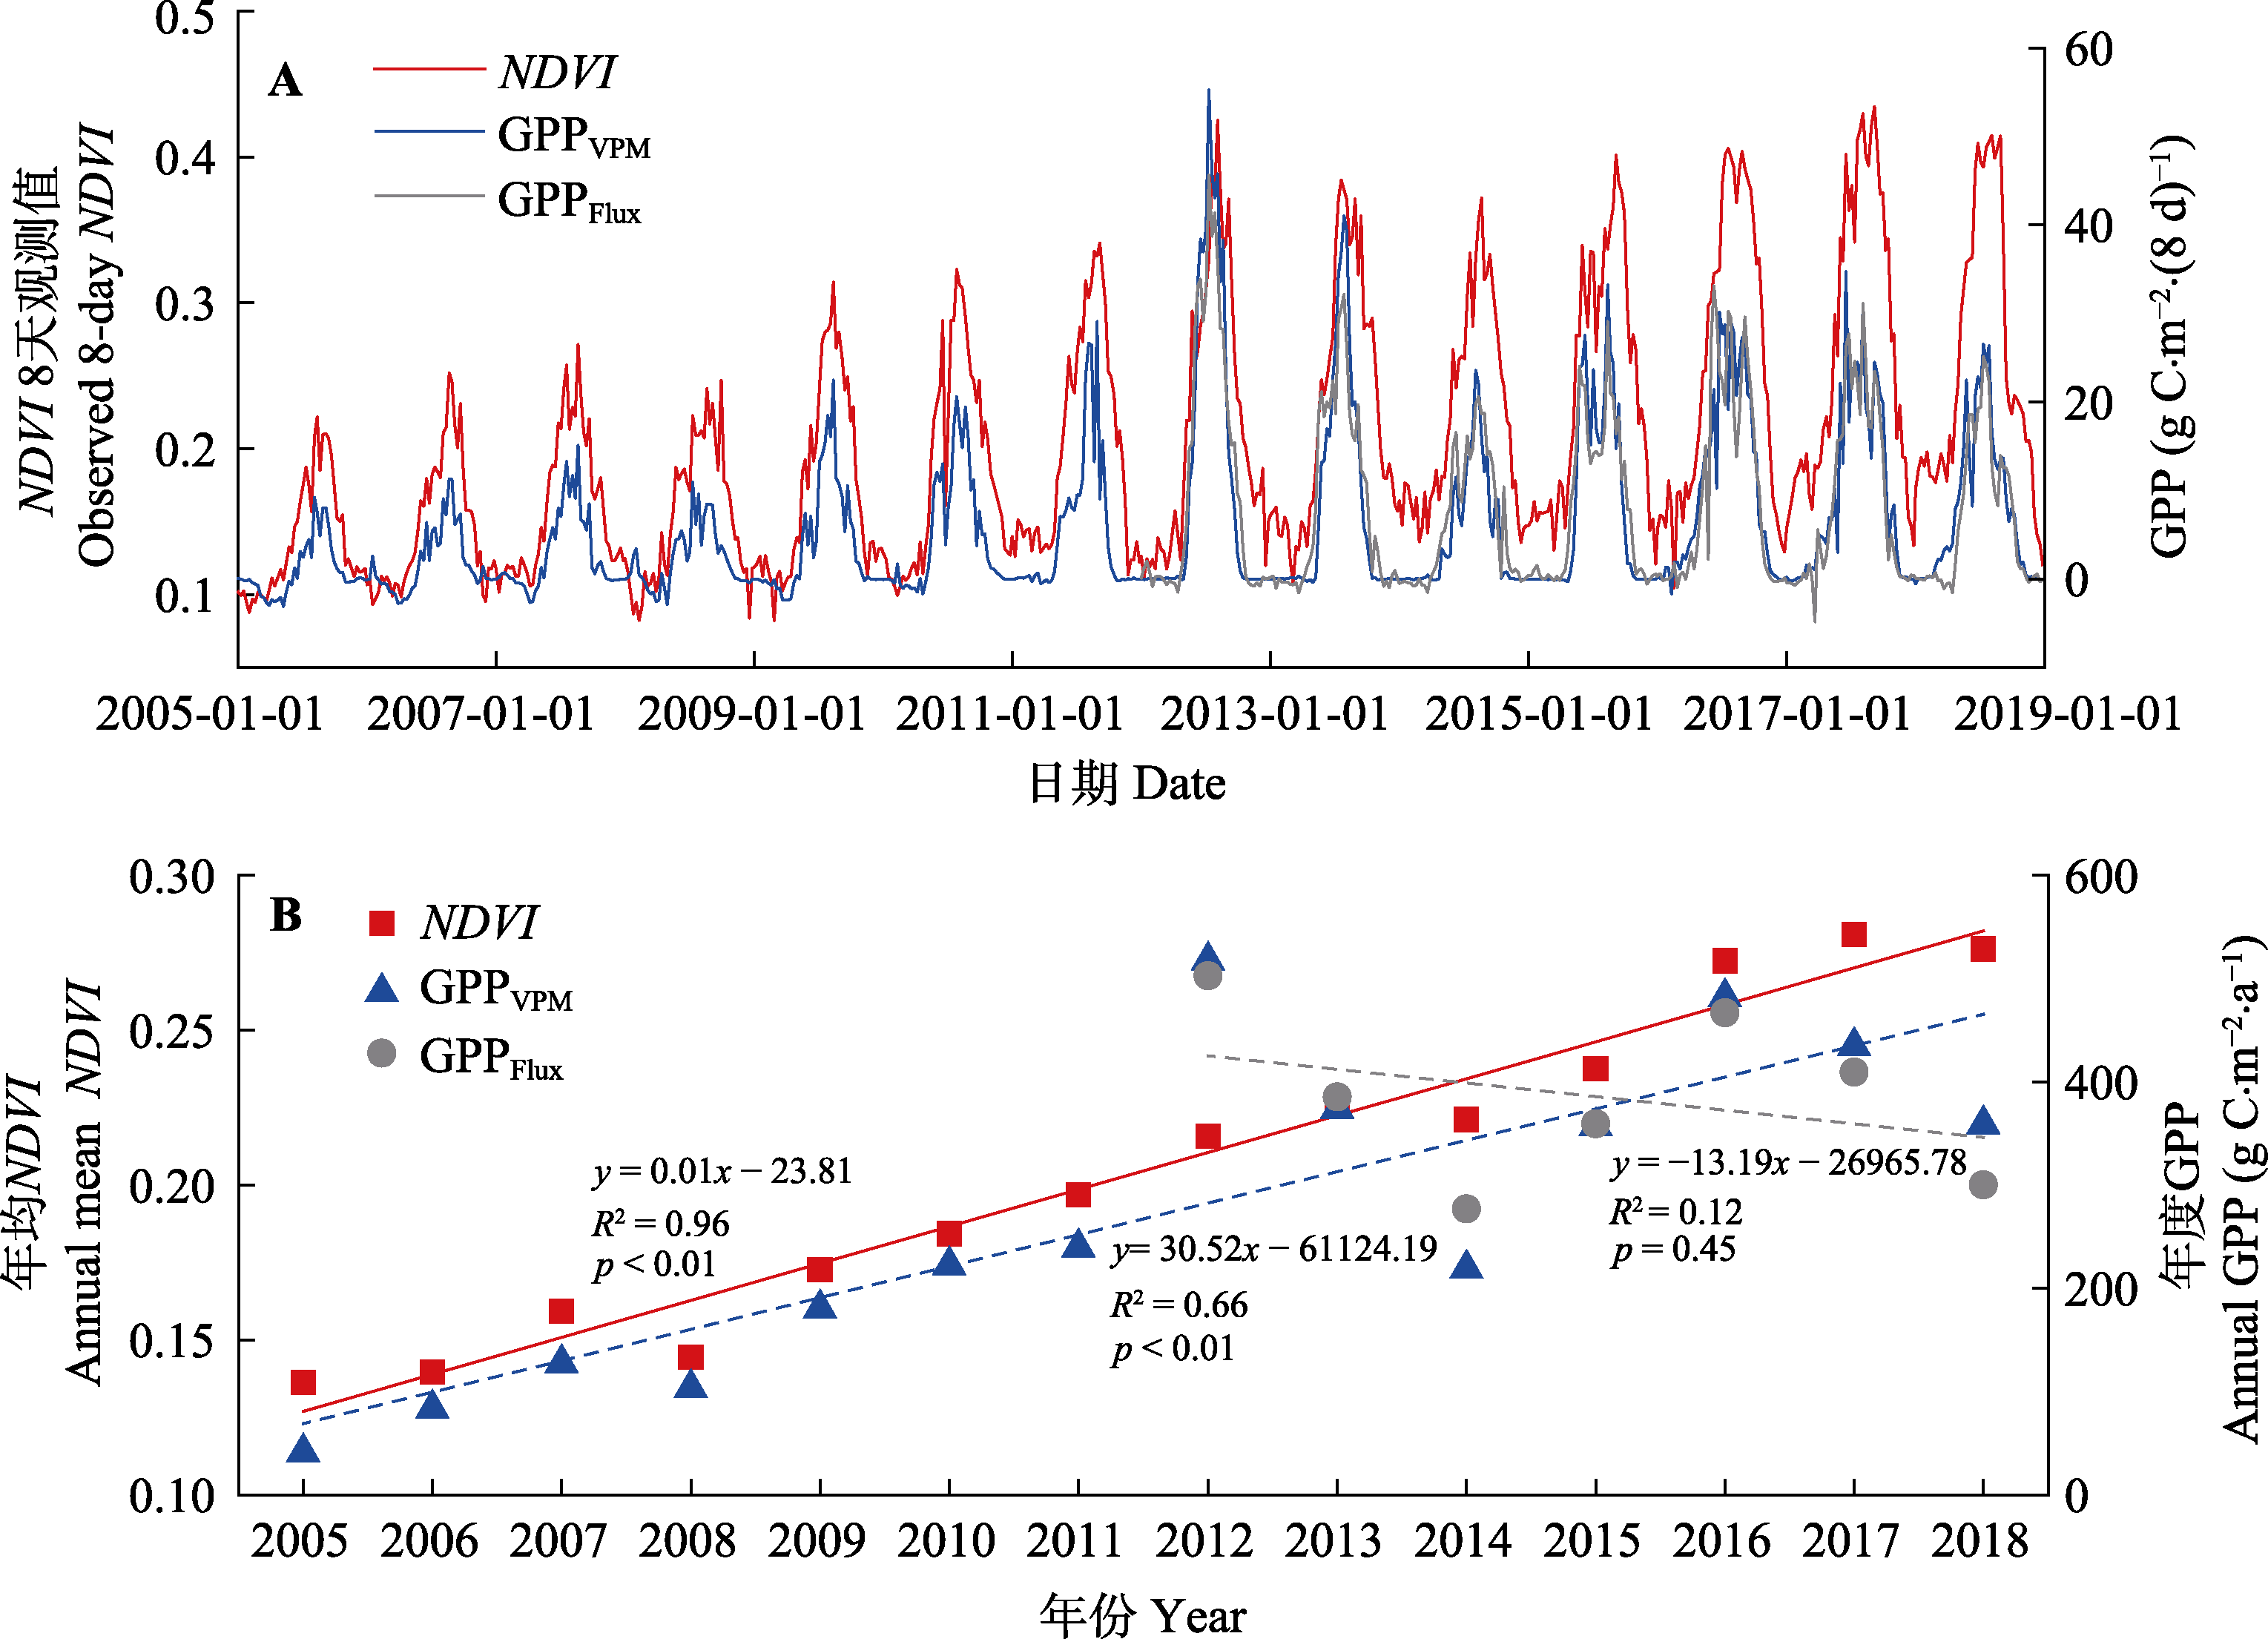
Fig. 3 Temporal dynamics of normalized difference vegetation index (NDVI) and gross primary productivity (GPP) in Mau Us Desert in Ningxia from 2005 to 2018 (A), as well as annual mean NDVI, vegetation photosynthesis model (VPM) simulated annual GPP (GPPVPM), and flux tower observed annual GPP (GPPFlux) linear trend (B).
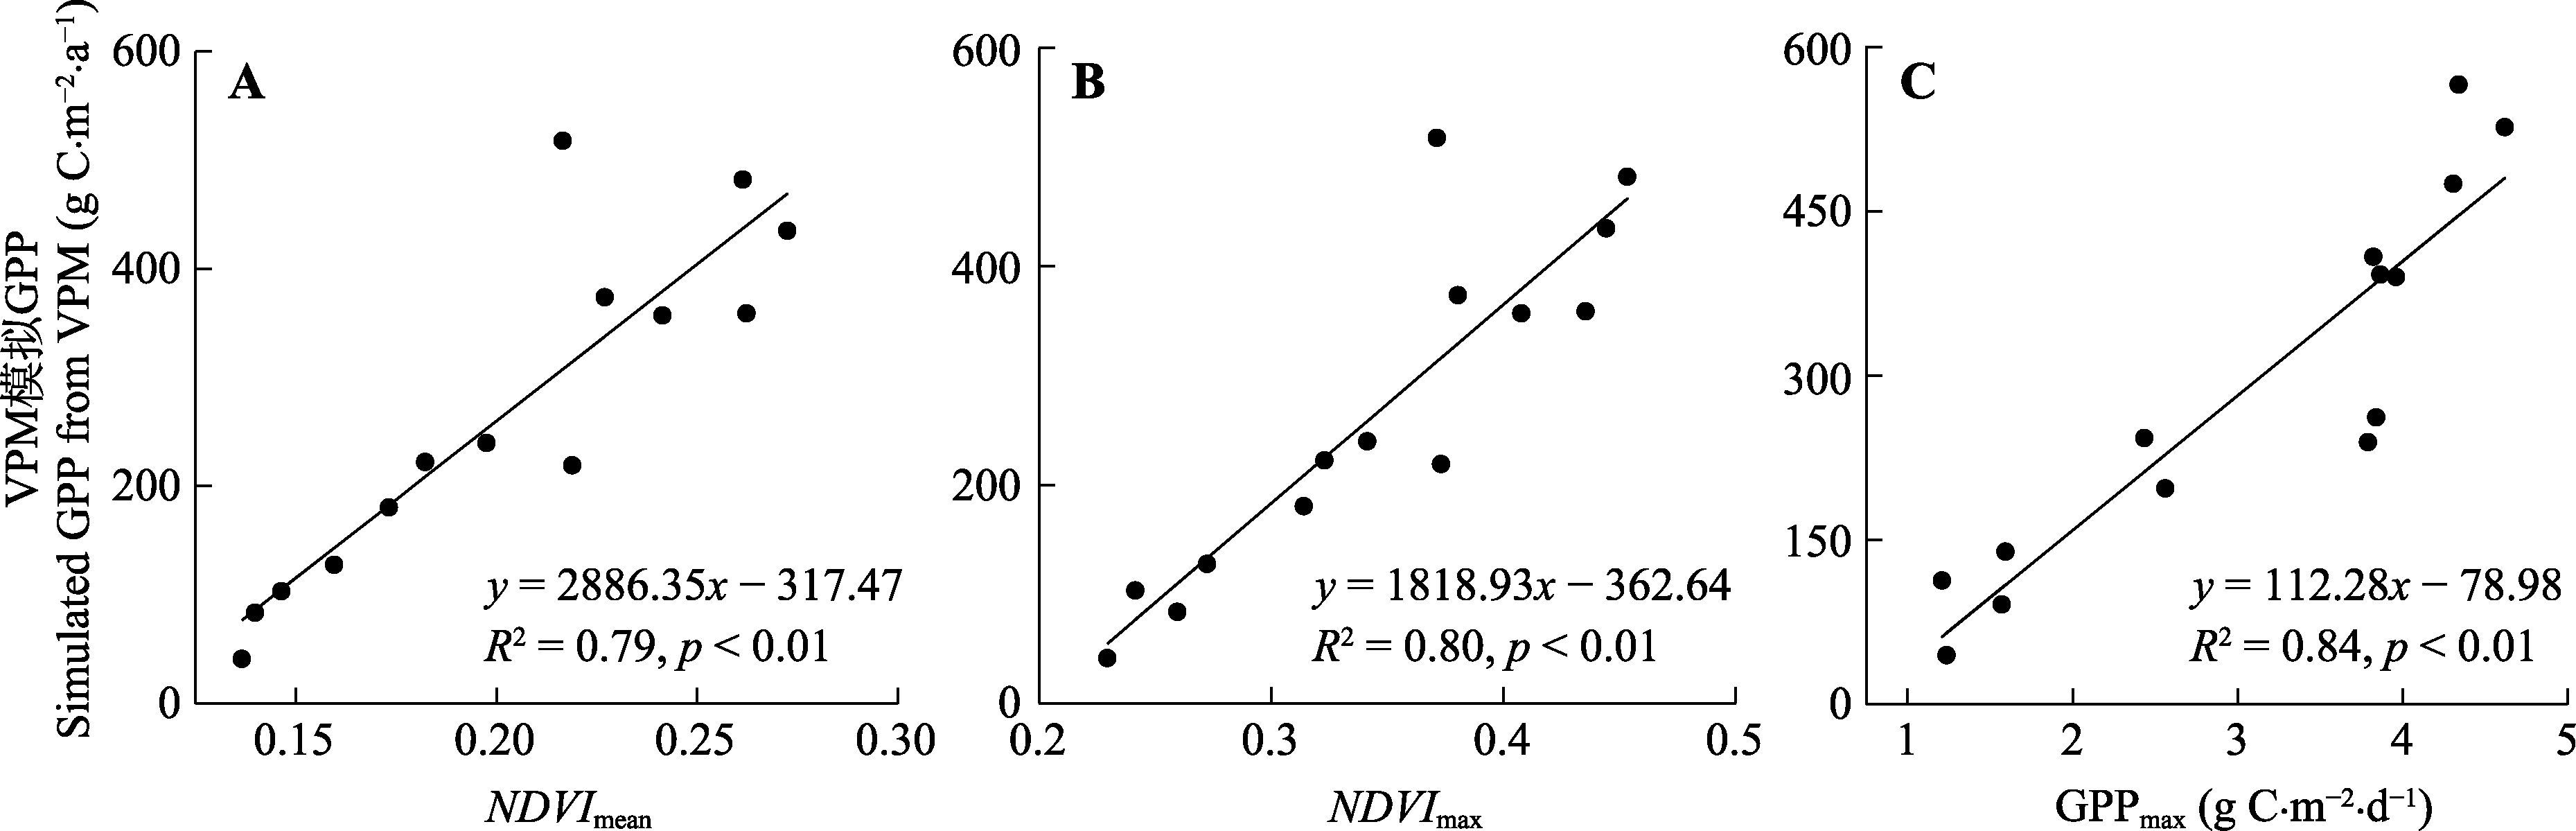
Fig. 4 Relationship between vegetation photosynthesis model (VPM) simulated annual gross primary productivity (GPP) and annual mean normalized differences vegetation index (NDVImean)(A), annual max NDVI (NDVImax)(B) and vegetation photosynthesis model (VPM) simulated GPPmax (C) in the Mau Us Desert in Ningxia from 2005-2018.
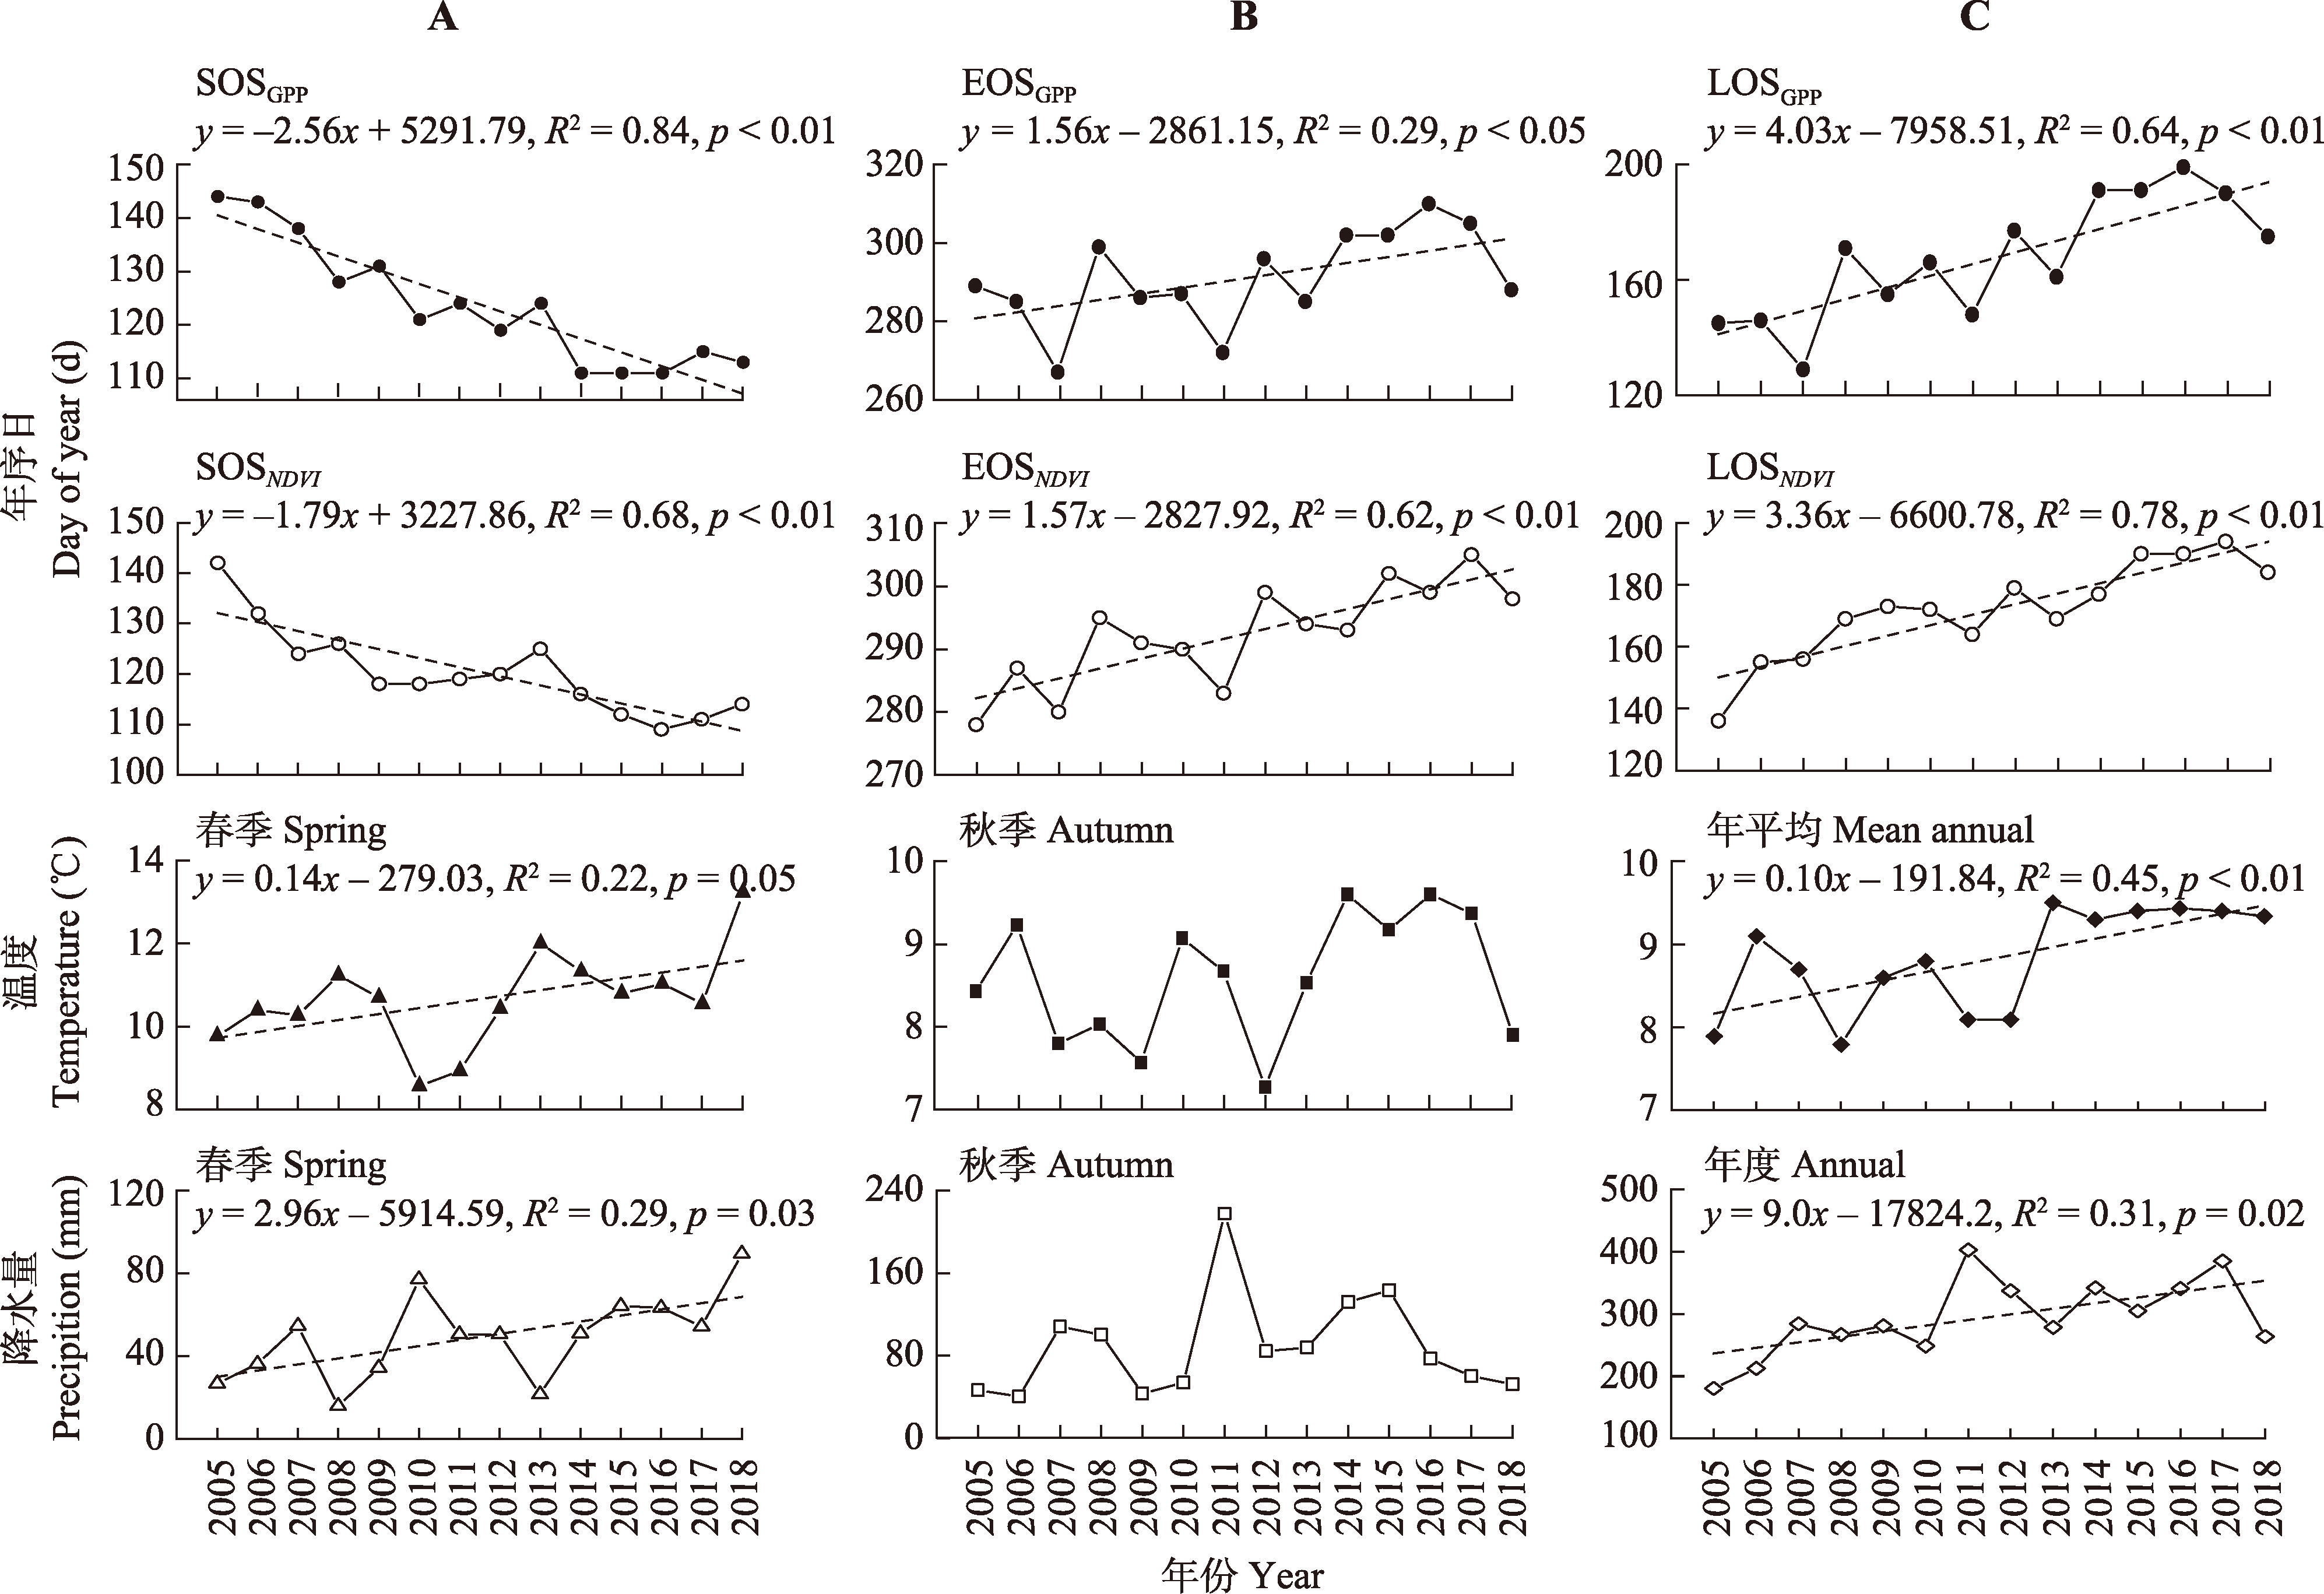
Fig. 5 Interannual variation in the start date of the growing season (SOS), the end data of the growing season (EOS), the length of growing season (LOS) and average annual temperature, annual precipitation during 2005-2018 in the Mau Us Desert in Ningxia. SOS, EOS and LOS were delineated by normalized difference vegetation index (NDVI) and simulated gross primary productivity (GPP). Dashed lines are the 14-year linear trend of SOS, EOS, LOS, temperature and precipitation.
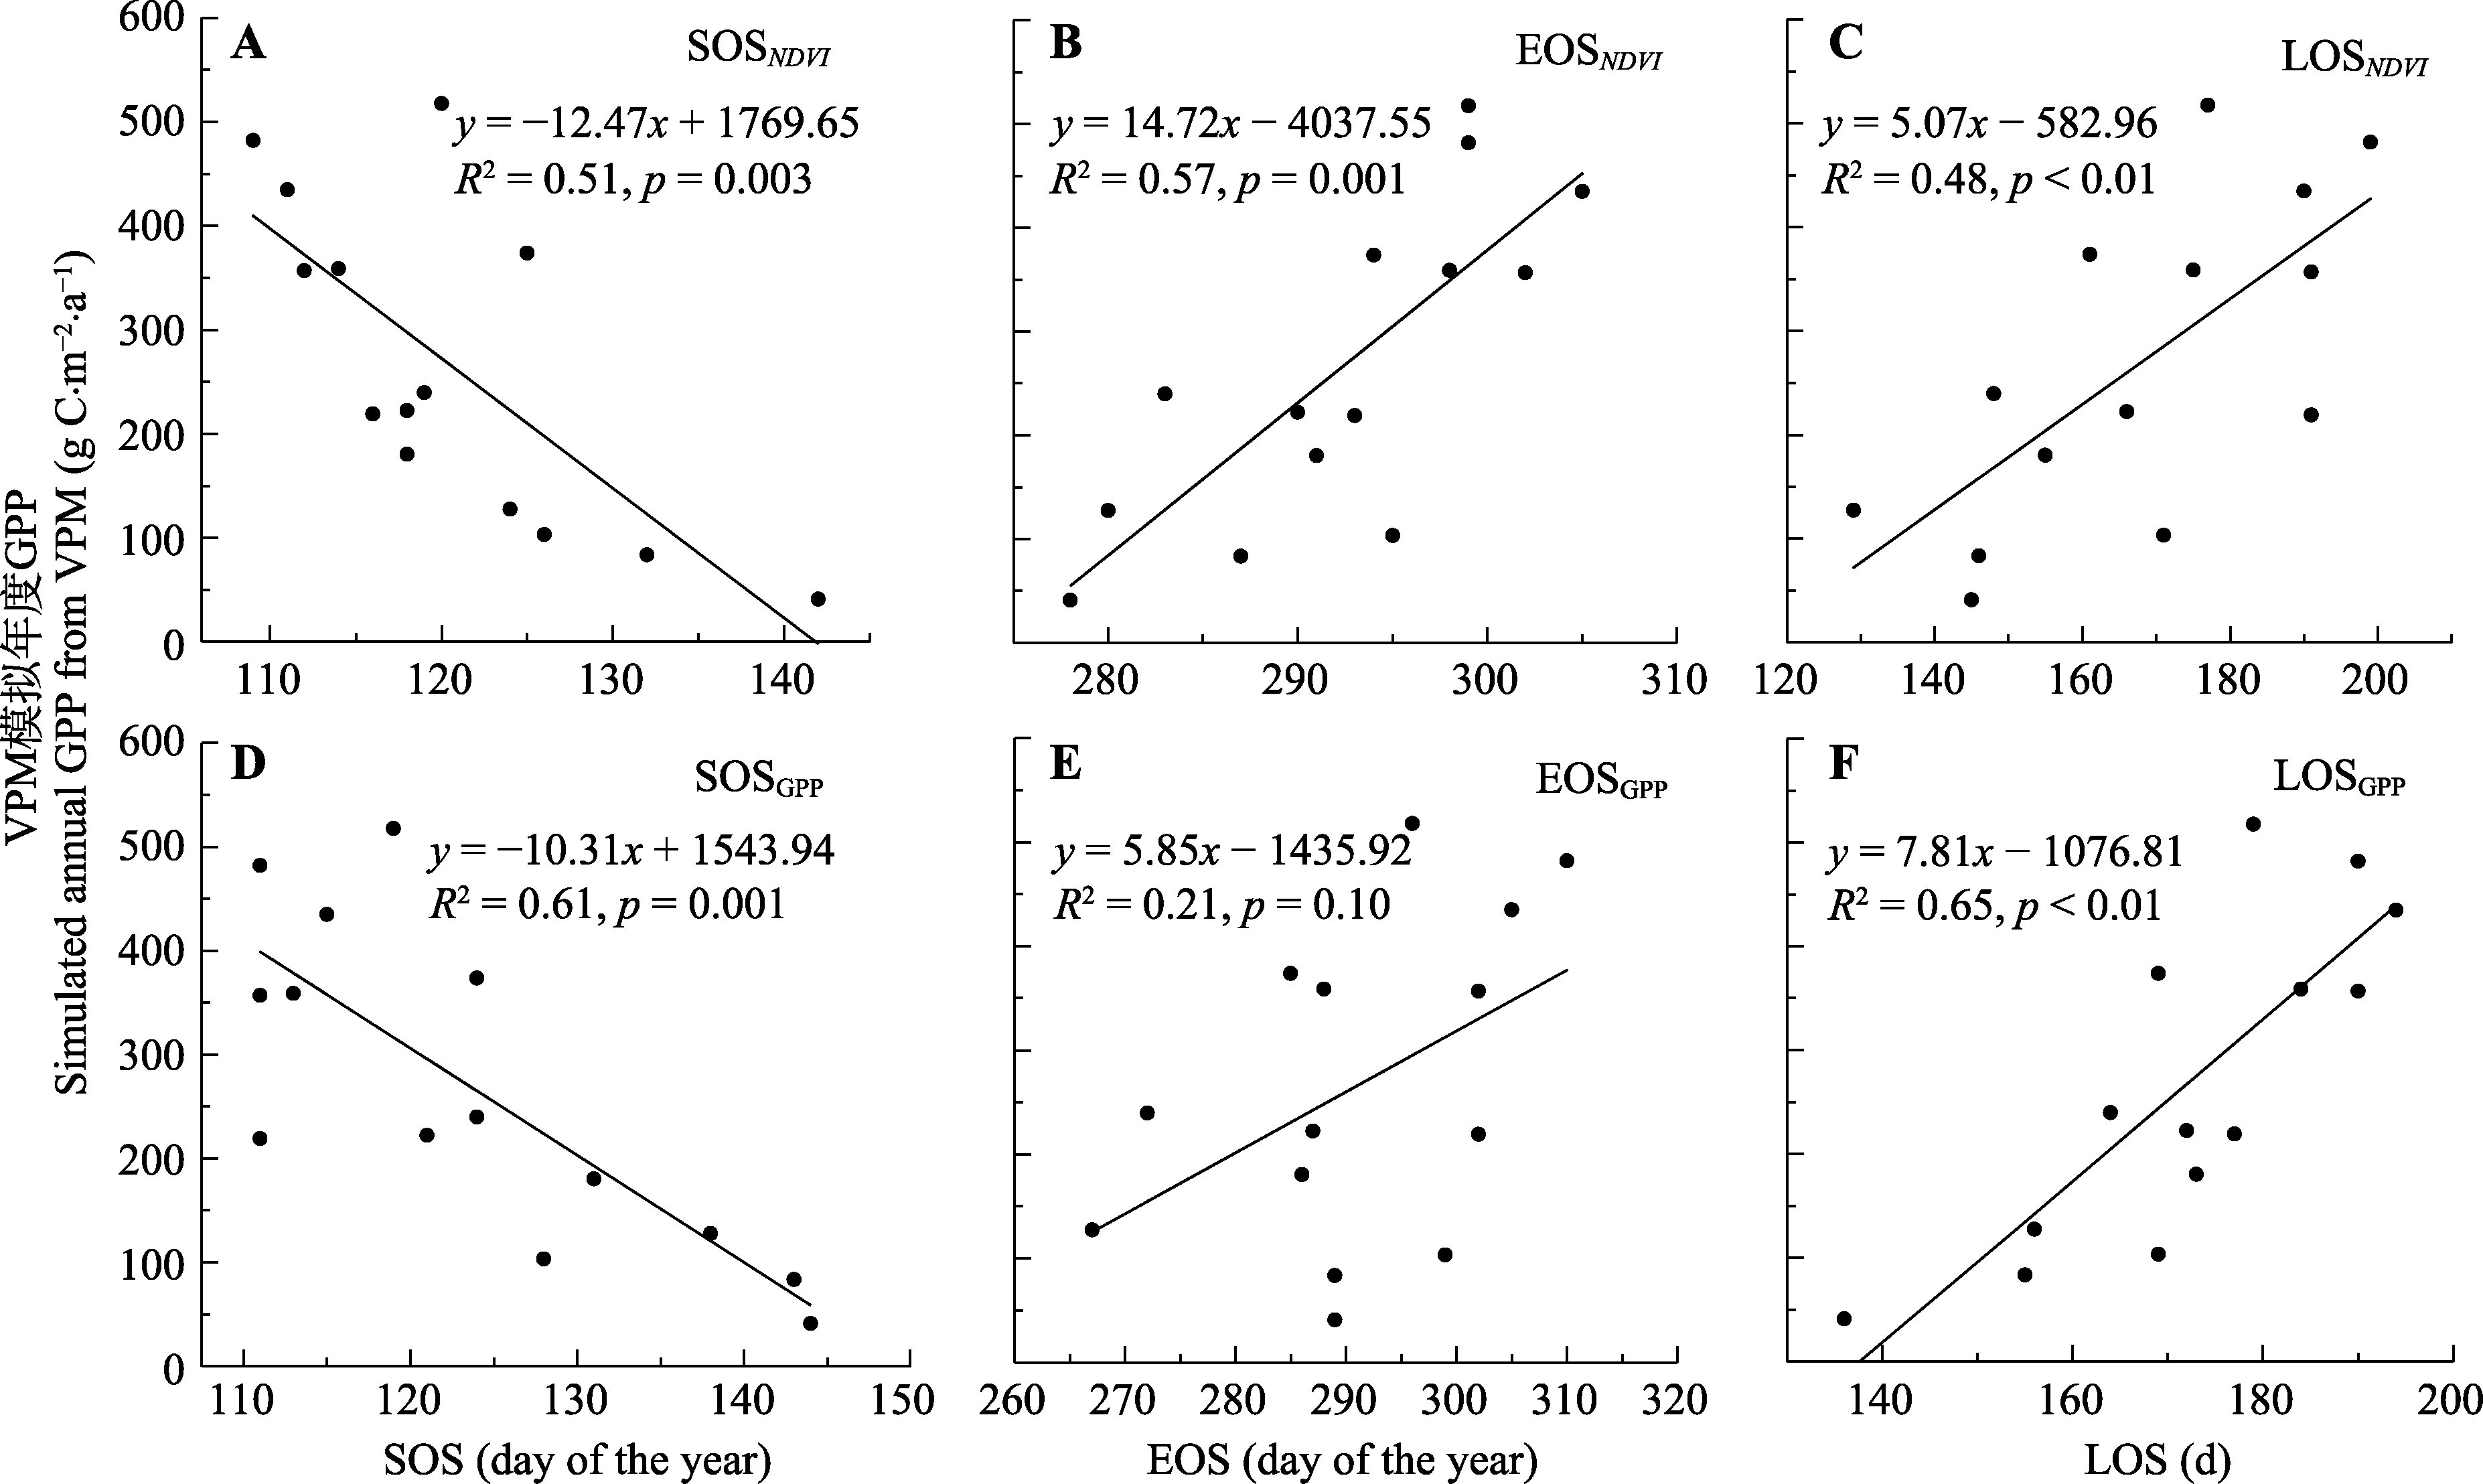
Fig. 6 Relationship between annual gross primary productivity (GPP) and the start of the growing season (SOS)(A, D), the end of the growing season (EOS)(B, E), and the length of the growing season (LOS)(C, F) in Mau Us Desert in Ningxia from 2015 to 2018.
| 变量 Variable | 标准回归系数 Standardized regression coefficients | 回归方程 Equations | R2 | p |
|---|---|---|---|---|
| GPPmax, LOSGPP | 0.85, 0.01 | GPP = -170.92 + 103.95GPPmax + 0.70LOSGPP | 0.85 | <0.01 |
| GPPmax, LOSNDVI | 0.75, 0.22 | GPP = -373.42 + 91.51GPPmax + 2.01LOSNDVI | 0.86 | <0.01 |
| NDVImax, LOSGPP | 0.81, 0.10 | GPP = -385.59 + 1766.93NDVImax + 0.24LOSGPP | 0.76 | <0.01 |
| NDVImax, LOSNDVI | 0.87, 0.03 | GPP = -467.32 + 1642.28NDVImax + 0.96LOSNDVI | 0.77 | <0.01 |
Table 1 Standardized regression coefficients for annual max gross primary productivity (GPPmax), annual max normalized differences vegetation index (NDVImax), and the multiple linear regression equations of gross primary productivity (GPP)(g C·m-2·a-1)
| 变量 Variable | 标准回归系数 Standardized regression coefficients | 回归方程 Equations | R2 | p |
|---|---|---|---|---|
| GPPmax, LOSGPP | 0.85, 0.01 | GPP = -170.92 + 103.95GPPmax + 0.70LOSGPP | 0.85 | <0.01 |
| GPPmax, LOSNDVI | 0.75, 0.22 | GPP = -373.42 + 91.51GPPmax + 2.01LOSNDVI | 0.86 | <0.01 |
| NDVImax, LOSGPP | 0.81, 0.10 | GPP = -385.59 + 1766.93NDVImax + 0.24LOSGPP | 0.76 | <0.01 |
| NDVImax, LOSNDVI | 0.87, 0.03 | GPP = -467.32 + 1642.28NDVImax + 0.96LOSNDVI | 0.77 | <0.01 |
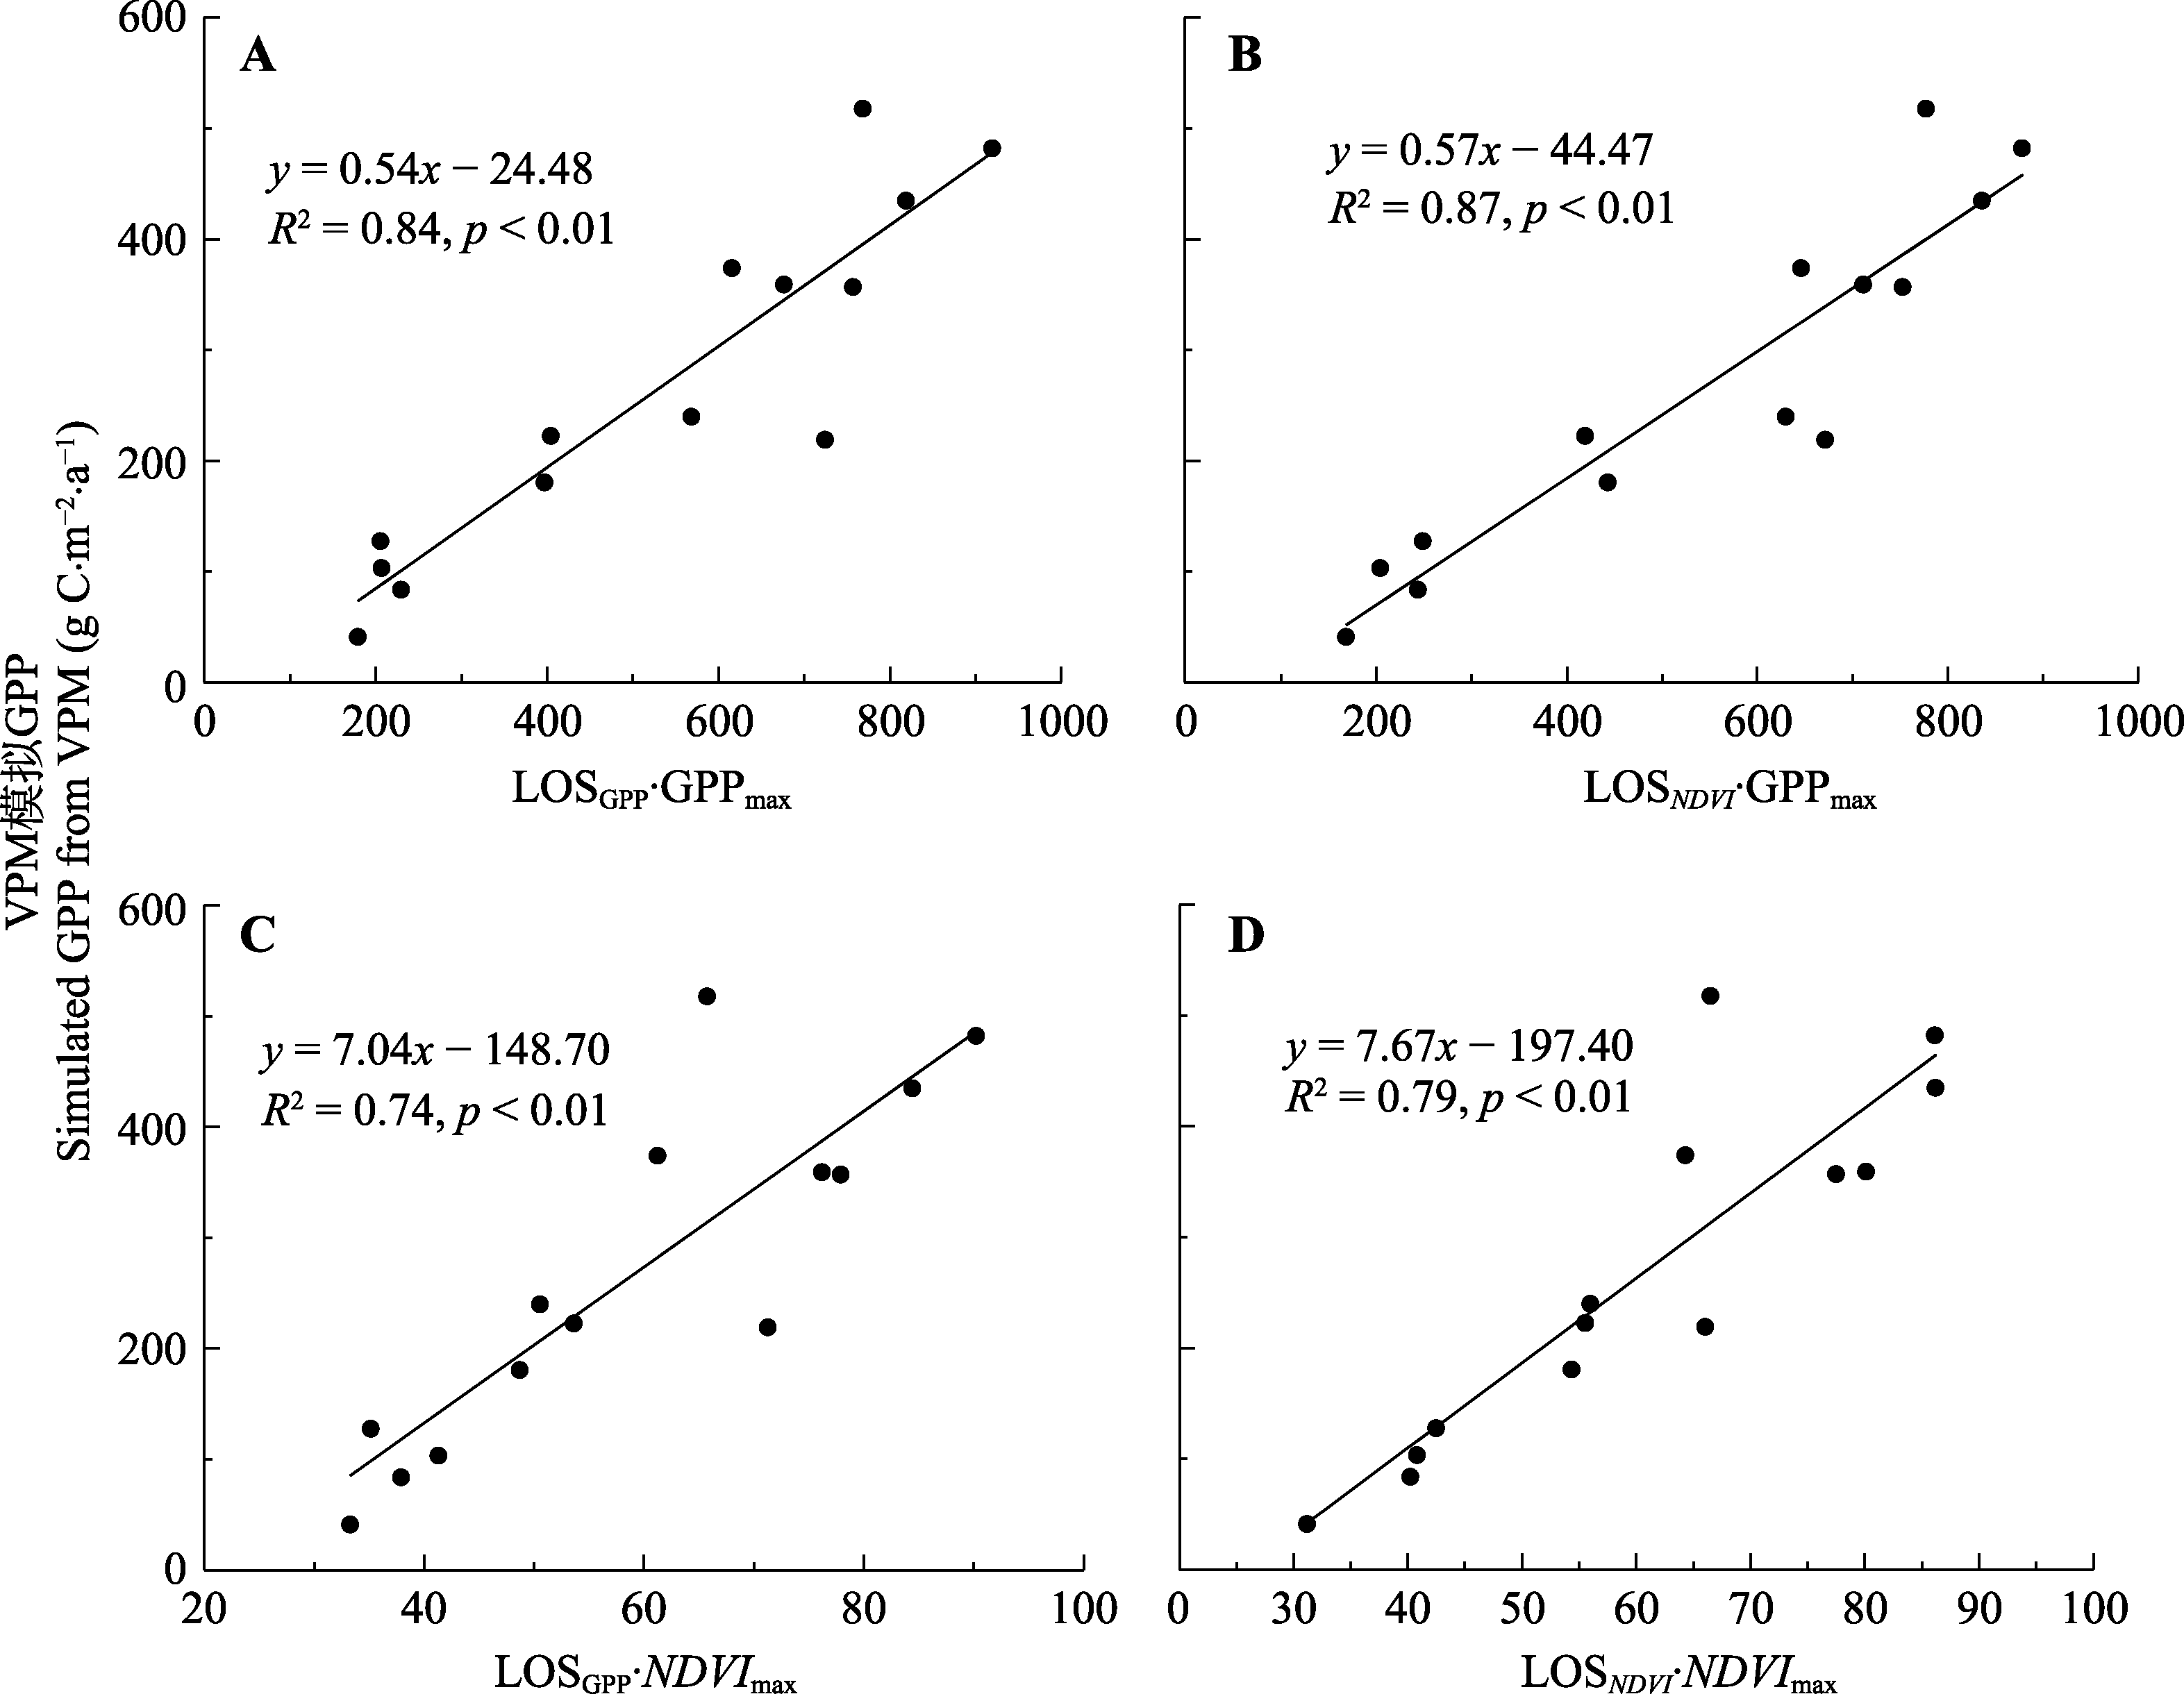
Fig. 7 Relationship between annual gross primary productivity (GPP) and multiplication of the length of growing season (LOS) and GPP (LOSGPP·GPPmax), (LOSNDVI·GPPmax), multiplication of LOS and normalized differences vegetation index (NDVI) (LOSGPP·NDVImax), (LOSNDVI·NDVImax) in the Mau Us Desert in Ningxia from 2005 to 2018.
| 研究区域 Study area | 生长季开始日期 (年序日) Start of the growing season (day of the year) | 生长季结束日期 (年序日) End of the growing season (day of the year) | 生长季长度 Length of the growing season (d) | 研究时段 Study period | 数据来源 Data resources | 分辨率 Spatial resolution (km) | 文献来源 Source of literature |
|---|---|---|---|---|---|---|---|
| 宁夏毛乌素沙地 Mau Us Desert in Ningxia | 109-142 | 278-305 | 136-194 | 2005-2018 | MODIS: NDVI | 0.5 | 本研究 This study |
| 111-144 | 267-310 | 129-199 | 2005-2008 | GPPVPM | 0.5 | 本研究 This study | |
| 90-156 | 245-323 | 125-200 | 2001-2013 | MODIS: NDVI | 0.25 | Wang et al. | |
| 80-160 | 270-325 | 135-243 | 1982-2015 | AVHRR LTDR-V4: NDVI | 5 | Zhu et al. | |
| 陕甘宁交界 Shaanxi-Gansu- Ningxia junction | 80-160 | 290-330 | 130-250 | 1999-2010 | SPOT-VGT: NDVI | 1 | Wei et al. |
| 宁夏毛乌素沙地 Mau Us Desert in Ningxia | 109-124 | 281-305 | 157-193 | 2012-2018 | 通量塔 Flux Tower: GPP | 0.22 | 本研究 This study |
Table 2 Comparision of phenology result in this study and previous studies
| 研究区域 Study area | 生长季开始日期 (年序日) Start of the growing season (day of the year) | 生长季结束日期 (年序日) End of the growing season (day of the year) | 生长季长度 Length of the growing season (d) | 研究时段 Study period | 数据来源 Data resources | 分辨率 Spatial resolution (km) | 文献来源 Source of literature |
|---|---|---|---|---|---|---|---|
| 宁夏毛乌素沙地 Mau Us Desert in Ningxia | 109-142 | 278-305 | 136-194 | 2005-2018 | MODIS: NDVI | 0.5 | 本研究 This study |
| 111-144 | 267-310 | 129-199 | 2005-2008 | GPPVPM | 0.5 | 本研究 This study | |
| 90-156 | 245-323 | 125-200 | 2001-2013 | MODIS: NDVI | 0.25 | Wang et al. | |
| 80-160 | 270-325 | 135-243 | 1982-2015 | AVHRR LTDR-V4: NDVI | 5 | Zhu et al. | |
| 陕甘宁交界 Shaanxi-Gansu- Ningxia junction | 80-160 | 290-330 | 130-250 | 1999-2010 | SPOT-VGT: NDVI | 1 | Wei et al. |
| 宁夏毛乌素沙地 Mau Us Desert in Ningxia | 109-124 | 281-305 | 157-193 | 2012-2018 | 通量塔 Flux Tower: GPP | 0.22 | 本研究 This study |
| [1] |
Bai YX, Michalet R, She WW, Qiao YG, Liu L, Miao C, Qin SG, Zhang YQ (2021). Contrasting responses of different functional groups stabilize community responses to a dominant shrub under global change. Journal of Ecology, 109, 1676-1689.
DOI URL |
| [2] |
Barichivich J, Briffa KR, Myneni RB, Osborn TJ, Melvin TM, Ciais P, Piao SL, Tucker C (2013). Large-scale variations in the vegetation growing season and annual cycle of atmospheric CO2 at high northern latitudes from 1950 to 2011. Global Change Biology, 19, 3167-3183.
DOI PMID |
| [3] |
Buermann W, Forkel M, OʼSullivan M, Sitch S, Friedlingstein P, Haverd V, Jain AK, Kato E, Kautz M, Lienert S, Lombardozzi D, Nabel JEMS, Tian HQ, Wiltshire AJ, Zhu D, Smith WK, Richardson AD (2018). Widespread seasonal compensation effects of spring warming on northern plant productivity. Nature, 562, 110-114.
DOI URL |
| [4] |
Chen C, Park T, Wang XH, Piao SL, Xu BD, Chaturvedi RK, Fuchs R, Brovkin V, Ciais P, Fensholt R, Tømmervik H, Bala G, Zhu ZC, Nemani RR, Myneni RB (2019). China and India lead in greening of the world through land-use management. Nature Sustainability, 2, 122-129.
DOI PMID |
| [5] |
Cong N, Wang T, Nan H, Ma Y, Wang X, Myneni RB, Piao S (2013). Changes in satellite-derived spring vegetation green- up date and its linkage to climate in China from 1982 to 2010: a multimethod analysis. Global Change Biology, 19, 881-891.
DOI PMID |
| [6] | Du QY, Lin AW, Fu X (2018). Comparison of multiple GPP models using remote sensing and American carbon flux data. Geomatics & Spatial Information Technology, 41(2), 138-141. |
| [ 杜启勇, 林爱文, 付醒 (2018). 基于遥感和美国碳通量观测数据的GPP模型比较研究. 测绘与空间地理信息, 41(2), 138-141.] | |
| [7] | Fang JY, Yu GR, Liu LL, Hu SJ, Chapin III FS (2018). Climate change, human impacts, and carbon sequestration in China. Proceedings of the National Academy of Sciences of the United States of America, 115, 4015-4020. |
| [8] |
Fu Z, Stoy PC, Luo YQ, Chen JQ, Sun J, Montagnani L, Wohlfahrt G, Rahman AF, Rambal S, Bernhofer C, Wang JS, Shirkey G, Niu S (2017). Climate controls over the net carbon uptake period and amplitude of net ecosystem production in temperate and boreal ecosystems. Agricultural and Forest Meteorology, 243, 9-18.
DOI URL |
| [9] |
Hu J, Moore DJP, Burns SP, Monson RK (2010). Longer growing seasons lead to less carbon sequestration by a subalpine forest. Global Change Biology, 16, 771-783.
DOI URL |
| [10] |
Jeganathan C, Dash J, Atkinson PM (2014). Remotely sensed trends in the phenology of northern high latitude terrestrial vegetation, controlling for land cover change and vegetation type. Remote Sensing of Environment, 143, 154-170.
DOI URL |
| [11] | Jeong SJ, Ho CH, Gim HJ, Brown ME (2011). Phenology shifts at start vs. end of growing season in temperate vegetation over the Northern Hemisphere for the period 1982-2008. Global Change Biology, 17, 2385-2399. |
| [12] |
Jia X, Mu Y, Zha TS, Wang B, Qin SG, Tian Y (2020). Seasonal and interannual variations in ecosystem respiration in relation to temperature, moisture, and productivity in a temperate semi-arid shrubland. Science of the Total Environment, 709, 136210. DOI: 10.1016/j.scitotenv.2019.136210.
DOI URL |
| [13] | Jia X, Zha TS, Gong JN, Wang B, Zhang YQ, Wu B, Qin SG, Peltola H (2016). Carbon and water exchange over a temperate semi-arid shrubland during three years of contrasting precipitation and soil moisture patterns. Agricultural and Forest Meteorology, 228- 229, 120-129. |
| [14] | Jia X, Zha TS, Wu B, Zhang YQ, Gong JN, Qin SG, Chen GP, Kellomäki S, Peltola H (2014). Biophysical controls on net ecosystem CO2 exchange over a semiarid shrubland in northwest China. Biogeosciences Discussions, 11, 5089- 5122. |
| [15] |
Kang X, Wang Y, Chen H, Tian J, Cui X, Rui Y, Zhong L, Kardol P, Hao Y, Xiao X (2014). Modeling carbon fluxes using multi-temporal MODIS imagery and CO2 eddy flux tower data in Zoige alpine wetland, South-West China. Wetlands, 34, 603-618.
DOI URL |
| [16] |
Kang XM, Hao YB, Cui XY, Chen H, Huang SX, Du YG, Li W, Kardol P, Xiao XM, Cui LJ (2016). Variability and changes in climate, phenology, and gross primary production of an alpine wetland ecosystem. Remote Sensing, 8, 391. DOI: 10.3390/rs8050391.
DOI URL |
| [17] | Keenan TF, Hollinger DY, Bohrer G, Dragoni D, Munger JW, Schmid HP, Richardson AD (2014). Keenan et al. reply. Nature, 507, E2-E3. |
| [18] |
Liu H, Tian F, Hu HC, Hu HP, Sivapalan M (2013). Soil moisture controls on patterns of grass green-up in Inner Mongolia: an index based approach. Hydrology and Earth System Sciences, 17, 805-815.
DOI URL |
| [19] |
Liu HY, Jiao FS, Yin JQ, Li TY, Gong HB, Wang ZY, Lin ZS (2020). Nonlinear relationship of vegetation greening with nature and human factors and its forecast-A case study of southwest china. Ecological Indicators, 111, 106009. DOI: 10.2307/2389824.
DOI URL |
| [20] |
Lloyd J, Taylor J A (1994). On the temperature dependence of soil respiration. Functional Ecology, 8, 315-323.
DOI URL |
| [21] | Lu F, Hu HF, Sun WJ, Zhu JJ, Liu GB, Zhou WM, Zhang QF, Shi PL, Liu XP, Wu X, Zhang L, Wei XH, Dai LM, Zhang KR, Sun YR, et al. (2018). Effects of national ecological restoration projects on carbon sequestration in China from 2001 to 2010. Proceedings of the National Academy of Sciences of the United States of America, 115, 4039-4044. |
| [22] | Luo J, Yin S, Bao YH, Wang YF, Li CL (2014). Analysis on dynamic changes characteristics of vegetation cover and climate response from 2000 to 2010//Huang CF, Bao YH, Zhao SJ. Information Technology in Risk Analysis and Crisis Response. Atlantis Press, Paris. 517-522. |
| [ 罗娟, 银山, 包玉海, 王永芳, 李春兰 (2014). 2000-2010年毛乌素沙地植被覆盖动态变化特征分析及其气候响应//黄崇福, 包玉海, 赵思健. 风险分析和危机反应中的信息技术. 亚特兰蒂斯出版社, 巴黎. 517-522.] | |
| [23] |
Ma T, Zhou CH (2012). Climate-associated changes in spring plant phenology in China. International Journal of Biometeorology, 56, 269-275.
DOI URL |
| [24] |
Miao L, Luan Y, Luo X, Liu Q, Moore J, Nath R, He B, Zhu F, Cui X (2013). Analysis of the phenology in the Mongolian plateau by inter-comparison of global vegetation datasets. Remote Sensing, 5, 5193-5208.
DOI URL |
| [25] |
Piao S, Ciais P, Friedlingstein P, Peylin P, Reichstein M, Luyssaert S, Margolis H, Fang J, Barr A, Chen A, Grelle A, Hollinger DY, Laurila T, Lindroth A, Richardson AD, Vesala T (2008). Net carbon dioxide losses of northern ecosystems in response to autumn warming. Nature, 451, 49-52.
DOI URL |
| [26] |
Piao S, Cui M, Chen A, Wang X, Ciais P, Liu J, Tang Y (2011a). Altitude and temperature dependence of change in the spring vegetation green-up date from 1982 to 2006 in the Qinghai-Xizang Plateau. Agricultural and Forest Meteorology, 151, 1599-1608.
DOI URL |
| [27] |
Piao S, Fang J, Ciais P, Peylin P, Huang Y, Sitch S, Wang T (2009). The carbon balance of terrestrial ecosystems in China. Nature, 458, 1009-1013.
DOI URL |
| [28] |
Piao S, Friedlingstein P, Ciais P, Viovy N, Demarty J (2007). Growing season extension and its impact on terrestrial carbon cycle in the Northern Hemisphere over the past 2 decades. Global Biogeochemical Cycles, 21, GB3018. DOI: 10.1029/2006GB002888.
DOI |
| [29] |
Piao S, Wang X, Ciais P, Zhu B, Wang T, Liu J (2011b). Changes in satellite-derived vegetation growth trend in temperate and boreal Eurasia from 1982 to 2006. Global Change Biology, 17, 3228-3239.
DOI URL |
| [30] |
Piao S, Yin G, Tan J, Cheng L, Huang M, Li Y, Liu R, Mao J, Myneni RB, Peng S, Poulter B, Shi X, Xiao Z, Zeng N, Zeng Z, Wang Y (2015). Detection and attribution of vegetation greening trend in China over the last 30 years. Global Change Biology, 21, 1601-1609.
DOI URL |
| [31] |
Qu S, Wang LC, Lin AW, Zhu HJ, Yuan MX (2018). What drives the vegetation restoration in Yangtze River basin, China: climate change or anthropogenic factors? Ecological Indicators, 90, 438-450.
DOI URL |
| [32] |
Reichstein M, Falge E, Baldocchi D, Papale D, Aubinet M, Berbigier P, Bernhofer C, Buchmann N, Gilmanov T, Granier A, Grünwald T, Havránková K, Ilvesniemi H, Janous D, Knohl A, et al. (2005). On the separation of net ecosystem exchange into assimilation and ecosystem respiration: review and improved algorithm. Global Change Biology, 11, 1424-1439.
DOI URL |
| [33] |
Richardson AD, Black TA, Ciais P, Delbart N, Friedl MA, Gobron N, Hollinger DY, Kutsch WL, Longdoz B, Luyssaert S, Migliavacca M, Montagnani L, Munger JW, Moors E, Piao SL, et al. (2010). Influence of spring and autumn phenological transitions on forest ecosystem productivity. Philosophical Transactions of the Royal Society of London: Series B, 365, 3227-3246.
DOI URL |
| [34] |
Sacks WJ, Schimel DS, Monson RK (2007). Coupling between carbon cycling and climate in a high-elevation, subalpine forest: a model-data fusion analysis. Oecologia, 151, 54-68.
DOI URL |
| [35] |
Shi L, Zhao SQ, Tang ZY, Fang JY (2011). The changes in chinaʼs forests: an analysis using the forest identity. PLOS ONE, 6, e20778. DOI: 10.1371/journal.pone.0020778.
DOI URL |
| [36] | Shi PJ, Sun S, Wang M, Li Ning, Wang JA, Jin YY, Gu XT, Yin WX (2014). Climate change regionalization in China (1961-2010). Scientia China: Earth Sciences, 44, 2294- 2306. |
| [ 史培军, 孙劭, 汪明, 李宁, 王静爱, 金赟赟, 顾孝天, 尹卫霞 (2014). 中国气候变化区划(1961-2010年). 中国科学: 地球科学, 44, 2294-2306.] | |
| [37] |
Sims DA, Rahman AF, Cordova VD, Baldocchi DD, Flanagan LB, Goldstein AH, Hollinger DY, Misson L, Monson RK, Schmid HP, Wofsy SC, Xu L (2005). Midday values of gross CO2 flux and light use efficiency during satellite overpasses can be used to directly estimate eight-day mean flux. Agricultural and Forest Meteorology, 131, 1-12.
DOI URL |
| [38] |
Song Y, Ma MG (2011). A statistical analysis of the relationship between climatic factors and the Normalized Difference Vegetation Index in China. International Journal of Remote Sensing, 32, 3947-3965.
DOI URL |
| [39] |
Sparks TH, Jeffree EP, Jeffree CE (2000). An examination of the relationship between flowering times and temperature at the national scale using long-term phenological records from the UK. International Journal of Biometeorology, 44, 82-87.
PMID |
| [40] | Tang H, Li ZW, Ding L, Shen BB, Wang X, Xu LJ, Xin XP (2018). Validation of GPP remote sensing products using eddy covariance flux observations in the grassland area of China. Pratacultural Science, 35, 2568-2583. |
| [ 唐欢, 李振旺, 丁蕾, 沈贝贝, 王旭, 徐丽君, 辛晓平 (2018). 基于地面涡度数据的中国草原区GPP遥感产品验证. 草业科学, 35, 2568-2583.] | |
| [41] | Tang LQ, Liu H, Hu B, Xiao TG, Liu GR, Wang YS, Shi YY (2017). A dataset of reconstructed photosynthetically active radiation in China (1961-2014). China Scientific Data, 2(3), 40-51. |
| [ 唐利琴, 刘慧, 胡波, 肖天贵, 刘广仁, 王跃思, 史莹莹 (2017). 1961-2014年中国光合有效辐射重构数据集. 中国科学数据, 2(3), 40-51.] | |
| [42] |
Tong XW, Brandt M, Yue YM, Horion S, Wang KL, Keersmaecker WD, Tian F, Schurgers G, Xiao XM, Luo YQ, Chen C, Myneni R, Shi Z, Chen HS, Fensholt R (2018). Increased vegetation growth and carbon stock in China karst via ecological engineering. Nature Sustainability, 1, 44-50.
DOI URL |
| [43] |
Ueyama M, Iwata H, Harazono Y (2014). Autumn warming reduces the CO2 sink of a black spruce forest in interior Alaska based on a nine-year eddy covariance measurement. Global Change Biology, 20, 1161-1173.
DOI URL |
| [44] | Wang JP, Liu LY, Jia K, Tian LH (2015). Spatiotemporal variation of vegetation phenology and its affecting factors in the Mu Us Sandy Land. Journal of Desert Research, 35, 624-631. |
| [ 王静璞, 刘连友, 贾凯, 田丽慧 (2015). 毛乌素沙地植被物候时空变化特征及其影响因素. 中国沙漠, 35, 624-631.] | |
| [45] | Wang T, Yang MH (2017). Dynamic change of NDVI and its response to climate change and human activities in Yulin, Shaanxi Province, China. Arid Zone Research, 34, 1133- 1140. |
| [ 王涛, 杨梅焕 (2017). 榆林地区植被指数动态变化及其对气候和人类活动的响应. 干旱区研究, 34, 1133- 1140.] | |
| [46] | Wang XY, Li YL, Lian J, Duan YL, Wang LL (2021). Relationship between vegetation coverage and climate change in semiarid sandy land and the significance to ecological construction. Journal of Desert Research, 41, 183-194. |
| [ 王旭洋, 李玉霖, 连杰, 段育龙, 王立龙 (2021). 半干旱典型风沙区植被覆盖度演变与气候变化的关系及其对生态建设的意义. 中国沙漠, 41, 183-194.] | |
| [47] | Wei ZF, Ren ZY, Zhang C, Li XY, Zhang JQ (2014). Impact of climate on vegetation phenology on Loess Plateau in Shaanxi-Gansu-Ningxia Region during 1999-2010. Bulletin of Soil and Water Conservation, 34, 232-236. |
| [ 韦振锋, 任志远, 张翀, 李小燕, 张嘉琪 (2014). 1999-2010年陕甘宁黄土高原区气候对植被物候的影响. 水土保持通报, 34, 232-236.] | |
| [48] | Wu W (2001). Study on process of desertification in Mu Us Sandy Land for last 50 years, China. Journal of Desert Research, 21, 164-169. |
| [ 吴薇 (2001). 近50年来毛乌素沙地的沙漠化过程研究. 中国沙漠, 21, 164-169.] | |
| [49] | Wutzler T, Lucas-Moffat A, Migliavacca M, Knauer J, Sickel K, Šigut L, Menzer O, Reichstein M (2018). Basic and extensible post-processing of eddy covariance flux data with REddyProc. Biogeoences, 15, 5015-5030. |
| [50] | Xia JY, Niu SL, Ciais P, Janssens IA, Chen JQ, Ammann C, Arain A, Blanken PD, Cescatti A, Bonal D, Buchmann N, Curtis PS, Chen SP, Dong JW, Flanagan LB, et al. (2015). Joint control of terrestrial gross primary productivity by plant phenology and physiology. Proceedings of the National Academy of Sciences of the United States of America, 112, 2788-2793. |
| [51] |
Xiao X, Zhang Q, Braswell B, Urbanski S, Boles S, Wofsy S, Moore III B, Ojima D (2004). Modeling gross primary production of temperate deciduous broadleaf forest using satellite images and climate data. Remote Sensing of Environment, 91, 256-270.
DOI URL |
| [52] | Yu F, Price KP, Ellis J, Kastens D (2004). Satellite observations of the seasonal vegetation growth in central Asia: 1982-1990. Photogrammetric Engineering & Remote Sensing, 70, 461-469. |
| [53] |
Yu K, Hu CM (2013). Changes in vegetative coverage of the Hongze lake national wetland nature reserve: a decade- long assessment using MODIS medium-resolution data. Journal of Applied Remote Sensing, 7, 3589. DOI: 10.1117/1.JRS.7.073589.
DOI |
| [54] |
Zeng HQ, Jia GS, Epstein H (2011). Recent changes in phenology over the northern high latitudes detected from multi-satellite data. Environmental Research Letters, 6, 045508. DOI: 10.1088/1748-9326/6/4/045508.
DOI URL |
| [55] | Zhang XS (1994). Principles and optimal models for development of Maowusu Sandy grassland. Acta Phytoecologica Sinica, 18, 1-16. |
| [ 张新时 (1994). 毛乌素沙地的生态背景及其草地建设的原则与优化模式. 植物生态学报, 18, 1-16.] | |
| [56] |
Zhang Y, Xiao X, Jin C, Dong J, Zhou S, Wagle P, Joiner J, Guanter L, Zhang Y, Zhang G, Qin Y, Wang J, Moore III B (2016). Consistency between sun-induced chlorophyll fluorescence and gross primary production of vegetation in North America. Remote Sensing of Environment, 183, 154- 169.
DOI URL |
| [57] | Zhou S, Zhang Y, Caylor KK, Luo Y, Xiao X, Ciais P, Huang Y, Wang G (2016). Explaining inter-annual variability of gross primary productivity from plant phenology and physiology. Agricultural and Forest Meteorology, 226-227, 246-256. |
| [58] | Zhu YK, Qin SG, Zhang YQ, Zhang JT, Shao YY, Gao Y (2018). Vegetation phenology dynamic and its responses to meteorological factor changes in the Mu Us Desert of northern China. Journal of Beijing Forestry University, 40(9), 98-106. |
| [ 朱娅坤, 秦树高, 张宇清, 张举涛, 邵艳莹, 高岩 (2018). 毛乌素沙地植被物候动态及其对气象因子变化的响应. 北京林业大学学报, 40(9), 98-106.] |
| [1] | Wei-Wei SHE Qin shugao Yan-Gui QIAO Yuqing Zhang. Effects of nitrogen and water addition on leaf nitrogen and phosphorus stoichiometry of dominant species in an Artemisia ordosica community [J]. Chin J Plant Ecol, 2024, 48(5): 590-600. |
| [2] | Yi-Heng Chen Yusupjan Rusul 吾斯曼 阿卜杜热合曼. Analysis of spatial and temporal variation in grassland vegetation cover in the Tianshan Mountains and the driving factors from 2001 to 2020 [J]. Chin J Plant Ecol, 2024, 48(5): 561-576. |
| [3] | ZHANG Ji-Shen, SHI Xin-Jie, LIU Yu-Nuo, WU Yang, PENG Shou-Zhang. Dynamics of ecosystem carbon storage of potential natural vegetation in China under climate change [J]. Chin J Plant Ecol, 2024, 48(4): 428-444. |
| [4] | ZANG Miao-Han, WANG Chuan-Kuan, LIANG Yi-Xian, LIU Yi-Xiao, SHANGGUAN Hong-Yu, QUAN Xian-Kui. Stoichiometric characteristics of leaf, branch and root in Larix gmelinii in response to climate warming based on latitudinal transplantation [J]. Chin J Plant Ecol, 2024, 48(4): 469-482. |
| [5] | LIANG Yi-Xian, WANG Chuan-Kuan, ZANG Miao-Han, SHANGGUAN Hong-Yu, LIU Yi-Xiao, QUAN Xian-Kui. Responses of radial growth and biomass allocation of Larix gmelinii to climate warming [J]. Chin J Plant Ecol, 2024, 48(4): 459-468. |
| [6] | WU Ru-Ru, LIU Mei-Zhen, GU Xian, CHANG Xin-Yue, GUO Li-Yue, JIANG Gao-Ming, QI Ru-Yi. Prediction of suitable habitat distribution and potential impact of climate change on distribution patterns of Cupressus gigantea [J]. Chin J Plant Ecol, 2024, 48(4): 445-458. |
| [7] | YANG Yu-Meng, LAI Quan, LIU Xin-Yi. Quantitative analysis of climate change and human activities on vegetation gross primary productivity in Nei Mongol, China [J]. Chin J Plant Ecol, 2024, 48(3): 306-316. |
| [8] | ZHANG Qi, CHENG Xue-Han, WANG Shu-Zhi. History of forest disturbance recorded by old trees in Xishan Mountain, Beijing [J]. Chin J Plant Ecol, 2024, 48(3): 341-348. |
| [9] | WU Han, BAI Jie, LI Jun-Li, Guli JIAPAER, BAO An-Ming. Study of spatio-temporal variation in fractional vegetation cover and its influencing factors in Xinjiang, China [J]. Chin J Plant Ecol, 2024, 48(1): 41-55. |
| [10] | CHEN Xue-Ping, ZHAO Xue-Yong, ZHANG Jing, WANG Rui-Xiong, LU Jian-Nan. Variation of NDVI spatio-temporal characteristics and its driving factors based on geodetector model in Horqin Sandy Land, China [J]. Chin J Plant Ecol, 2023, 47(8): 1082-1093. |
| [11] | REN Pei-Xin, LI Peng, PENG Chang-Hui, ZHOU Xiao-Lu, YANG Ming-Xia. Temporal and spatial variation of vegetation photosynthetic phenology in Dongting Lake basin and its response to climate change [J]. Chin J Plant Ecol, 2023, 47(3): 319-330. |
| [12] | LI Jie, HAO Min-Hui, FAN Chun-Yu, ZHANG Chun-Yu, ZHAO Xiu-Hai. Effect of tree species and functional diversity on ecosystem multifunctionality in temperate forests of northeast China [J]. Chin J Plant Ecol, 2023, 47(11): 1507-1522. |
| [13] | MIAO Li-Juan, ZHANG Yu-Yang, CHUAI Xiao-Wei, BAO Gang, HE Yu, ZHU Jing-Wen. Effects of climatic factors and their time-lag on grassland NDVI in Asian drylands [J]. Chin J Plant Ecol, 2023, 47(10): 1375-1385. |
| [14] | ZHU Yu-Ying, ZHANG Hua-Min, DING Ming-Jun, YU Zi-Ping. Changes of vegetation greenness and its response to drought-wet variation on the Qingzang Plateau [J]. Chin J Plant Ecol, 2023, 47(1): 51-64. |
| [15] | WEI Yao, MA Zhi-Yuan, ZHOU Jia-Ying, ZHANG Zhen-Hua. Experimental warming changed reproductive phenology and height of alpine plants on the Qingzang Plateau [J]. Chin J Plant Ecol, 2022, 46(9): 995-1004. |
| Viewed | ||||||
|
Full text |
|
|||||
|
Abstract |
|
|||||
Copyright © 2026 Chinese Journal of Plant Ecology
Tel: 010-62836134, 62836138, E-mail: apes@ibcas.ac.cn, cjpe@ibcas.ac.cn
![]()