
Chin J Plant Ecol ›› 2011, Vol. 35 ›› Issue (11): 1091-1105.DOI: 10.3724/SP.J.1258.2011.01091
• Research Articles • Next Articles
ZHANG Lei1, LIU Shi-Rong1,*( ), SUN Peng-Sen1, WANG Tong-Li2
Received:2010-11-26
Accepted:2011-04-22
Online:2011-11-26
Published:2011-11-07
Contact:
LIU Shi-Rong
ZHANG Lei, LIU Shi-Rong, SUN Peng-Sen, WANG Tong-Li. Comparative evaluation of multiple models of the effects of climate change on the potential distribution of Pinus massoniana[J]. Chin J Plant Ecol, 2011, 35(11): 1091-1105.
Add to citation manager EndNote|Ris|BibTeX
URL: https://www.plant-ecology.com/EN/10.3724/SP.J.1258.2011.01091
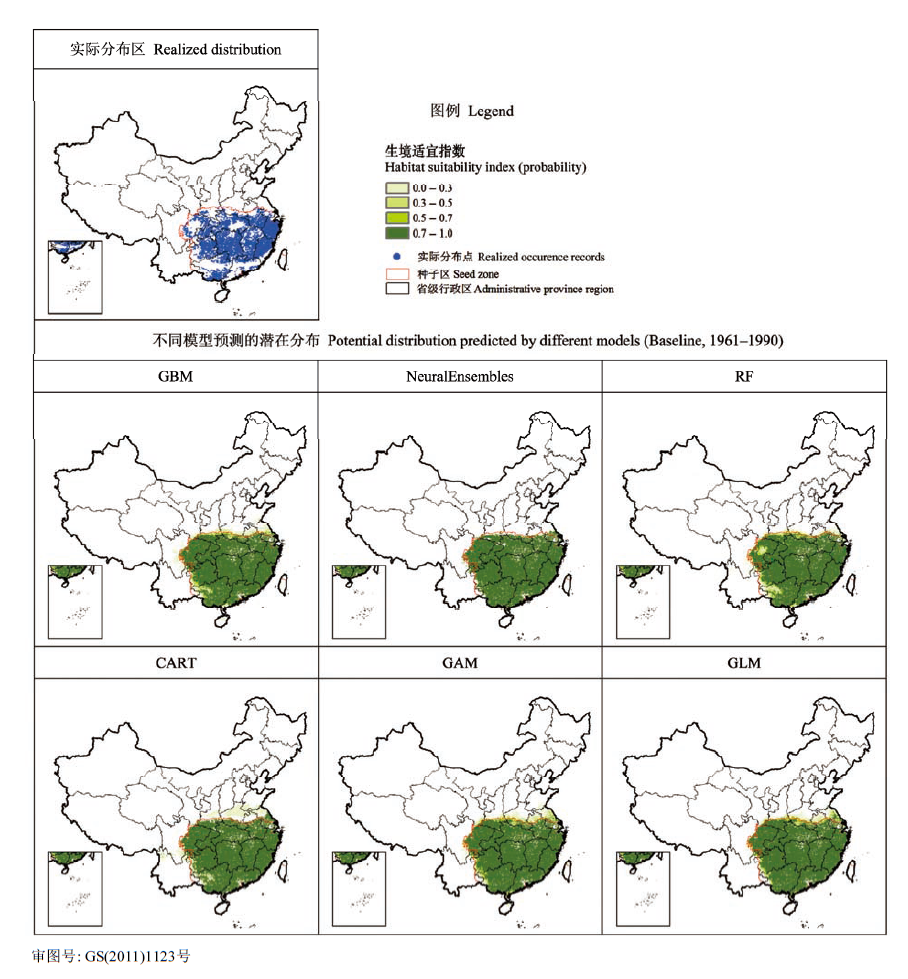
Fig. 1 Potential distribution maps for Pinus massoniana predicted by different models under baseline climate (1961-1990). CART, classification and regression tree; GAM, generalized additive model; GBM, generalized boosted model; GLM, generalized linear model; RF, random forest.
| 评估指标 Evaluation index | 模型类型 Model type | |||||
|---|---|---|---|---|---|---|
| RF | GBM | NeuralEnsembles | GAM | GLM | CART | |
| AUC | 1.000 | 1.000 | 0.994 | 1.000 | 0.999 | 0.995 |
| Kappa | 0.996 | 0.990 | 0.985 | 0.985 | 0.983 | 0.980 |
| TSS | 0.997 | 0.992 | 0.989 | 0.987 | 0.986 | 0.982 |
Table 1 Predictive accuracy of model
| 评估指标 Evaluation index | 模型类型 Model type | |||||
|---|---|---|---|---|---|---|
| RF | GBM | NeuralEnsembles | GAM | GLM | CART | |
| AUC | 1.000 | 1.000 | 0.994 | 1.000 | 0.999 | 0.995 |
| Kappa | 0.996 | 0.990 | 0.985 | 0.985 | 0.983 | 0.980 |
| TSS | 0.997 | 0.992 | 0.989 | 0.987 | 0.986 | 0.982 |
| 模型类型 Model type | CA (km) | JP (km) | NW (km) | |||||||||||||||||
|---|---|---|---|---|---|---|---|---|---|---|---|---|---|---|---|---|---|---|---|---|
| 2020s | 2050s | 2080s | 2020s | 2050s | 2080s | 2020s | 2050s | 2080s | ||||||||||||
| CART | 28 | 41 | 61 | 15 | 21 | 35 | 6 | 12 | 22 | |||||||||||
| GAM | 28 | 46 | 76 | 25 | 43 | 88 | 6 | 17 | 39 | |||||||||||
| GBM | 33 | 43 | 64 | 25 | 38 | 50 | 12 | 22 | 38 | |||||||||||
| GLM | 12 | 15 | 40 | 10 | 20 | 44 | 1 | 4 | 6 | |||||||||||
| NeuralEnsembles | 65 | 88 | 142 | 61 | 95 | 154 | 26 | 56 | 87 | |||||||||||
| RF | 45 | 54 | 82 | 34 | 50 | 74 | 17 | 29 | 45 | |||||||||||
Table 2 Northward shifting distance for Pinus massoniana under future climate
| 模型类型 Model type | CA (km) | JP (km) | NW (km) | |||||||||||||||||
|---|---|---|---|---|---|---|---|---|---|---|---|---|---|---|---|---|---|---|---|---|
| 2020s | 2050s | 2080s | 2020s | 2050s | 2080s | 2020s | 2050s | 2080s | ||||||||||||
| CART | 28 | 41 | 61 | 15 | 21 | 35 | 6 | 12 | 22 | |||||||||||
| GAM | 28 | 46 | 76 | 25 | 43 | 88 | 6 | 17 | 39 | |||||||||||
| GBM | 33 | 43 | 64 | 25 | 38 | 50 | 12 | 22 | 38 | |||||||||||
| GLM | 12 | 15 | 40 | 10 | 20 | 44 | 1 | 4 | 6 | |||||||||||
| NeuralEnsembles | 65 | 88 | 142 | 61 | 95 | 154 | 26 | 56 | 87 | |||||||||||
| RF | 45 | 54 | 82 | 34 | 50 | 74 | 17 | 29 | 45 | |||||||||||
| 模型类型 Model type | CA (m) | JP (m) | NW (m) | |||||||||
|---|---|---|---|---|---|---|---|---|---|---|---|---|
| 2020s | 2050s | 2080s | 2020s | 2050s | 2080s | 2020s | 2050s | 2080s | ||||
| CART | 23 | 23 | 57 | 15 | 29 | 60 | 12 | 20 | 42 | |||
| GAM | 7 | 2 | 13 | -1 | 1 | 5 | 3 | 8 | 12 | |||
| GBM | 16 | 26 | 55 | 9 | 24 | 55 | 8 | 20 | 46 | |||
| GLM | 15 | 9 | 11 | 8 | 11 | 12 | 10 | 16 | 22 | |||
| NeuralEnsembles | -7 | 0 | 35 | -10 | 0 | 21 | -2 | 1 | 17 | |||
| RF | 3 | 8 | 42 | -6 | 4 | 34 | -4 | 3 | 22 | |||
Table 3 Upward shifting at optimum elevation for Pinus massoniana under future climate
| 模型类型 Model type | CA (m) | JP (m) | NW (m) | |||||||||
|---|---|---|---|---|---|---|---|---|---|---|---|---|
| 2020s | 2050s | 2080s | 2020s | 2050s | 2080s | 2020s | 2050s | 2080s | ||||
| CART | 23 | 23 | 57 | 15 | 29 | 60 | 12 | 20 | 42 | |||
| GAM | 7 | 2 | 13 | -1 | 1 | 5 | 3 | 8 | 12 | |||
| GBM | 16 | 26 | 55 | 9 | 24 | 55 | 8 | 20 | 46 | |||
| GLM | 15 | 9 | 11 | 8 | 11 | 12 | 10 | 16 | 22 | |||
| NeuralEnsembles | -7 | 0 | 35 | -10 | 0 | 21 | -2 | 1 | 17 | |||
| RF | 3 | 8 | 42 | -6 | 4 | 34 | -4 | 3 | 22 | |||
| 模型类型 Model type | 消失面积 Area lost (%) | 新增面积 New area (%) | 总面积变化 Total area change (%) | |||||||
|---|---|---|---|---|---|---|---|---|---|---|
| 2020s | 2050s | 2080s | 2020s | 2050s | 2080s | 2020s | 2050s | 2080s | ||
| CART | CA | 2.8 | 2.2 | 2.4 | 5.9 | 9.0 | 13.6 | 3.1 | 6.8 | 11.2 |
| JP | 0.9 | 1.0 | 1.0 | 4.8 | 6.7 | 11.0 | 3.8 | 5.7 | 10.0 | |
| NW | 1.0 | 0.8 | 0.6 | 3.1 | 5.0 | 8.3 | 2.1 | 4.2 | 7.6 | |
| GAM | CA | 0.9 | 0.3 | 0.4 | 5.6 | 10.6 | 18.1 | 4.7 | 10.3 | 17.7 |
| JP | 0.1 | 0.1 | 0.2 | 6.4 | 9.9 | 19.1 | 6.3 | 9.8 | 18.9 | |
| NW | 0.1 | 0.1 | 0.1 | 3.1 | 5.8 | 11.2 | 3.0 | 5.7 | 11.1 | |
| GBM | CA | 1.9 | 1.9 | 3.0 | 5.0 | 6.6 | 8.5 | 3.1 | 4.8 | 5.5 |
| JP | 0.7 | 0.9 | 1.5 | 5.3 | 7.2 | 8.8 | 4.6 | 6.3 | 7.4 | |
| NW | 0.5 | 0.7 | 1.1 | 3.4 | 5.0 | 8.3 | 2.9 | 4.4 | 7.2 | |
| GLM | CA | 1.1 | 0.3 | 0.3 | 3.9 | 7.4 | 14.7 | 2.7 | 7.1 | 14.4 |
| JP | 0.5 | 0.1 | 0.2 | 4.3 | 7.9 | 15.6 | 3.8 | 7.7 | 15.4 | |
| NW | 0.4 | 0.1 | 0.1 | 2.6 | 4.9 | 9.4 | 2.2 | 4.8 | 9.3 | |
| NeuralEnsembles | CA | 1.1 | 0.3 | 0.3 | 3.9 | 7.4 | 14.7 | 2.8 | 7.1 | 14.4 |
| JP | 0.5 | 0.1 | 0.1 | 4.3 | 7.8 | 15.6 | 3.8 | 7.7 | 15.5 | |
| NW | 0.4 | 0.1 | 0.1 | 2.6 | 4.9 | 9.4 | 2.2 | 4.8 | 9.3 | |
| RF | CA | 2.2 | 2.3 | 2.4 | 11.6 | 15.8 | 23.8 | 9.4 | 13.5 | 21.4 |
| JP | 0.9 | 1.0 | 0.5 | 11.2 | 16.0 | 24.2 | 10.3 | 15.0 | 23.7 | |
| NW | 0.8 | 0.5 | 0.4 | 5.8 | 10.6 | 17.2 | 5.0 | 10.1 | 16.9 | |
Table 4 Potential distribution area change for Pinus massoniana under future climate
| 模型类型 Model type | 消失面积 Area lost (%) | 新增面积 New area (%) | 总面积变化 Total area change (%) | |||||||
|---|---|---|---|---|---|---|---|---|---|---|
| 2020s | 2050s | 2080s | 2020s | 2050s | 2080s | 2020s | 2050s | 2080s | ||
| CART | CA | 2.8 | 2.2 | 2.4 | 5.9 | 9.0 | 13.6 | 3.1 | 6.8 | 11.2 |
| JP | 0.9 | 1.0 | 1.0 | 4.8 | 6.7 | 11.0 | 3.8 | 5.7 | 10.0 | |
| NW | 1.0 | 0.8 | 0.6 | 3.1 | 5.0 | 8.3 | 2.1 | 4.2 | 7.6 | |
| GAM | CA | 0.9 | 0.3 | 0.4 | 5.6 | 10.6 | 18.1 | 4.7 | 10.3 | 17.7 |
| JP | 0.1 | 0.1 | 0.2 | 6.4 | 9.9 | 19.1 | 6.3 | 9.8 | 18.9 | |
| NW | 0.1 | 0.1 | 0.1 | 3.1 | 5.8 | 11.2 | 3.0 | 5.7 | 11.1 | |
| GBM | CA | 1.9 | 1.9 | 3.0 | 5.0 | 6.6 | 8.5 | 3.1 | 4.8 | 5.5 |
| JP | 0.7 | 0.9 | 1.5 | 5.3 | 7.2 | 8.8 | 4.6 | 6.3 | 7.4 | |
| NW | 0.5 | 0.7 | 1.1 | 3.4 | 5.0 | 8.3 | 2.9 | 4.4 | 7.2 | |
| GLM | CA | 1.1 | 0.3 | 0.3 | 3.9 | 7.4 | 14.7 | 2.7 | 7.1 | 14.4 |
| JP | 0.5 | 0.1 | 0.2 | 4.3 | 7.9 | 15.6 | 3.8 | 7.7 | 15.4 | |
| NW | 0.4 | 0.1 | 0.1 | 2.6 | 4.9 | 9.4 | 2.2 | 4.8 | 9.3 | |
| NeuralEnsembles | CA | 1.1 | 0.3 | 0.3 | 3.9 | 7.4 | 14.7 | 2.8 | 7.1 | 14.4 |
| JP | 0.5 | 0.1 | 0.1 | 4.3 | 7.8 | 15.6 | 3.8 | 7.7 | 15.5 | |
| NW | 0.4 | 0.1 | 0.1 | 2.6 | 4.9 | 9.4 | 2.2 | 4.8 | 9.3 | |
| RF | CA | 2.2 | 2.3 | 2.4 | 11.6 | 15.8 | 23.8 | 9.4 | 13.5 | 21.4 |
| JP | 0.9 | 1.0 | 0.5 | 11.2 | 16.0 | 24.2 | 10.3 | 15.0 | 23.7 | |
| NW | 0.8 | 0.5 | 0.4 | 5.8 | 10.6 | 17.2 | 5.0 | 10.1 | 16.9 | |
| 差异来源 Source of variation | 自由度 Degrees of freedom | F | p | |
|---|---|---|---|---|
| 分子 Numerator | 分母 Denominator | |||
| 截距 Intercept | 1 | 44 | 10.114 65 | 0.002 7 |
| 物种分布模型 Species distribution model | 5 | 44 | 25.867 31 | <0.000 1 |
| 大气环流模型 Global circulation model | 2 | 44 | 17.121 49 | <0.000 1 |
Table 5 Analysis of variance with species distribution model (SDM) and global circulation model (GCM) effects on change of predicted distribution area
| 差异来源 Source of variation | 自由度 Degrees of freedom | F | p | |
|---|---|---|---|---|
| 分子 Numerator | 分母 Denominator | |||
| 截距 Intercept | 1 | 44 | 10.114 65 | 0.002 7 |
| 物种分布模型 Species distribution model | 5 | 44 | 25.867 31 | <0.000 1 |
| 大气环流模型 Global circulation model | 2 | 44 | 17.121 49 | <0.000 1 |
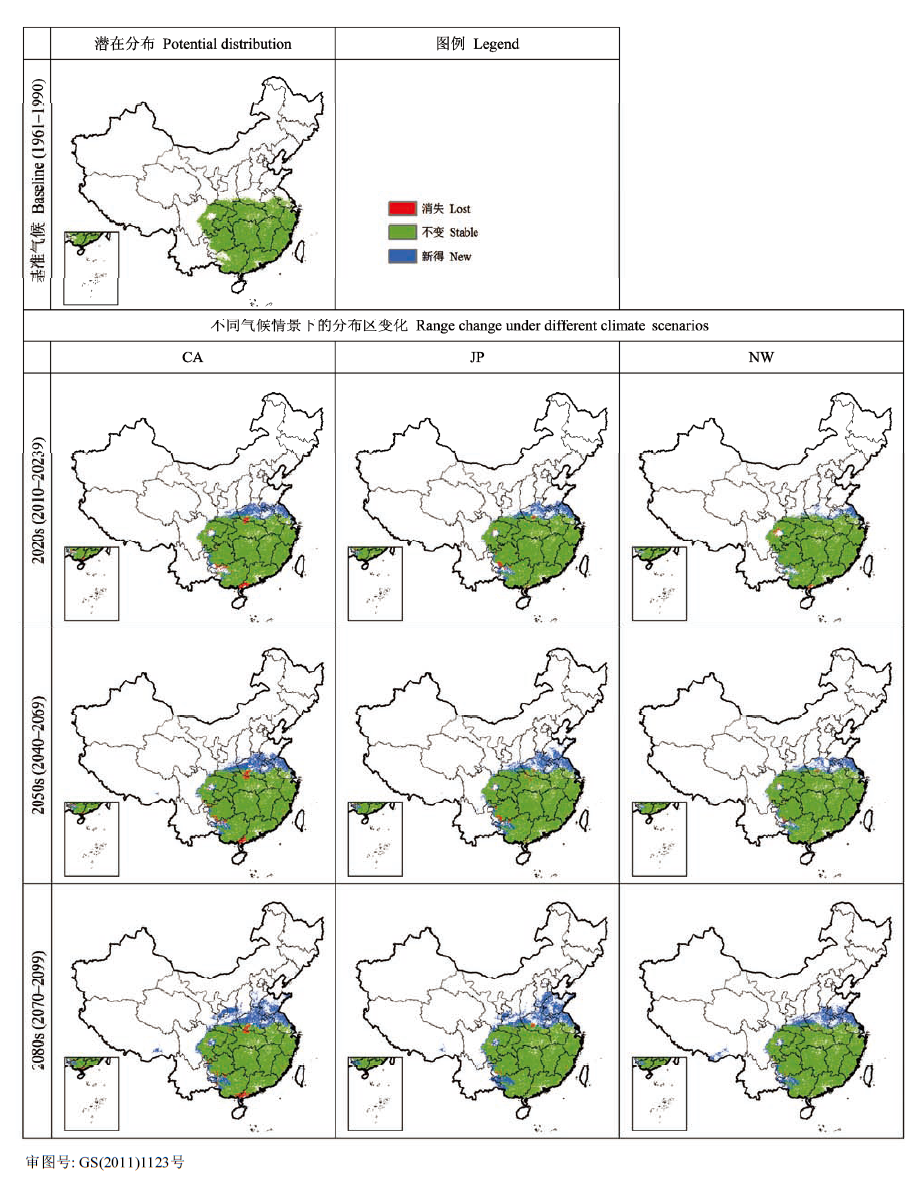
Fig. 2 Potential distribution area change for Pinus massoniana under future climate as predicted by random forest. CA, JP and NW see Table 2.
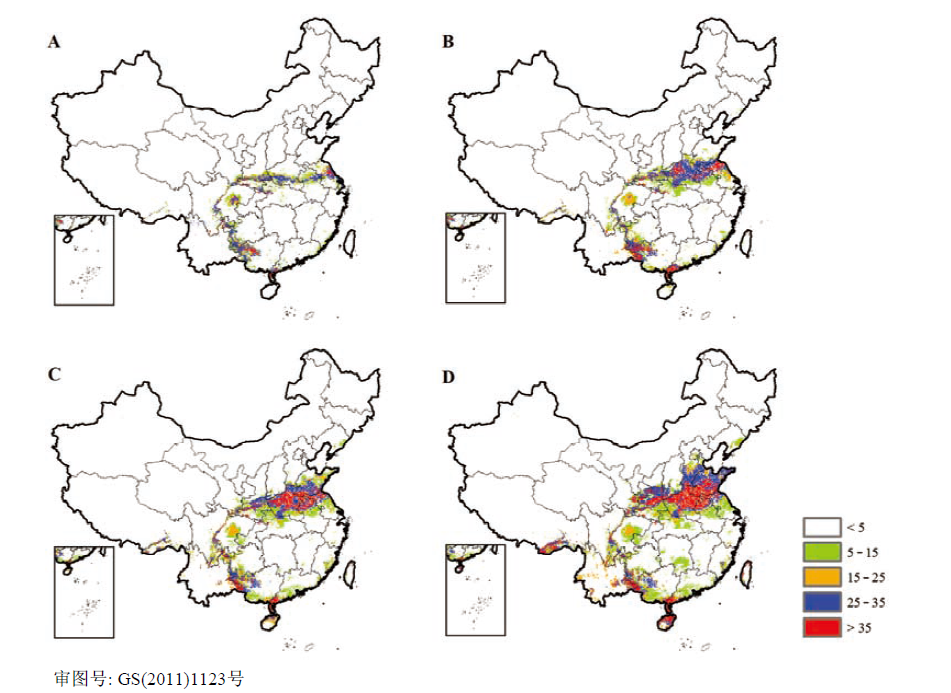
Fig. 3 Spatial patterns in standard deviations (%) of potential habitat suitability calculated across six current predictions under baseline climate (A) and 18 future projections (%) (6 models × 3 GCMs) (B, 2020s; C, 2050s; D, 2080s).
| [1] | Allouche O, Tsoar A, Kadmon R (2006). Assessing the acc- uracy of species distribution models: prevalence, Kappa and the true skill statistic (TSS). Journal of Applied Ecology, 43,1223-1232. |
| [2] | Barry S, Elith J (2006). Error and uncertainty in habitat models. Journal of Applied Ecology, 43,413-423. |
| [3] |
Beaumont LJ, Hughes L, Pitman AJ (2008). Why is the choice of future climate scenarios for species distribution modelling important? Ecology Letters, 11,1135-1146.
DOI URL PMID |
| [4] | Breiman L (2001). Random forests. Machine Learning, 45,5-32. |
| [5] | Breiman L, Cutler A (2004). Random forests. http://www.stat.berkeley.edu/users/breiman/RandomForests/cc_home.htm.Cited 10 Oct.2010. |
| [6] | Buisson L, Thuiller W, Casajus N, Lek S, Grenouillet G (2010). Uncertainty in ensemble forecasting of species distribution. Global Change Biology, 16,1145-1157. |
| [7] | Cao MC (曹铭昌), Zhou GS (周广胜), Weng ES (翁恩生) (2005). Application and comparison of generalized models and classification and regression tree in simulating tree species distribution. Acta Ecologica Sinica(生态学报), 25,2031-2040. (in Chinese with English abstract) |
| [8] | Chefaoui RM, Lobo JM (2008). Assessing the effects of pseudo-absences on predictive distribution model perfor- mance. Ecological Modeling, 210,478-486. |
| [9] | Chuine I, Beaubien EG (2001). Phenology is a major determinant of tree species range. Ecology Letters, 4,500-510. |
| [10] | Clemen RT (1989). Combining forecasts: a review and annotated bibliography. International Journal of Fore- casting, 5,559-583. |
| [11] | Cohen J (1960). A coefficient of agreement for nominal scales. Educational and Psychological Measurement, 20,37-46. |
| [12] | Daly C, Gibson WP, Taylor GH, Johnson GL, Pasteris P (2002). A knowledge-based approach to the statistical mapping of climate. Climate Research, 22,99-113. |
| [13] | Editorial Board of Vegetation Map of China,Chinese Academy of Sciences (中国科学院中国植被图编辑委员会) (2001). 1 : 1 Million Vegetation Atlas of China (中国植被图集 1 : 1 000 000). Science Press, Beijing. (in Chinese) |
| [14] | Elith J, Graham CH, Anderson RP, Dudík M, Ferrier S, Guisan A, Hijmans RJ, Huettmann F, Leathwick JR, Lehmann A, Li J, Lohmann LG, Loiselle BA, Manion G, Moritz C, Nakamura M, Nakazawa Y, Overton JM, Peterson AT, Phillips SJ, Richardson K, Scachetti-Pereira R, Schapire RE, Soberón J, Williams S, Wisz MS, Zimmermann NE (2006). Novel methods improve prediction of species’ distributions from occurrence data. Ecography, 29,129-151. |
| [15] | Elith J, Leathwick J, Hastie T (2008). A working guide to boosted regression trees. Journal of Animal Ecology, 77,802-813. |
| [16] | Fielding AH, Bell JF (1997). A review of methods for the assessment of prediction errors in conservation presence/ absence models. Environmental Conservation, 24,38-49. |
| [17] | Friedman JH (2001). Greedy function approximation: a gradient boosting machine. The Annals of Statistics, 29,1189-1232. |
| [18] | Granitto PM, Verdes PF, Ceccatto HA (2005). Neural network ensembles: evaluation of aggregation algorithms. Artificial Intelligence, 163,139-162. |
| [19] | Guisan A, Zimmermann NE (2000). Predictive habitat distribution models in ecology. Ecological Modeling, 135,147-186. |
| [20] | He QT (贺庆棠), Yuan JZ (袁嘉祖), Chen ZB (陈志泊) (1996). Possible effects of the climate changes on the distribution of Pinus massoniana and Pinus yunnanensis in South China. Journal of Beijing Forestry University (北京林业大学学报), 18(1),22-28. (in Chinese with English abstract) |
| [21] | Hernandez PA, Graham CH, Master LL, Albert DL (2006). The effect of sample size and species characteristics on performance of different species distribution modeling methods. Ecography, 29,773-785. |
| [22] | IPCC Intergovernmental Panel on Climate Change (2007). Summary for policymakers. In: Solomon S, Qin D, Manning M, Chen Z, Marquis M, Averyt KB, Tignor M, Miller HL eds. Climate Change 2007: The Physical Science Basis. Contribution of Working Group I to the Fourth Assessment Report of the Intergovernmental Panel on Climate Change. Cambridge University Press, New York. |
| [23] | Iverson LR, Prasad AM, Matthews SN, Peters M (2008). Estimating potential habitat for 134 eastern US tree species under six climate scenarios. Forest Ecology and Management, 254,390-406. |
| [24] | Jiang ZH (江志红), Zhang X (张霞), Wang J (王冀) (2008). Projection of climate change in China in the 21st century by IPCC-AR4 Models. Geographical Research (地理研究), 27,787-799. (in Chinese with English abstract) |
| [25] | Lawler JJ, White D, Neilson RP, Blaustein AR (2006). Predicting climate-induced range shifts: model differences and model reliability. Global Change Biology, 12,1568-1584. |
| [26] |
Lenoir J, Gégout JC, Marquet PA, de Ruffray P, Brisse H (2008). A significant upward shift in plant species optimum elevation during the 20th century. Science, 320,1768-1771.
URL PMID |
| [27] | Li B (李博), Zhou TJ (周天军) (2010). Projected climate change over China under SRES A1B scenario: multi- model ensemble and uncertainties. Advances in Climate Change Research (气候变化研究进展), 6,270-276. (in Chinese with English abstract) |
| [28] | Li F (李峰), Zhou GS (周广胜), Cao MC (曹铭昌) (2006). Responses of Larix gmelinii geographical distribution to future climate change: a simulation study. Chinese Journal of Applied Ecology (应用生态学报), 17,2255-2260. (in Chinese with English abstract) |
| [29] | Liaw A, Wiener M (2002). Classification and regression by randomForest. R News, 2(3),18-22. |
| [30] | Lü JJ (吕佳佳), Wu JG (吴建国) (2009). Advances in the effects of climate change on the distribution of plant species and vegetation in China. Environmental Science & Technology (环境科学与技术), 32(6),85-95. (in Chinese with English abstract) |
| [31] | Mitchell TD, Jones PD (2005). An improved method of constructing a database of monthly climate observations and associated high-resolution grids. International Journal of Climatology, 25,693-712. |
| [32] | Monserud RA, Leemans R (1992). Comparing global vegeta- tion maps with the Kappa statistic. Ecological Modelling, 62,275-293. |
| [33] | Nix HA (1986). A biogeographic analysis of Australian Elapid snakes. In: Longmore R ed. Atlas of Elapid Snakes of Australia. Australian Government Publishing Service, Canberra. 4-15. |
| [34] | O’Hanley JR (2009). NeuralEnsembles: a neural network based ensemble forecasting program for habitat and bioclimatic suitability analysis. Ecography, 32,89-93. |
| [35] |
Parmesan C, Yohe G (2003). A globally coherent fingerprint of climate change impacts across natural systems. Nature, 421,37-42.
DOI URL PMID |
| [36] | Pearson RG, Dawson TP (2003). Predicting the impacts of climate change on the distribution of species: Are bioclimate envelope models useful? Global Ecology & Biogeography, 12,361-371. |
| [37] | Peñuelas J, Boada M (2003). A global change-induced biome shift in the Montseny mountains (NE Spain). Global Change Biology, 9,131-140. |
| [38] | R Development Core Team (2010). R: A Language and Environment for Statistical Computing. R Foundation for Statistical Computing, Vienna, Austria. ISBN3-900051-07-0, http://www.R-project.org. |
| [39] | Ridgeway G (1999). The state of boosting. In: Berk K, Pourahmadi M eds. Computing Science and Statistics 31. Interface Foundation of North America, Fairfax Station. 172-181. |
| [40] | Ridgeway G (2007). gbm: generalized boosted regression models. R Package Version 1.6-3. http://www.i-pensieri.com/gregr/gbm.shtml. |
| [41] |
Root TL, Price JT, Hall KR, Schneider SH, Rosenzweig C, Pounds JA (2003). Fingerprints of global warming on wild animals and plants. Nature, 421,57-60.
DOI URL PMID |
| [42] | Shao H (邵慧), Tian JQ (田佳倩), Guo K (郭柯), Sun OJ (孙建新) (2009). Effects of sample size and species traits on performance of Bioclim in predicting geographical distribution of tree species—a case study with 12 deciduousQuercus species indigenous to China. Chinese Journal of Plant Ecology (植物生态学报), 33,870-877. (in Chinese with English abstract) |
| [43] | Shoo LP, Williams SE, Hero JM (2006). Detecting climate change induced range shifts: Where and how should we be looking? Austral Ecology, 31,22-29. |
| [44] |
Swets JA (1988). Measuring the accuracy of diagnostic systems. Science, 240,1285-1293.
DOI URL PMID |
| [45] | ter Braak CJF, Looman CWN (1986). Weighted averaging, logistic regression and the Gaussian response model. Plant Ecology, 65,3-11. |
| [46] | Václavík T, Meentemeyer RK (2009). Invasive species distribution modeling (iSDM): Are absence data and dispersal constraints needed to predict actual distribu- tions? Ecological Modeling, 220,3248-3258. |
| [47] | Wang J (王娟), Ni J (倪健) (2006). Review of modelling the distribution of plant species. Journal of Plant Ecology (Chinese Version) (植物生态学报), 30,1040-1053. (in Chinese with English abstract) |
| [48] | Wang T, Hamann A, Spittlehouse DL, Aitken SN (2006). Development of scale-free climate data for Western Canada for use in resource management. International Journal of Climatology, 26,383-397. |
| [49] | Webb T III, Bartlein PJ (1992). Global changes during the last 3 million years: climatic controls and biotic responses. Annual Review of Ecology and Systematics, 23,141-173. |
| [50] |
Wisz MS, Guisan A (2009). Do pseudo-absence selection strategies influence species distribution models and their predictions? An information-theoretic approach based on simulated data. BMC Ecology,doi: $10.1186/1472-6785-9-8.
URL PMID |
| [51] | Wisz MS, Hijmans RJ, Li J, Peterson AT, Graham CH, Guisan A (2008). Effects of sample size on the performance of species distribution models. Diversity and Distributions, 14,763-773. |
| [52] | Wu JG (吴建国), Lü JJ (吕佳佳) (2009). Potential effects of climate change on the distribution of Dove Trees ( Davidia involucrata Baill) in China. Research of Environmental Sciences (环境科学研究), 22,1371-1381. (in Chinese with English abstract) |
| [53] | Xu DY (徐德应), Guo QS (郭泉水), Yan H (闫洪) (1997). A Study on the Impacts of Climate Change on Forests in China(气候变化对中国森林影响研究). China Scientific and Technical Press, Beijing. (in Chinese) |
| [54] |
Xu DY, Yan H (2001). A study of the impacts of climate change on the geographic distribution of Pinus koraiensis in China. Environment International, 27,201-205.
DOI URL PMID |
| [1] | Yi-Heng Chen Yusupjan Rusul 吾斯曼 阿卜杜热合曼. Analysis of spatial and temporal variation in grassland vegetation cover in the Tianshan Mountains and the driving factors from 2001 to 2020 [J]. Chin J Plant Ecol, 2024, 48(5): 561-576. |
| [2] | ZHANG Ji-Shen, SHI Xin-Jie, LIU Yu-Nuo, WU Yang, PENG Shou-Zhang. Dynamics of ecosystem carbon storage of potential natural vegetation in China under climate change [J]. Chin J Plant Ecol, 2024, 48(4): 428-444. |
| [3] | ZANG Miao-Han, WANG Chuan-Kuan, LIANG Yi-Xian, LIU Yi-Xiao, SHANGGUAN Hong-Yu, QUAN Xian-Kui. Stoichiometric characteristics of leaf, branch and root in Larix gmelinii in response to climate warming based on latitudinal transplantation [J]. Chin J Plant Ecol, 2024, 48(4): 469-482. |
| [4] | LIANG Yi-Xian, WANG Chuan-Kuan, ZANG Miao-Han, SHANGGUAN Hong-Yu, LIU Yi-Xiao, QUAN Xian-Kui. Responses of radial growth and biomass allocation of Larix gmelinii to climate warming [J]. Chin J Plant Ecol, 2024, 48(4): 459-468. |
| [5] | WU Ru-Ru, LIU Mei-Zhen, GU Xian, CHANG Xin-Yue, GUO Li-Yue, JIANG Gao-Ming, QI Ru-Yi. Prediction of suitable habitat distribution and potential impact of climate change on distribution patterns of Cupressus gigantea [J]. Chin J Plant Ecol, 2024, 48(4): 445-458. |
| [6] | ZHANG Qi, CHENG Xue-Han, WANG Shu-Zhi. History of forest disturbance recorded by old trees in Xishan Mountain, Beijing [J]. Chin J Plant Ecol, 2024, 48(3): 341-348. |
| [7] | REN Pei-Xin, LI Peng, PENG Chang-Hui, ZHOU Xiao-Lu, YANG Ming-Xia. Temporal and spatial variation of vegetation photosynthetic phenology in Dongting Lake basin and its response to climate change [J]. Chin J Plant Ecol, 2023, 47(3): 319-330. |
| [8] | LI Jie, HAO Min-Hui, FAN Chun-Yu, ZHANG Chun-Yu, ZHAO Xiu-Hai. Effect of tree species and functional diversity on ecosystem multifunctionality in temperate forests of northeast China [J]. Chin J Plant Ecol, 2023, 47(11): 1507-1522. |
| [9] | WEI Yao, MA Zhi-Yuan, ZHOU Jia-Ying, ZHANG Zhen-Hua. Experimental warming changed reproductive phenology and height of alpine plants on the Qingzang Plateau [J]. Chin J Plant Ecol, 2022, 46(9): 995-1004. |
| [10] | DANG Hong-Zhong, ZHANG Xue-Li, HAN Hui, SHI Chang-Chun, GE Yu-Xiang, MA Quan-Lin, CHEN Shuai, LIU Chun-Ying. Research advances on forest-water relationships in Pinus sylvestris var. mongolica plantations for sand dune immobilization and guidance to forest management practices [J]. Chin J Plant Ecol, 2022, 46(9): 971-983. |
| [11] | LI Xiao, PIALUANG Bounthong, KANG Wen-Hui, JI Xiao-Dong, ZHANG Hai-Jiang, XUE Zhi-Guo, ZHANG Zhi-Qiang. Responses of radial growth to climate change over the past decades in secondary Betula platyphylla forests in the mountains of northwest Hebei, China [J]. Chin J Plant Ecol, 2022, 46(8): 919-931. |
| [12] | SU Qi-Tao, DU Zhi-Xuan, ZHOU Bing, LIAO Yong-Hui, WANG Cheng-Cheng, XIAO Yi-An. Potential distribution of Impatiens davidii and its pollinator in China [J]. Chin J Plant Ecol, 2022, 46(7): 785-796. |
| [13] | HU Xiao-Fei, WEI Lin-Feng, CHENG Qi, WU Xing-Qi, NI Jian. A climate diagram atlas of Qingzang Plateau [J]. Chin J Plant Ecol, 2022, 46(4): 484-492. |
| [14] | YUAN Yuan, MU Yan-Mei, DENG Yu-Jie, LI Xin-Hao, JIANG Xiao-Yan, GAO Sheng-Jie, ZHA Tian- Shan, JIA Xin. Effects of land cover and phenology changes on the gross primary productivity in an Artemisia ordosica shrubland [J]. Chin J Plant Ecol, 2022, 46(2): 162-175. |
| [15] | CONG Nan, ZHANG Yang-Jian, ZHU Jun-Tao. Temperature sensitivity of vegetation phenology in spring in mid- to high-latitude regions of Northern Hemisphere during the recent three decades [J]. Chin J Plant Ecol, 2022, 46(2): 125-135. |
| Viewed | ||||||
|
Full text |
|
|||||
|
Abstract |
|
|||||
Copyright © 2022 Chinese Journal of Plant Ecology
Tel: 010-62836134, 62836138, E-mail: apes@ibcas.ac.cn, cjpe@ibcas.ac.cn