
Chin J Plant Ecol ›› 2017, Vol. 41 ›› Issue (9): 925-937.DOI: 10.17521/cjpe.2016.0177 cstr: 32100.14.cjpe.2016.0177
Special Issue: 全球变化与生态系统; 青藏高原植物生态学:生态系统生态学
• Research Articles • Next Articles
Ya-Lin WANG1,2,*( ), Rong GONG2, Feng-Min WU1, Wen-Wu FAN1
Received:2016-05-24
Revised:2017-08-26
Online:2017-09-10
Published:2017-10-23
Contact:
Ya-Lin WANG
Ya-Lin WANG, Rong GONG, Feng-Min WU, Wen-Wu FAN. Temporal and spatial variation characteristics of China shrubland net primary production and its response to climate change from 2001 to 2013[J]. Chin J Plant Ecol, 2017, 41(9): 925-937.
Add to citation manager EndNote|Ris|BibTeX
URL: https://www.plant-ecology.com/EN/10.17521/cjpe.2016.0177
| DCDSMT | DCDSTP | DSRTHC | DSRTTP | EVGNMT | EVGNST | |
|---|---|---|---|---|---|---|
| 实际面积 Actual area (km2) | 87 701 | 163 077 | 113 031 | 1 068 218 | 188 952 | 467 142 |
| 实际计算面积 Actual calculated area (km2) | 81 029 | 153 349 | 12 409 | 203 125 | 178 435 | 449 461 |
Table 1 The actual area and actual calculated area of different shrubland types
| DCDSMT | DCDSTP | DSRTHC | DSRTTP | EVGNMT | EVGNST | |
|---|---|---|---|---|---|---|
| 实际面积 Actual area (km2) | 87 701 | 163 077 | 113 031 | 1 068 218 | 188 952 | 467 142 |
| 实际计算面积 Actual calculated area (km2) | 81 029 | 153 349 | 12 409 | 203 125 | 178 435 | 449 461 |
| 灌木类型 Shrubland type | 平均净初级生产力 Mean net primary production (g•m-2•a-1) | 平均净初级生产力总量 Mean total net primary production (Tg) |
|---|---|---|
| DCDSMT | 252.28 ± 8.64 | 20.44 ± 0.70 |
| DCDSTP | 247.24 ± 14.12 | 37.91 ± 2.17 |
| DSRTHC | 52.65 ± 3.05 | 0.65 ± 0.04 |
| DSRTTP | 72.33 ± 5.67 | 14.69 ± 1.15 |
| EVGNMT | 288.07 ± 11.84 | 51.40 ± 2.11 |
| EVGNST | 420.47 ± 16.96 | 188.98 ± 7.62 |
| CONTRY | 281.82 ± 10.13 | 302.94 ± 10.89 |
Table 2 China shrubland mean net primary production and mean total net primary production from 2001 to 2013 (mean ± SD)
| 灌木类型 Shrubland type | 平均净初级生产力 Mean net primary production (g•m-2•a-1) | 平均净初级生产力总量 Mean total net primary production (Tg) |
|---|---|---|
| DCDSMT | 252.28 ± 8.64 | 20.44 ± 0.70 |
| DCDSTP | 247.24 ± 14.12 | 37.91 ± 2.17 |
| DSRTHC | 52.65 ± 3.05 | 0.65 ± 0.04 |
| DSRTTP | 72.33 ± 5.67 | 14.69 ± 1.15 |
| EVGNMT | 288.07 ± 11.84 | 51.40 ± 2.11 |
| EVGNST | 420.47 ± 16.96 | 188.98 ± 7.62 |
| CONTRY | 281.82 ± 10.13 | 302.94 ± 10.89 |
| TS | Z | 净初级生产力的变化趋势 Trend of net primary production | 占总面积比例 Percentage of total area (%) |
|---|---|---|---|
| >0 | >1.96 | 显著增加 Significantly increased | 13.14 |
| >0 | -1.96-1.96 | 不显著增加 Insignificantly increased | 58.09 |
| 0 | -1.96-1.96 | 基本不变 Essentially unchanged | 0.01 |
| <0 | -1.96-1.96 | 不显著减小 Insignificantly decreased | 26.81 |
| <0 | <-1.96 | 显著减小 Significantly decreased | 1.95 |
Table 3 Statistical results of China shrubland net primary production spatial variation from 2001 to 2013
| TS | Z | 净初级生产力的变化趋势 Trend of net primary production | 占总面积比例 Percentage of total area (%) |
|---|---|---|---|
| >0 | >1.96 | 显著增加 Significantly increased | 13.14 |
| >0 | -1.96-1.96 | 不显著增加 Insignificantly increased | 58.09 |
| 0 | -1.96-1.96 | 基本不变 Essentially unchanged | 0.01 |
| <0 | -1.96-1.96 | 不显著减小 Insignificantly decreased | 26.81 |
| <0 | <-1.96 | 显著减小 Significantly decreased | 1.95 |
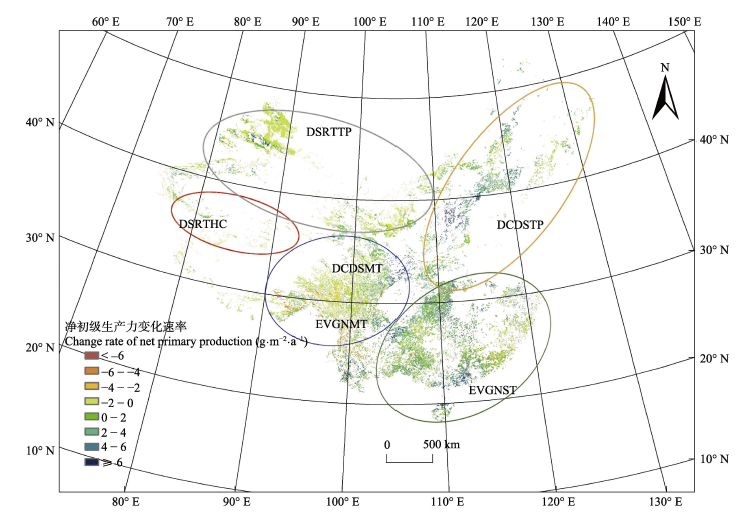
Fig. 1 Spatial distribution of China shrubland net primary production (NPP) change rate from 2001 to 2013. The circles indicate the distribution of different shrubland types. DCDSMT, DCDSTP, DSRTHC, DSRTTP, EVGNMT and EVGNST represent subalpine deciduous, temperate deciduous, high cold desert, temperate desert, subalpine evergreen, and subtropical evergreen shrubland, respectively. DCDSMT and EVGNMT are in one circle because there is no clear boundary between them, DCDSMT mainly distributed in the upper half of the circle and EVNGMT distributed in the bottom half.
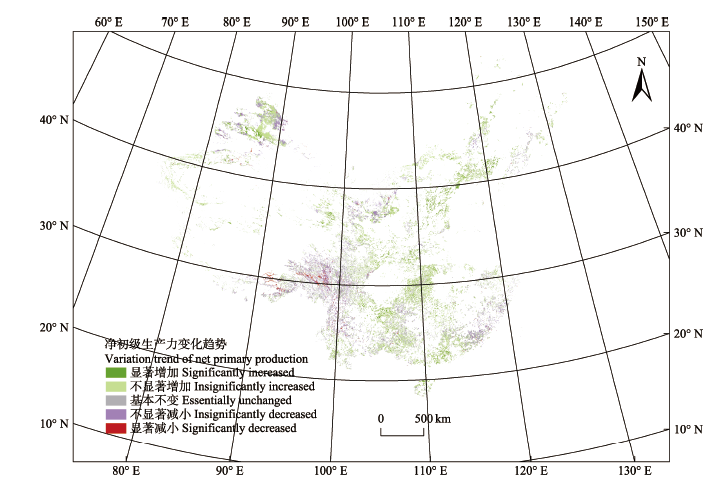
Fig. 2 Spatial characteristics of China shrubland net primary production (NPP) trend from 2001 to 2013.
| 灌木类型 Shrubland type | 年际变化 Interannual change | 春 Spring | 夏 Summer | 秋 Autumn | 冬 Winter | |
|---|---|---|---|---|---|---|
| k (g•m-2•a-1) | ΔR (%) | k (g•m-2•a-1) | ||||
| DCDSMT | 0.37 | 2.02 | 0.16 | 0.39 | -0.21 | NA |
| DCDSTP | 3.05*** | 17.68 | 0.61*** | 1.90** | 0.36** | NA |
| DSRTHC | 0.56*** | 15.58 | 0.10*** | 0.45*** | 0.02 | NA |
| DSRTTP | 0.97** | 19.95 | 0.09* | 0.69** | 0.09** | NA |
| EVGNMT | -0.73* | -3.26 | -0.07 | 0.12 | -0.64*** | -0.01 |
| EVGNST | 1.76** | 5.71 | 0.83* | 0.31 | 0.66** | -0.00 |
| CONTRY | 1.23** | 5.99 | 0.43** | 0.61* | 0.22* | -0.00 |
Table 4 Annual and seasonal trend of shrubland net primary production (NPP) in China from 2001 to 2013
| 灌木类型 Shrubland type | 年际变化 Interannual change | 春 Spring | 夏 Summer | 秋 Autumn | 冬 Winter | |
|---|---|---|---|---|---|---|
| k (g•m-2•a-1) | ΔR (%) | k (g•m-2•a-1) | ||||
| DCDSMT | 0.37 | 2.02 | 0.16 | 0.39 | -0.21 | NA |
| DCDSTP | 3.05*** | 17.68 | 0.61*** | 1.90** | 0.36** | NA |
| DSRTHC | 0.56*** | 15.58 | 0.10*** | 0.45*** | 0.02 | NA |
| DSRTTP | 0.97** | 19.95 | 0.09* | 0.69** | 0.09** | NA |
| EVGNMT | -0.73* | -3.26 | -0.07 | 0.12 | -0.64*** | -0.01 |
| EVGNST | 1.76** | 5.71 | 0.83* | 0.31 | 0.66** | -0.00 |
| CONTRY | 1.23** | 5.99 | 0.43** | 0.61* | 0.22* | -0.00 |
| 年份 Year | 最大光能利用率 Maximum light use efficiency | 净初级生产力 Net primary production (g•m-2•a-1) | 标准化 Standardization | 参考文献 Reference |
|---|---|---|---|---|
| 2001-2013 | 0.429 | 281.82 | 281.82 | 本文 This study |
| 1982-1999 | 0.405 | 257.80 | 273.08 | Piao et al., 2005 |
| 1989-1993 | 0.429 | 367.70 | 367.70 | Zhu et al., 2007 |
| 2001 | 0.389 | 362.38 | 399.64 | Li, 2004 |
Table 5 Comparisons with other study results
| 年份 Year | 最大光能利用率 Maximum light use efficiency | 净初级生产力 Net primary production (g•m-2•a-1) | 标准化 Standardization | 参考文献 Reference |
|---|---|---|---|---|
| 2001-2013 | 0.429 | 281.82 | 281.82 | 本文 This study |
| 1982-1999 | 0.405 | 257.80 | 273.08 | Piao et al., 2005 |
| 1989-1993 | 0.429 | 367.70 | 367.70 | Zhu et al., 2007 |
| 2001 | 0.389 | 362.38 | 399.64 | Li, 2004 |
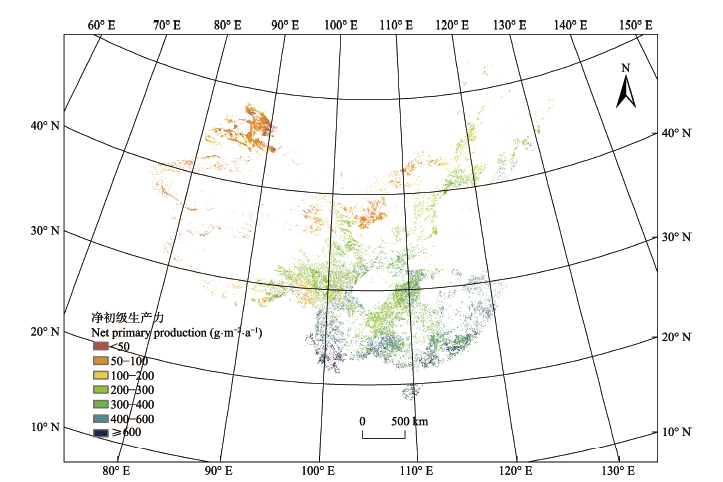
Fig. 3 Spatial distribution of shrubland annual mean net primary production in China from 2001 to 2013.
| 灌木类型 Shrubland type | 平均气温变化速率 Mean temperature change rate (℃∙a-1) | 降水量变化速率 Precipitation change rate (mm∙a-1) | ||||||||
|---|---|---|---|---|---|---|---|---|---|---|
| 年 Annual | 春 Spring | 夏 Summer | 秋 Autumn | 冬 Winter | 年 Annual | 春 Spring | 夏 Summer | 秋 Autumn | 冬 Winter | |
| DCDSMT | 0.026 2 | 0.068 7** | 0.079 9** | 0.011 1 | -0.005 6 | 2.94* | 0.53 | 1.97 | 0.54 | 0.26 |
| DCDSTP | -0.048 6* | -0.045 1 | 0.016 7 | -0.009 1 | -0.013 0*** | 7.57** | 0.90 | 5.24** | 0.77 | 1.04** |
| DSRTHC | 0.020 7 | 0.060 7* | 0.043 5*** | 0.040 6* | -0.019 0 | 1.34** | 0.24 | 0.64 | 0.07 | 0.17** |
| DSRTTP | -0.009 9 | 0.082 3 | -0.013 0 | 0.032 0 | -0.069 8** | 0.38 | -0.28 | 1.11 | -0.11 | 0.32 |
| EVGNMT | 0.030 3 | 0.053 3* | 0.079 8** | 0.006 3 | 0.001 2 | -4.10* | -0.29 | -3.24 | -0.32 | -0.36 |
| EVGNST | -0.016 7 | -0.004 5 | 0.038 0** | -0.001 7 | -0.075 9* | -4.22 | -0.81 | -7.67* | 5.21** | -2.46** |
| CONTRY | -0.006 6 | 0.039 9 | 0.018 3 | -0.002 0 | -0.081 1** | -0.02 | -0.24 | -0.80 | 1.25** | -0.49** |
Table 6 Temporal trend of China shrubland precipitation and mean temperature from 2001 to 2013
| 灌木类型 Shrubland type | 平均气温变化速率 Mean temperature change rate (℃∙a-1) | 降水量变化速率 Precipitation change rate (mm∙a-1) | ||||||||
|---|---|---|---|---|---|---|---|---|---|---|
| 年 Annual | 春 Spring | 夏 Summer | 秋 Autumn | 冬 Winter | 年 Annual | 春 Spring | 夏 Summer | 秋 Autumn | 冬 Winter | |
| DCDSMT | 0.026 2 | 0.068 7** | 0.079 9** | 0.011 1 | -0.005 6 | 2.94* | 0.53 | 1.97 | 0.54 | 0.26 |
| DCDSTP | -0.048 6* | -0.045 1 | 0.016 7 | -0.009 1 | -0.013 0*** | 7.57** | 0.90 | 5.24** | 0.77 | 1.04** |
| DSRTHC | 0.020 7 | 0.060 7* | 0.043 5*** | 0.040 6* | -0.019 0 | 1.34** | 0.24 | 0.64 | 0.07 | 0.17** |
| DSRTTP | -0.009 9 | 0.082 3 | -0.013 0 | 0.032 0 | -0.069 8** | 0.38 | -0.28 | 1.11 | -0.11 | 0.32 |
| EVGNMT | 0.030 3 | 0.053 3* | 0.079 8** | 0.006 3 | 0.001 2 | -4.10* | -0.29 | -3.24 | -0.32 | -0.36 |
| EVGNST | -0.016 7 | -0.004 5 | 0.038 0** | -0.001 7 | -0.075 9* | -4.22 | -0.81 | -7.67* | 5.21** | -2.46** |
| CONTRY | -0.006 6 | 0.039 9 | 0.018 3 | -0.002 0 | -0.081 1** | -0.02 | -0.24 | -0.80 | 1.25** | -0.49** |
| 灌木类型 Shrubland type | 截距 Intercept | 气温系数Air temperature coefficients (g∙m-2∙a-1∙℃-1) | 降水量系数Precipitation coefficients (g∙m-2∙a-1∙mm-1) | ||||||
|---|---|---|---|---|---|---|---|---|---|
| 春 Spring | 夏 Summer | 秋 Autumn | 冬 Winter | 春 Spring | 夏 Summer | 秋 Autumn | 冬 Winter | ||
| DCDSMT | 199.60*** | 7.68*** | -19.31*** | -1.19*** | 0.08** | -0.51*** | |||
| DCDSTP | 91.12*** | 3.76*** | 7.83*** | 0.51*** | -0.40*** | ||||
| DSRTHC | 7.45 | 1.62** | 0.17* | 0.26*** | |||||
| DSRTTP | 46.70*** | 0.20** | 0.26*** | -0.14* | |||||
| EVGNMT | 554.26 *** | -8.15** | -9.97*** | -0.24** | -0.29*** | -0.21** | -1.45*** | ||
| EVGNST | -86.92 | 43.47*** | -10.19*** | 2.57* | -0.21*** | -0.10*** | 0.23*** | -0.35*** | |
Table 7 Regression coefficients of annual net primary production on seasonal mean temperature and precipitation
| 灌木类型 Shrubland type | 截距 Intercept | 气温系数Air temperature coefficients (g∙m-2∙a-1∙℃-1) | 降水量系数Precipitation coefficients (g∙m-2∙a-1∙mm-1) | ||||||
|---|---|---|---|---|---|---|---|---|---|
| 春 Spring | 夏 Summer | 秋 Autumn | 冬 Winter | 春 Spring | 夏 Summer | 秋 Autumn | 冬 Winter | ||
| DCDSMT | 199.60*** | 7.68*** | -19.31*** | -1.19*** | 0.08** | -0.51*** | |||
| DCDSTP | 91.12*** | 3.76*** | 7.83*** | 0.51*** | -0.40*** | ||||
| DSRTHC | 7.45 | 1.62** | 0.17* | 0.26*** | |||||
| DSRTTP | 46.70*** | 0.20** | 0.26*** | -0.14* | |||||
| EVGNMT | 554.26 *** | -8.15** | -9.97*** | -0.24** | -0.29*** | -0.21** | -1.45*** | ||
| EVGNST | -86.92 | 43.47*** | -10.19*** | 2.57* | -0.21*** | -0.10*** | 0.23*** | -0.35*** | |
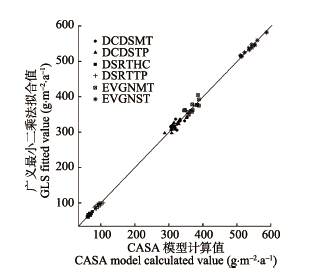
Fig. 4 Regression of annual net primary production of the six shrubland types on pertinent climate variables: Regression predicted vs. simulated values. DCDSMT, DCDSTP, DSRTHC, DSRTTP, EVGNMT and EVGNST represent subalpine deciduous, temperate deciduous, high cold desert, temperate desert, subalpine evergreen and subtropical evergreen shrubland, respectively.
| [1] | Allen CD, Macalady AK, Chenchouni H, Bachelet D, McDowell N, Vennetier M, Kitzberger T, Rigling A, Breshears DD, Hogg EH, Gonzalez P, Fensham R, Zhang Z, Castro J, Demidova N, Lim JH, Allard G, Running SW, Semerci A, Cobb N (2010). A global overview of drought and heat-induced tree mortality reveals emerging climate change risks for forests.Forest Ecology and Management, 259, 660-684. |
| [2] | Angert A, Biraud S, Bonfils C, Henning CC, Buermann W, Pinzon J, Tucker CJ, Fung I (2005). Drier summers cancel out the CO2 uptake enhancement induced by warmer springs.Proceedings of the National Academy of Sciences of the United States of America, 102, 10823-10827. |
| [3] | Breshears DD, Cobb NS, Rich PM, Price KP, Allen CD, Balice RG, Romme WH, Kastens JH, Floyd ML, Belnap J, Anderson JJ, Myers OB, Meyer CW (2005). Regional vegetation die-off in response to global-change-type drought.Proceedings of the National Academy of Sciences of the United States of America, 102, 15144-15148. |
| [4] | Canadell J, Jackson R, Ehleringer J, Mooney HA, Sala OE, Schulze E-D (1996). Maximum rooting depth of vegetation types at the global scale.Oecologia, 108, 583-595. |
| [5] | Chapin FS, Matson PA, Mooney HA (2002). Principles of Terrestrial Ecosystem Ecology. Springer, New York. |
| [6] | Dai A (2011). Drought under global warming: A review.Wiley Interdisciplinary Reviews: Climate Change, 2, 45-65. |
| [7] | Ding Y, Ren G, Zhao Z, Xu Y, Luo Y, Li Q, Zhang J (2007). Detection, causes and projection of climate change over China: An overview of recent progress.Advances in Atmospheric Sciences, 24, 954-971. |
| [8] | Dubovyk O, Landmann T, Erasmus BFN, Tewes A, Schellberg J (2015). Monitoring vegetation dynamics with medium resolution MODIS-EVI time series at sub-regional scale in southern Africa.International Journal of Applied Earth Observation and Geoinformation, 38, 175-183. |
| [9] | Fang JY, Piao SL, Field CB, Pan YD, Guo QH, Zhou LM, Peng CH, Tao S (2003). Increasing net primary production in China from 1982 to 1999.Frontiers in Ecology and the Environment, 1, 293-297. |
| [10] | Fensholt R, Proud SR (2012). Evaluation of earth observation based global long term vegetation trends—Comparing GIMMS and MODIS global NDVI time series.Remote Sensing of Environment, 119, 131-147. |
| [11] | Field CB (1998). Primary production of the biosphere: Integrating terrestrial and oceanic components.Science, 281, 237-240. |
| [12] | Field CB, Randerson JT, Malmstrom CM (1995). Global Net Primary Production: Combining Ecology and Remote Sensing.Remote Sensing of Environment, 51, 74-88. |
| [13] | Gao Q, Yu M, Zhang X, Xu H, Huang Y (2005). Modelling seasonal and diurnal dynamics of stomatal conductance of plants in a semiarid environment.Functional Plant Biology, 32, 583-598. |
| [14] | Gao Q, Yu M, Zhou C (2013). Detecting the differences in responses of stomatal conductance to moisture stresses between deciduous shrubs and Artemisia subshrubs. PLOS ONE, 8, e84200. doi:10.1371/journal.pone.0084200. |
| [15] | Gao Q, Zhao P, Zeng X, Cai X, Shen W (2002). A model of stomatal conductance to quantify the relationship between leaf transpiration, microclimate and soil water stress.Plant, Cell & Environment, 25, 1373-1381. |
| [16] | Gao QZ, Wan YF, Li YE Lin ED, Yang K, Jinagcun WZ, Wang BS, Li WF (2007). Grassland net primary productivity and its spatiotemporal distribution in Northern Tibet: A study with CASA model.Chinese Journal of Applied Ecology, 18, 2526-2532. (in Chinese with English abstract)[高清竹, 万运帆, 李玉娥, 林而达, 杨凯, 江村旺扎, 王宝山, 李文福 (2007). 基于CASA模型的藏北地区草地植被净第一性生产力及其时空格局. 应用生态学报, 18, 2526-2532.] |
| [17] | Hansen J, Ruedy R, Sato M, Lo K (2010). Global surface temperature change. Reviews of Geophysics, 48, RG4004. doi: 10.1029/2010RG000345. |
| [18] | Hicke JA, Asner GP, Randerson JT, Los S, Birdsey R, Jenkins JC, Tucker C, Field C (2002). Trends in North American net primary productivity derived from satellite observations, 1982-1998. Global Biogeochemical Cycles, 16, 2-1-2-14. doi: 10.1029/2001GB001550. |
| [19] | Hipel KW, McLeod AI (1994). Time Series Modelling of Water Resources and Environmental Systems. Elsevier Science, New York. |
| [20] | Hunt ER (1994). Relationship between woody biomass andPAR conversion efficiency for estimating net primary production from NDVI. International Journal of Remote Sensing, 15, 1725-1729. |
| [21] | Jackson RB, Canadell J, Ehleringer JR, Mooney HA, Sala OE, Schulze ED (1996). A global analysis of root distributions for terrestrial biomes.Oecologia, 108, 389-411. |
| [22] | Jeong SJ, Ho CH, Gim HJ, Brown ME (2011). Phenology shifts at start vs. end of growing season in temperate vegetation over the Northern Hemisphere for the period 1982-2008.Global Change Biology, 17, 2385-2399. |
| [23] | Jiang W, Yuan L, Wang W, Cao R, Zhang Y, Shen W (2015). Spatio-temporal analysis of vegetation variation in the Yellow River Basin.Ecological Indicators, 51, 117-126. |
| [24] | Kurz WA, Dymond CC, Stinson G, Rampley GJ, Neilson ET, Carroll AL, Ebata T, Safranyik L (2008). Mountain pine beetle and forest carbon feedback to climate change.Nature, 452, 987-990. |
| [25] | Li GC (2004). Estimation of Chinese Terrestrial Net Primary Production Using LUE Model and MODIS Data. PhD dissertation, Institute of Remote Sensing Applications, The Chinese Academy of Sciences, Beijing. 60-72. (in Chinese with English abstract)[李贵才 (2004). 基于MODIS数据和光能利用率模型的中国陆地净初级生产力估算研究. 博士学位论文, 中国科学院遥感应用研究所, 北京. 60-72.] |
| [26] | Liang W, Yang Y, Fan D, Guan HD, Zhang T, Long D, Zhou Y, Bai D (2015). Analysis of spatial and temporal patterns of net primary production and their climate controls in China from 1982 to 2010.Agricultural and Forest Meteorology, 204, 22-36. |
| [27] | Lotsch A, Friedl MA, Anderson BT, Tucker CJ (2005). Response of terrestrial ecosystems to recent Northern Hemispheric drought.Geophysical Research Letters, 32, 1-5. |
| [28] | Melillo JM, McGuire AD, Kicklighter DW, Moore Iii B, Vorosmarty CJ, Schloss AL (1993). Global climate change and terrestrial net primary production.Nature, 363, 234-240. |
| [29] | Monserud RA, Marshall JD (1999). Allometric crown relations in three northern Idaho conifer species.Canadian Journal of Forest Research, 29, 521-535. |
| [30] | Park H-S, Sohn BJ (2010). Recent trends in changes of vegetation over East Asia coupled with temperature and rainfall variations.Journal of Geophysical Research, 115, D14101. doi: 10.1029/2009JD012752. |
| [31] | Peng J, Liu Z, Liu Y, Wu J, Han Y (2012). Trend analysis of vegetation dynamics in Qinghai-Tibet Plateau using Hurst Exponent.Ecological Indicators, 14, 28-39. |
| [32] | Peng SL, Guo ZH, Wang BS (2000). Use of GIS and RS to estimate the light utilization efficiency of the vegetation in Guangdong, China.Acta Ecologica Sinica, 20, 903-909. (in Chinese with English abstract)[彭少麟, 郭志华, 王伯荪 (2000). 利用GIS和RS估算广东植被光利用率. 生态学报, 20, 903-909. |
| [33] | Peng SS, Chen AP, Xu L, Cao CX, Fang JY, Myneni RB, Pinzon JE, Tucker CJ, Piao SL (2011). Recent change of vegetation growth trend in China.Environmental Research Letters, 6, 044027. |
| [34] | Piao S (2003). Interannual variations of monthly and seasonal normalized difference vegetation index (NDVI) in China from 1982 to 1999. Journal of Geophysical Research, 108, 4401. |
| [35] | Piao S, Fang J, Ciais P, Peylin P, Huang Y, Sitch S, Wang T (2009). The carbon balance of terrestrial ecosystems in China.Nature, 458, 1009-1013. |
| [36] | Piao S, Fang J, Jinsheng HE (2006a). Variations in vegetation net primary production in the Qinghai-Xizang Plateau, China, from 1982 to 1999.Climatic Change, 74, 253-267. |
| [37] | Piao S, Fang J, Zhou L, Ciais P, Zhu B (2006b). Variations in satellite-derived phenology in China’s temperate vegetation.Global Change Biology, 12, 672-685. |
| [38] | Piao S, Fang J, Zhou L, Zhu B, Tan K, Tao S (2005). Changes in vegetation net primary productivity from 1982 to 1999 in China. Global Biogeochemical Cycles, 19, GB2027. doi: 10.1029/2004GB002274. |
| [39] | Piao S, Wang X, Ciais P, Zhu B, Wang T, Liu J (2011). Changes in satellite-derived vegetation growth trend in temperate and boreal Eurasia from 1982 to 2006.Global Change Biology, 17, 3228-3239. |
| [40] | Potter C, Klooster S, Genovese V (2012). Net primary production of terrestrial ecosystems from 2000 to 2009.Climatic Change, 115, 365-378. |
| [41] | Potter C, Klooster S, Myneni R, Genovese V, Tan PN, Kumar V (2003). Continental-scale comparisons of terrestrial carbon sinks estimated from satellite data and ecosystem modeling 1982-1998.Global and Planetary Change, 39, 201-213. |
| [42] | Potter CS, Randerson JT, Field CB, Matson PA, Vitousek PM, Mooney HA, Klooster SA (1993). Terrestrial ecosystem production—A Process Model-based on global satellite and surface data.Global Biogeochemical Cycles, 7, 811-841. |
| [43] | Qi Y, Fang SB, Zhou WZ (2014). Variation and spatial distribution of surface solar radiation in China over recent 50 years.Acta Ecologica Sinica, 34, 7444-7453. (in Chinese with English abstract)[齐月, 房世波, 周文佐 (2014). 近50年来中国地面太阳辐射变化及其空间分布. 生态学报, 34, 7444-7453. |
| [44] | Robeson SM (2004). Trends in time-varying percentiles of daily minimum and maximum temperature over North America.Bulletin of the American Meteorological Society, 31, 4379-4384. |
| [45] | Shi XZ, Yu DS (2004). Soil database of 1:1,000,000 digital soil survey and reference system of the Chinese Genetic Soil Classification System.Soil Survey Horizons, 45, 111-148. |
| [46] | The Editorial Committee of Vegetation Map of China,Chinese Academy of Sciences(2007).Vegetation Map of the People’s Republic of China 1:1 000 000. Geological Publishing House, Beijing. (in Chinese)[中国科学院中国植被图编辑委员会 (2007).中华人民共和国植被图1:1 000 000. 地质出版社, 北京.] |
| [47] | Wang X, Piao S, Ciais P, Li J, Friedlingstein P, Koven C, Chen A (2011). Spring temperature change and its implication in the change of vegetation growth in North America from 1982 to 2006.Proceedings of the National Academy of Sciences of the United State of America, 108, 1240-1245. |
| [48] | Wang YL, Gao Q, Liu T, Tian YQ, Yu M (2016). The greenness of major shrublands in China increased from 2001 to 2013.Remote Sensing, 8, 121. |
| [49] | Wilson BF (1995). Shrub stems: Form and function. In: Gartner BL ed. Plant Stems. Academic Press, San Diego, USA. 91-102. |
| [50] | Xiao JF, Zhuang QL (2007). Drought effects on large fire activity in Canadian and Alaskan forests.Environmental Research Letters, 2, 44003. doi: 10.1088/1748-9326/2/4/044003. |
| [51] | Xu X, Piao S, Wang X, Chen A, Ciais P, Myneni RB (2012). Spatio-temporal patterns of the area experiencing negative vegetation growth anomalies in China over the last three decades.Environmental Research Letters, 7, 035701. doi: 10.1088/1748-9326/7/3/035701. |
| [52] | Zhang F, Zhou GS, Wang YH (2008). Dynamics simulation of net primary productivity by a satellite data-driven CASA model in inner Mongolian typical steppe, China.Journal of Plant Ecology (Chinese Version), 32, 786-797. (in Chinese with English abstract)[张峰, 周广胜, 王玉辉 (2008). 基于CASA模型的内蒙古典型草原植被净初级生产力动态模拟. 植物生态学报, 32, 786-797.] |
| [53] | Zhang Y, Gao Q, Xu L, Yu M, Tian Y (2014). Shrubs proliferated within a six-year exclosure in a temperate grassland -- Spatiotemporal relationships between vegetation and soil variables.Sciences in Cold and Arid Regions, 6, 139-149. |
| [54] | Zhao M, Heinsch FA, Nemani RR, Running SW (2005). Improvements of the MODIS terrestrial gross and net primary production global data set.Remote Sensing of Environment, 95, 164-176. |
| [55] | Zhao M, Running SW (2010). Drought-induced reduction in global terrestrial net primary production from 2000 through 2009.Science, 329, 940-943. |
| [56] | Zhou L, Tucker CJ, Kaufmann RK, Slayback D, Shabanov N V, Myneni RB (2001). Variations in northern vegetation activity inferred from satellite data of vegetation index during 1981 to 1999.Journal of Geophysical Research, 106, 20069-20083. |
| [57] | Zhu W, Pan Y, He H, Yu D, Hu H (2006). Simulation of maximum light use efficiency for some typical vegetation types in China.Chinese Science Bulletin, 51, 457-463. |
| [58] | Zhu WQ, Pan YZ, Zhang JS (2007). Estimation of net primary productivity of Chinese terrestrial vegetation based on remote sensing.Journal of Plant Ecology (Chinese Version), 31, 413-424. (in Chinese with English abstract)[朱文泉, 潘耀忠, 张锦水 (2007). 中国陆地植被净级生产力遥感估算. 植物生态学报, 31, 413-424.] |
| [1] | ZHANG An-Ning, XIAO Ya-Ning, ZHAO Xia, ZHANG Miao, CUI Han Wen, Chen Shu-Yan, AN Li-Zhe. Interactions between shrub encroachment and nitrogen addition on nematode community and functional traits on Qinghai–Tibetan Plateau [J]. Chin J Plant Ecol, 2026, 50(预发表): 0-. |
| [2] | TAN Qiu-Yan, ZHANG Qing, GAO Cheng, CHU Hai-Yan, YANG Teng. Ectomycorrhizal fungi: key drivers of carbon and nitrogen cycling in alpine ecosystems [J]. Chin J Plant Ecol, 2026, 50(3): 584-599. |
| [3] | LI Xin-Mao, JIN Guang-Ze, LIU Zhi-Li. Seasonal dynamics and organ differences in growth and defense strategies of “twig system” of Corylus mandshurica [J]. Chin J Plant Ecol, 2026, 50(2): 293-305. |
| [4] | CHEN Gang-Gang, ZHU Si-Jie, GUO Liang-Na, FU Fang-Wei, LIU Yu-Zhuo, LI Jiang-Rong. Aboveground and belowground nutrient allocation strategies for trees and shrubs at alpine treeline in Sygera Mountains of the southeastern Qingzang Plateau [J]. Chin J Plant Ecol, 2025, 49(9): 1515-1526. |
| [5] | ZHANG Lin, YUAN Wei-Ying, SONG Chuang-Ye, WU Dong-Xiu. Dynamic dataset of environmental elements, species richness and biomass of long-term observation plots of typical ecosystems in China from 1998 to 2010 [J]. Chin J Plant Ecol, 2025, 49(8): 1182-1190. |
| [6] | FAN Ya-Ran, XIA Shao-Pan, YU Bing-Bing, ZHU Zi-Qi, YANG Wei, FAN Yu-Chuan, LIU Xiao-Yu, ZHANG Xu-Hui, ZHENG Ju-Feng. Effects of elevated atmospheric CO2 concentration and warming on stability of soil organic carbon pool accumulation, molecular composition and structure stability [J]. Chin J Plant Ecol, 2025, 49(7): 1053-1069. |
| [7] | ZHANG Xiao-Di, WANG Xiao-Xia, ZHANG Yu-Wen, HOU Jing-Yu, SHI Xiao-Peng, HE Lu-Lu, LIU Ya-Dong, XUE Liu, HE Bao-Hua, DUAN Jie. Hydraulic architecture, leaf functional traits and environmental adaptation strategies of three understory shrubs in Beijing mountainous areas [J]. Chin J Plant Ecol, 2025, 49(7): 1128-1143. |
| [8] | XIONG Gao-Ming, SHEN Guo-Zhen, XU Wen-Ting, XIE Zong-Qiang, LI Yue-Lin, XU Yao-Zhan, CHEN Fang-Qing, LI Jia-Xiang. Major vegetation types and community characteristics of tropical evergreen broadleaf shrubland in low mountain and hilly areas of China [J]. Chin J Plant Ecol, 2025, 49(6): 865-874. |
| [9] | CAO Yi, ZHANG Song-Lin, WANG Xu-Feng, YANG An-Chang, REN Min-Hui, YANG Hao, HAN Chao. Plant community datasets of the northern and southern mountains of Lanzhou, China [J]. Chin J Plant Ecol, 2025, 49(6): 975-989. |
| [10] | WANG Shi-Song, QU Xiao-Yun, DONG Shao-Qiong, LI Jia-Hong, YANG Qi, HOU Man-Fu, ZHAO Li-Qing, GUO Ke, LIU Chang-Cheng, XU Xiao. Typical desert vegetation types and community characteristics in Zanda, Xizang, China [J]. Chin J Plant Ecol, 2025, 49(5): 801-812. |
| [11] | CHEN Ying, WANG Ying-Xue, DENG Qing-Ya, LI Pei-Yang, XIAO Zi-Xin, XU Yan-Rong, DENG Chuan-Yuan. Numerical classification and ordination of shrub communities on Haitan Island, Fujian, China [J]. Chin J Plant Ecol, 2025, 49(4): 653-666. |
| [12] | WANG Kun-Ying, QIU Gui-Fu, LIU Zi-He, MENG Jun, LIU Yu-Xuan, JIA Guo-Dong. Climate change regulate tree growth and intrinsic water use efficiency of Populus simonii at different levels of degradation [J]. Chin J Plant Ecol, 2025, 49(2): 343-355. |
| [13] | HU Yan, LI Lin, WEI Shi-Guang, YIN Yu-Hang, ZHOU Jing-Gang, ZHONG Jian-Jun, WANG Xue. Traits for 1 to 3 order fine roots of 30 shrub species and their root economic spectrum in karst areas [J]. Chin J Plant Ecol, 2025, 49(12): 1991-2003. |
| [14] | HUANG Mei-Hong, NIU Meng-Qiu, YANG Peng-Fei, LIN Jie, LIAO Zhou-Yu, CHEN Jian-Guo, XIANG Jian-Ying. Effects of temperature and burial depth on seedling emergence and growth of the alpine cushion plant Arenaria oreophila [J]. Chin J Plant Ecol, 2025, 49(12): 2092-2104. |
| [15] | SONG Si-Yu, DU Piao, LIN Qin, QI Xiang, DU Ke-Yu, LI Cong, CHEN Ya-Mei, HUANG You-You, LIU Yang. Response characteristics of phenolic compounds in plant leaves and roots along an alpine shrub encroachment gradient [J]. Chin J Plant Ecol, 2025, 49(12): 2119-2136. |
| Viewed | ||||||
|
Full text |
|
|||||
|
Abstract |
|
|||||
Copyright © 2026 Chinese Journal of Plant Ecology
Tel: 010-62836134, 62836138, E-mail: apes@ibcas.ac.cn, cjpe@ibcas.ac.cn
![]()