
植物生态学报 ›› 2011, Vol. 35 ›› Issue (4): 371-379.DOI: 10.3724/SP.J.1258.2011.00371
毛学刚, 范文义*( ), 李明泽, 于颖, 杨金明
收稿日期:2010-07-13
接受日期:2010-12-21
出版日期:2011-07-13
发布日期:2011-04-13
通讯作者:
范文义
作者简介:*E-mail: fanwy@163.com
MAO Xue-Gang, FAN Wen-Yi*(), LI Ming-Ze, YU Ying, YANG Jin-Ming
Received:2010-07-13
Accepted:2010-12-21
Online:2011-07-13
Published:2011-04-13
Contact:
FAN Wen-Yi
摘要:
森林生物量碳储量的空间分布及其变化信息, 对揭示地表空间变化规律及驱动因子、分析评价森林生产力及生态功能具有重要意义。该文以20世纪70年代、80年代、90年代和21世纪初4个时期的遥感数据和同期的森林资源清查样地数据为基础, 应用遥感信息模型, 估算了黑龙江长白山地区的森林生物量, 分析了该地区森林生物量的时空动态变化, 以及森林生物量随高程、坡度和坡向的变化规律。结果表明: 该地区4个时期的森林平均生物量分别为81.56、44.27、48.27和54.82 t·hm-2。4个时期总的森林生物量分别为5.37 × 10 8、2.83 × 10 8、3.06 × 10 8和3.46 × 10 8 t。20世纪70年代到21世纪初森林平均生物量和总的森林生物量都呈现出先降低后增加的趋势, 呈先下降趋势的主要原因是20世纪70-80年代以森林采伐为主, 后增加趋势的主要原因是实施天然林保护工程起到了很大的作用。该地区4个时期森林生物量随高程、坡度和坡向都表现出一致性的变化规律, 森林生物量随高程和坡度变化都呈先增加后减少的趋势, 导致这一现象的主要原因是, 高程、坡度和坡向变化引起了局地气候条件的变化, 从而直接影响森林生长环境, 造成森林分布的变化。森林生物量在200-400 m高程所占的比例最大, 约为35%, 在坡度5°-15°所占的比例接近50%。森林生物量在南坡和西南坡所占的比例最小, 为7%; 平坡所占的比例最大, 为28%; 南坡次之, 为19%。
毛学刚, 范文义, 李明泽, 于颖, 杨金明. 黑龙江长白山森林生物量的时空变化分析. 植物生态学报, 2011, 35(4): 371-379. DOI: 10.3724/SP.J.1258.2011.00371
MAO Xue-Gang, FAN Wen-Yi, LI Ming-Ze, YU Ying, YANG Jin-Ming. Temporal and spatial analysis of forest biomass in Changbai Mountains, Heilongjiang, China. Chinese Journal of Plant Ecology, 2011, 35(4): 371-379. DOI: 10.3724/SP.J.1258.2011.00371
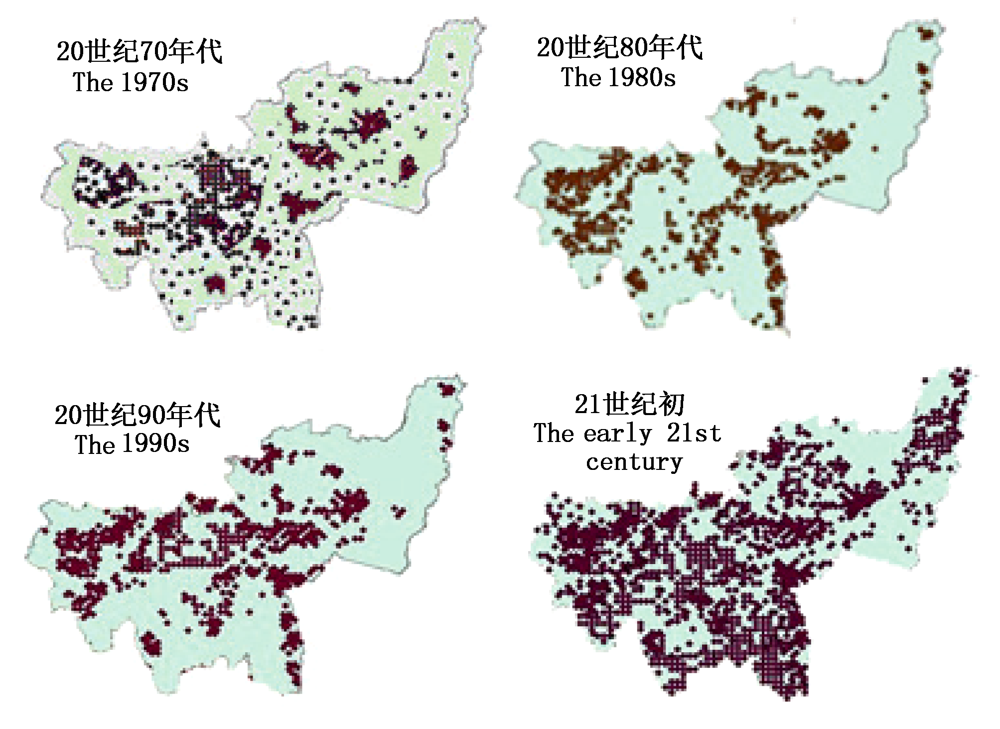
图1 20世纪70年代-21世纪初的样地分布图。
Fig. 1 Sample plot distribution from the 1970s to the early 21st century.
| 类型 Type | n | 生物量模型 Biomass model | R2 |
|---|---|---|---|
| 灌木 Shrub | 38 | bio = 0.0398 × h - 0.3326 | 0.88 |
| 草本 Herb | 79 | bio = 0.0175 × h - 0.2888 | 0.89 |
表1 灌木和草本生物量模型
Table 1 Shrub and herb biomass models
| 类型 Type | n | 生物量模型 Biomass model | R2 |
|---|---|---|---|
| 灌木 Shrub | 38 | bio = 0.0398 × h - 0.3326 | 0.88 |
| 草本 Herb | 79 | bio = 0.0175 × h - 0.2888 | 0.89 |
| 年代 Decade | 生物量模型 Biomass model | n | R2 | 预估精度 Precision |
|---|---|---|---|---|
| 20世纪70年代 The 1970s | bio = 0.1053 × gc + 0.0003408 × Y - 0.0117 × TM4-1 616.9939 | 198 | 0.73 | 69.61% |
| 20世纪80年代 The 1980s | bio = -285.5049 × TM452 + 4.4959 × SR + 0.0481 × gc + 214.7325 | 256 | 0.74 | 70.17% |
| 20世纪90年代 The 1990s | bio = 0.0046 × DVI + 0.0018 × gc - 0.0321 × TM5 + 88.5821 | 201 | 0.76 | 72.34% |
| 21世纪初 The early 21st century | bio = 0.0878 × gc - 0.0186 × TM5 + 0.000067 83 × Y + 8.9101 × TM73 + 0.04088 × TM3 + 179.1037 × TM452 - 0.0127 × TM6 - 470.0561 | 272 | 0.76 | 71.43% |
表2 生物量遥感估测模型
Table 2 Estimation models of biomass by remote sense
| 年代 Decade | 生物量模型 Biomass model | n | R2 | 预估精度 Precision |
|---|---|---|---|---|
| 20世纪70年代 The 1970s | bio = 0.1053 × gc + 0.0003408 × Y - 0.0117 × TM4-1 616.9939 | 198 | 0.73 | 69.61% |
| 20世纪80年代 The 1980s | bio = -285.5049 × TM452 + 4.4959 × SR + 0.0481 × gc + 214.7325 | 256 | 0.74 | 70.17% |
| 20世纪90年代 The 1990s | bio = 0.0046 × DVI + 0.0018 × gc - 0.0321 × TM5 + 88.5821 | 201 | 0.76 | 72.34% |
| 21世纪初 The early 21st century | bio = 0.0878 × gc - 0.0186 × TM5 + 0.000067 83 × Y + 8.9101 × TM73 + 0.04088 × TM3 + 179.1037 × TM452 - 0.0127 × TM6 - 470.0561 | 272 | 0.76 | 71.43% |
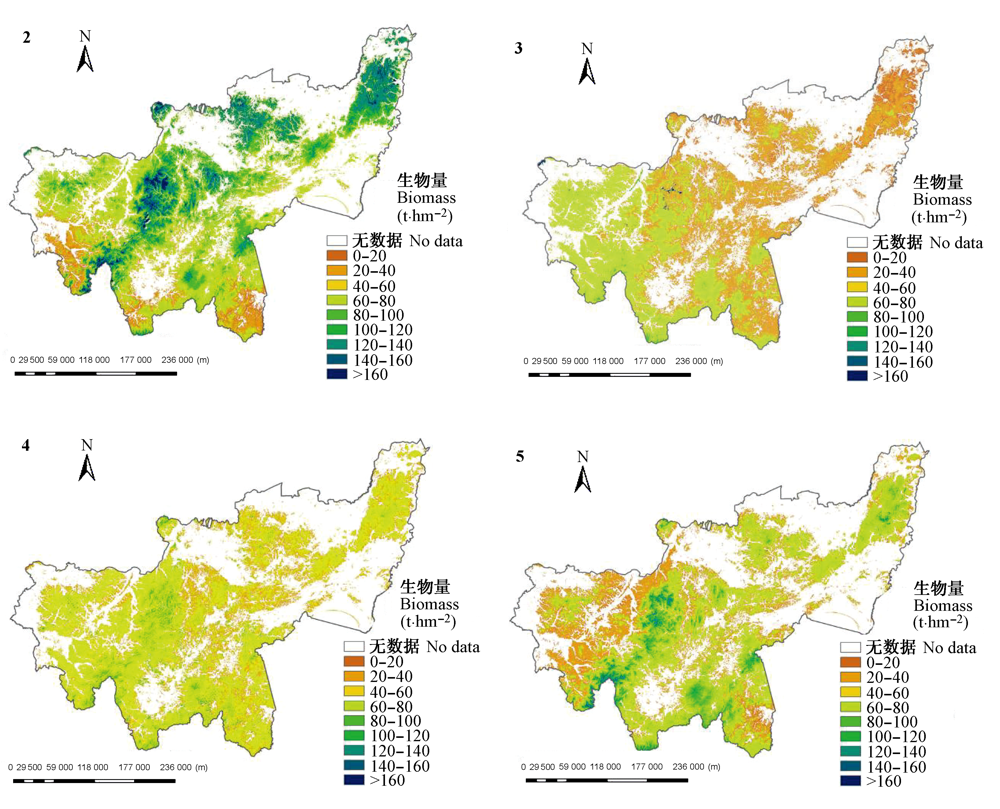
图2-5 森林生物量等级分布图。2. 20世纪70年代。3. 20世纪80年代。4. 20世纪90年代。5. 21世纪初。
Figs. 2-5 Distribution map of forest biomass ranks. 2. The 1970s. 3. The 1980s. 4. The 1990s. 5. The early 21st century.
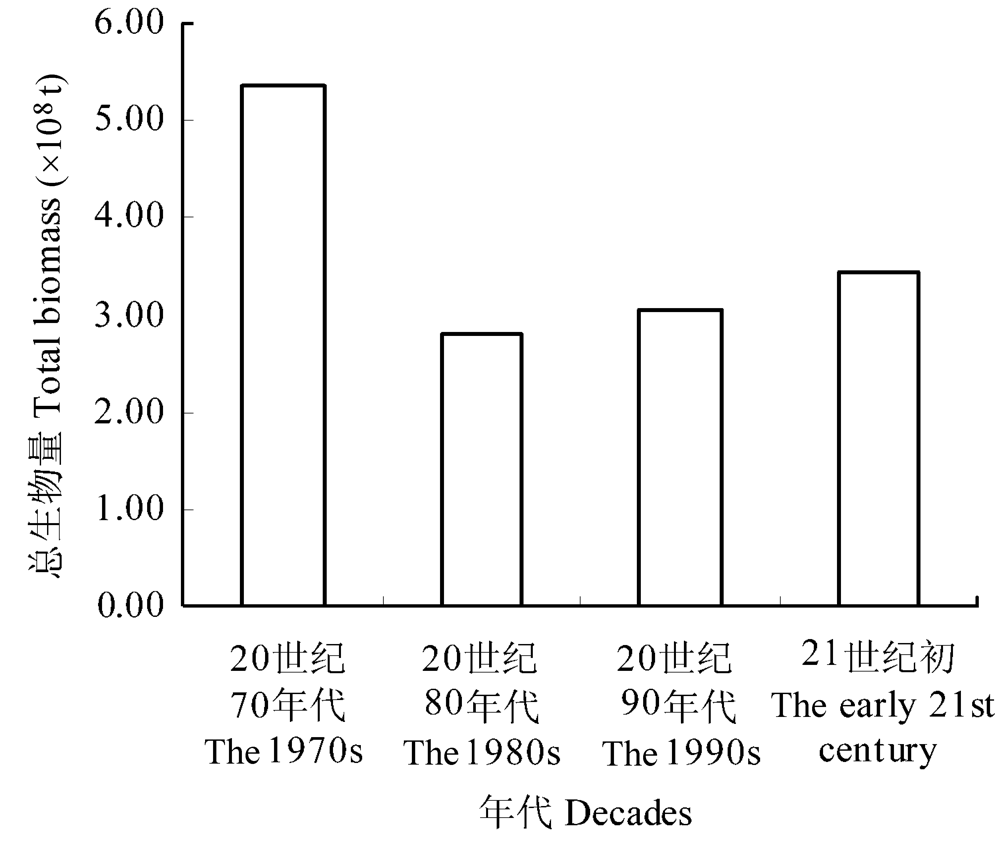
图6 20世纪70年代-21世纪初森林总生物量。
Fig. 6 Forest total biomass between the 1970s and the early 21st century.
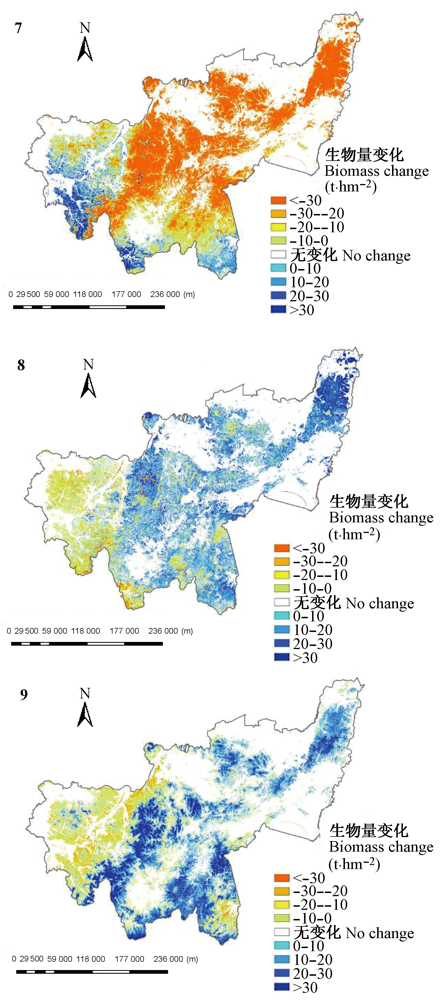
图7-9 森林生物量变化分布图。7. 20世纪70-80年代。8. 20世纪80-90年代。9. 20世纪90-21世纪初。
Figs. 7-9 Distribution map of forest biomass changes. 7. Between the 1970s and 1980s. 8. Between the 1980s and 1990s. 9. Between the 1990s and early 21st century.
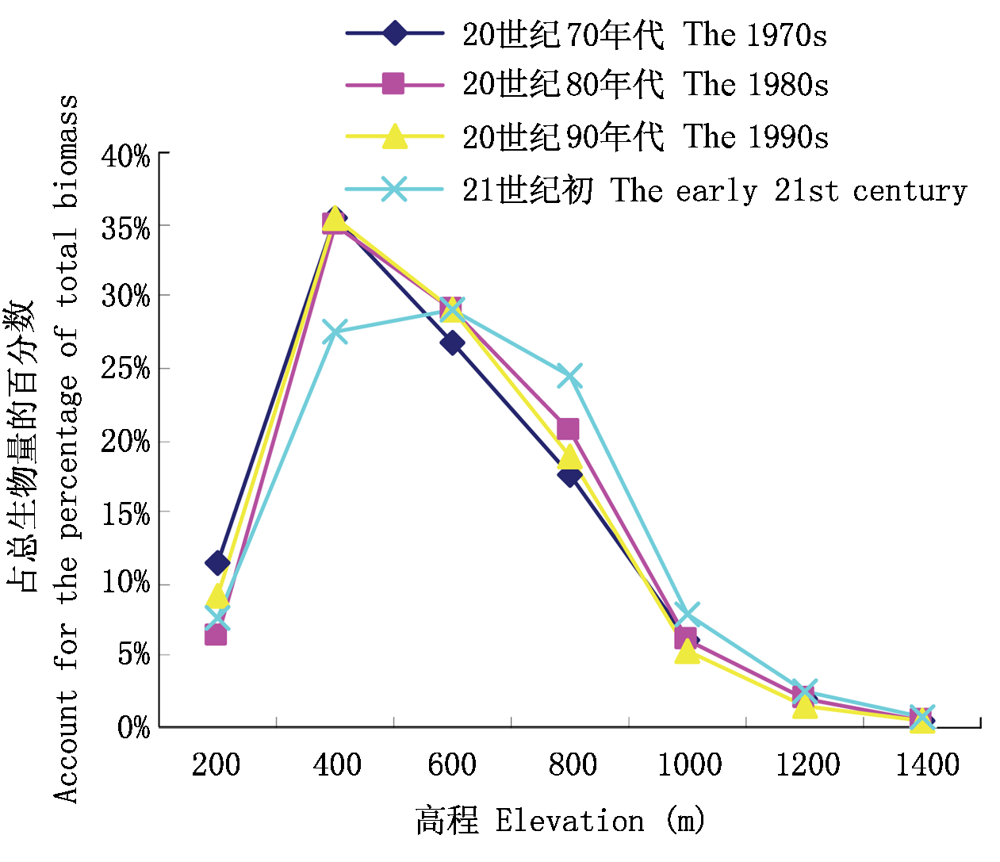
图10 森林生物量随高程的变化。
Fig. 10 Change of forest biomass with elevation.
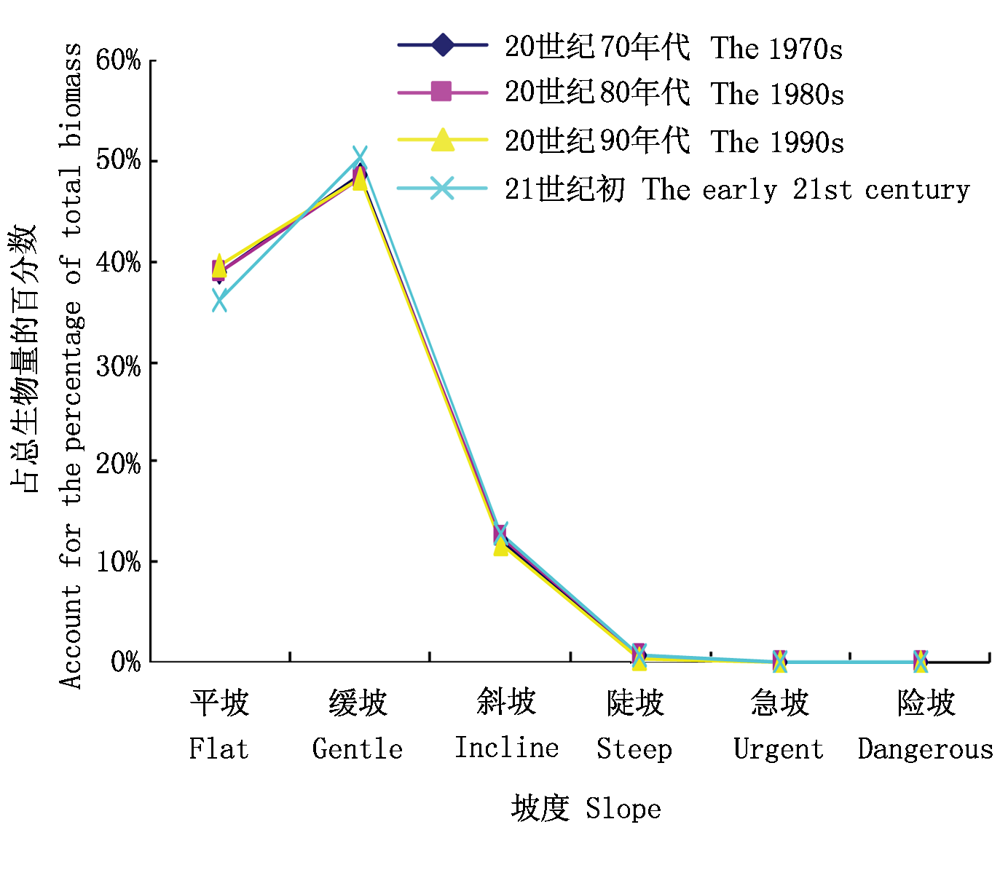
图11 森林生物量随坡度的变化。
Fig. 11 Change of forest biomass with slope.
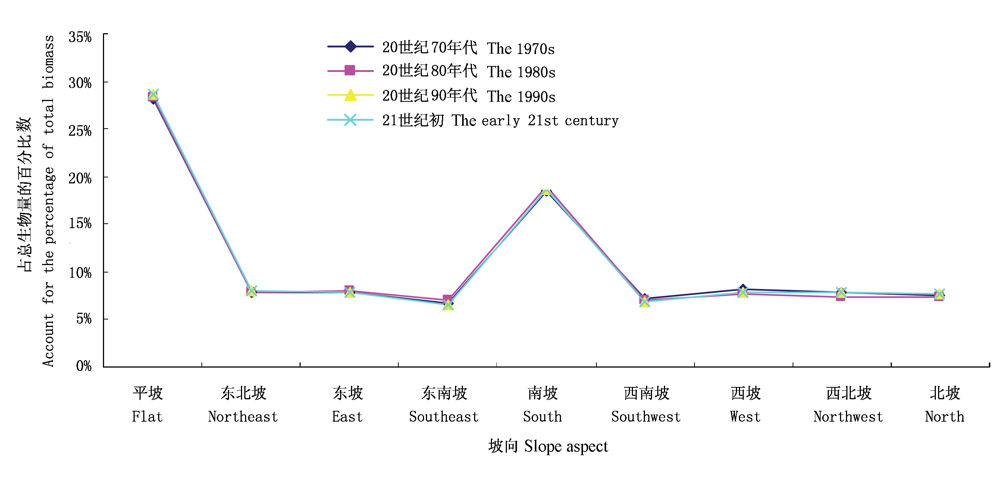
图12 森林生物量随坡向的变化。
Fig. 12 Change of forest biomass with slope aspect.
| [1] |
Alban DH, Perala DA, Schlaegel BE (1978). Biomass and nutrient distribution in aspen, pine, and spruce stands on the same soil type in Minnesota. Canadian Journal of Forest Research, 8, 290-299.
DOI URL |
| [2] |
Brown SL, Schroeder P, Kern JS (1999). Spatial distribution of biomass in forests of the eastern USA. Forest Ecology and Management, 123, 81-90.
DOI URL |
| [3] |
Dixon RK, Solomon AM, Brown S, Houghton RA, Trexier MC, Wisniewski J (1994). Carbon pools and flux of global forest ecosystems. Science, 263, 185-190.
DOI URL PMID |
| [4] | Fang JY (方精云) (2000). Forest biomass carbon pool of middle and high latitudes in North Hemisphere is probably much smaller than present estimates. Acta Phytoecologica Sinica (植物生态学报), 24, 635-638. (in Chinese with English abstract) |
| [5] | Fang JY (方精云), Chen AP (陈安平), Zhao SQ (赵淑清), Ci LJ (慈龙骏) (2002). Estimating biomass and carbon of China’s forests: supplementary notes on report published in Science (291: 2320-2322) by Fang et al. (2001). Acta Phytoecologica Sinica (植物生态学报), 26, 243-249. (in Chinese with English abstract) |
| [6] | Feng ZW (冯宗炜), Chen CY (陈楚莹), Zhang JW (张家武), Wang KP (王开平), Zhao JL (赵吉录), Gao H (高虹) (1982). Determination of biomass of Pinus massoniana stand in HUITONG county, HUNAN Province. Scientia Silvae Sinicae (林业科学), 18, 127-134. (in Chinese with English abstract) |
| [7] | Guo ZH (郭志华), Peng SL (彭少麟), Wang BS (王伯荪) (2002). Estimating forest biomass in western Guangdong using Landsat TM data. Acta Ecologica Sinica (生态学报), 22, 1833-1839. (in Chinese with English abstract) |
| [8] | Kang HN (康蕙宁), Ma QY (马钦彦), Yuan JZ (袁嘉祖) (1996). Estimation of carbon sink function of forests in China. Chinese Journal of Applied Ecology (应用生态学报), 7, 230-234. (in Chinese with English abstract) |
| [9] | Li WH (李文华), Deng KM (邓坤枚), Li F (李飞) (1981). Study on biomass and primary production of main ecosystems in Changbai Mountain. Research of Forest Ecosystem (森林生态系统研究), 2, 34-50. (in Chinese with English abstract) |
| [10] | Li KH (李凯辉), Hu YK (胡玉昆), Wang X (王鑫) (2007). Relationships between aboveground biomass and environmental factors along an altitude gradient of alpine grassland. Chinese Journal of Applied Ecology (应用生态学报), 18, 2020-2024. (in Chinese with English abstract) |
| [11] | Luo TX (罗天祥), Li WH (李文华), Leng YF (冷允法), Yue YZ (岳燕珍) (1998). Estimation of total biomass and potential distribution of net primary productivity in the Tibetan Plateau. Geographical Research (地理研究), 17, 337-344. (in Chinese with English abstract) |
| [12] | Luo TX (罗天祥), Li WH (李文华), Zhao SD (赵士洞) (1999). Productivity distribution patterns and modeling of Pinus tabulaeformis forest in China. Chinese Journal of Applied Ecology (应用生态学报), 10, 257-261. (in Chinese with English abstract) |
| [13] |
Mokany K, Raison JR, Prokushkin SA (2006). Critical analysis of root: shoot ratios in terrestrial biomes. Global Change Biology, 12, 84-96.
DOI URL |
| [14] |
Muukkonen P (2007). Generalized allometric volume and biomass equations for some tree species in Europe. European Journal of Forest Research, 126, 157-166.
DOI URL |
| [15] | Reichle DE, Franklin JF, Goodwell DE eds (1975). Productivity of World Ecosystems. National Academy of Sciences, Washington, D.C. |
| [16] | Remezon NP (1959). Method studying the biological cycles of elements in forest. Soviet Soil Science, 1, 59-67. |
| [17] | Wang XK (王效科), Feng ZW (冯宗炜), Ouyang ZY (欧阳志云) (2001). Vegetation carbon storage and density of forest ecosystems in China. Chinese Journal of Applied Ecology (应用生态学报), 12, 13-16. (in Chinese with English abstract) |
| [18] | Zhao M (赵敏), Zhou GS (周广胜) (2004). Forest inventory data (FID)-based biomass models and their prospects. Chinese Journal of Applied Ecology (应用生态学报), 15, 1468-1472. (in Chinese with English abstract) |
| [19] | Zhao M (赵敏), Zhou GS (周广胜) (2005). Modeling variation trend of boreal forest NPP in China and its relations to temperature and precipitation. Acta Botanica Boreali- Occidentalia Sinica (西北植物学报), 25, 466-471. (in Chinese with English abstract) |
| [1] | 王袼, 胡姝娅, 李阳, 陈晓鹏, 李红玉, 董宽虎, 何念鹏, 王常慧. 不同类型草原土壤净氮矿化速率的温度敏感性[J]. 植物生态学报, 2024, 48(4): 523-533. |
| [2] | 梁逸娴, 王传宽, 臧妙涵, 上官虹玉, 刘逸潇, 全先奎. 落叶松径向生长和生物量分配对气候变暖的响应[J]. 植物生态学报, 2024, 48(4): 459-468. |
| [3] | 黄玲, 王榛, 马泽, 杨发林, 李岚, SEREKPAYEV Nurlan, NOGAYEV Adilbek, 侯扶江. 长期放牧和氮添加对黄土高原典型草原长芒草种群生长的影响[J]. 植物生态学报, 2024, 48(3): 317-330. |
| [4] | 耿雪琪, 唐亚坤, 王丽娜, 邓旭, 张泽凌, 周莹. 氮添加增加中国陆生植物生物量并降低其氮利用效率[J]. 植物生态学报, 2024, 48(2): 147-157. |
| [5] | 李娜, 唐士明, 郭建英, 田茹, 王姗, 胡冰, 罗永红, 徐柱文. 放牧对内蒙古草地植物群落特征影响的meta分析[J]. 植物生态学报, 2023, 47(9): 1256-1269. |
| [6] | 赵艳超, 陈立同. 土壤养分对青藏高原高寒草地生物量响应增温的调节作用[J]. 植物生态学报, 2023, 47(8): 1071-1081. |
| [7] | 苏炜, 陈平, 吴婷, 刘岳, 宋雨婷, 刘旭军, 刘菊秀. 氮添加与干季延长对降香黄檀幼苗非结构性碳水化合物、养分与生物量的影响[J]. 植物生态学报, 2023, 47(8): 1094-1104. |
| [8] | 李冠军, 陈珑, 余雯静, 苏亲桂, 吴承祯, 苏军, 李键. 固体培养内生真菌对土壤盐胁迫下木麻黄幼苗渗透调节和抗氧化系统的影响[J]. 植物生态学报, 2023, 47(6): 804-821. |
| [9] | 罗娜娜, 盛茂银, 王霖娇, 石庆龙, 何宇. 长期植被恢复对中国西南喀斯特石漠化土壤活性有机碳组分含量和酶活性的影响[J]. 植物生态学报, 2023, 47(6): 867-881. |
| [10] | 杜英东, 袁相洋, 冯兆忠. 不同形态氮对杨树光合特性及生长的影响[J]. 植物生态学报, 2023, 47(3): 348-360. |
| [11] | 和璐璐, 张萱, 章毓文, 王晓霞, 刘亚栋, 刘岩, 范子莹, 何远洋, 席本野, 段劼. 辽东山区不同坡向长白落叶松人工林树冠特征与林木生长关系[J]. 植物生态学报, 2023, 47(11): 1523-1539. |
| [12] | 刘艳杰, 刘玉龙, 王传宽, 王兴昌. 东北温带森林5个羽状复叶树种叶成本-效益关系比较[J]. 植物生态学报, 2023, 47(11): 1540-1550. |
| [13] | 郝晴, 黄昌. 森林地上生物量遥感估算研究综述[J]. 植物生态学报, 2023, 47(10): 1356-1374. |
| [14] | 李变变, 张凤华, 赵亚光, 孙秉楠. 不同刈割程度对油莎豆非结构性碳水化合物代谢及生物量的影响[J]. 植物生态学报, 2023, 47(1): 101-113. |
| [15] | 袁春阳, 李济宏, 韩鑫, 洪宗文, 刘宣, 杜婷, 游成铭, 李晗, 谭波, 徐振锋. 树种对土壤微生物生物量碳氮的影响: 同质园实验[J]. 植物生态学报, 2022, 46(8): 882-889. |
| 阅读次数 | ||||||
|
全文 |
|
|||||
|
摘要 |
|
|||||
Copyright © 2022 版权所有 《植物生态学报》编辑部
地址: 北京香山南辛村20号, 邮编: 100093
Tel.: 010-62836134, 62836138; Fax: 010-82599431; E-mail: apes@ibcas.ac.cn, cjpe@ibcas.ac.cn
备案号: 京ICP备16067583号-19