
植物生态学报 ›› 2017, Vol. 41 ›› Issue (3): 290-300.DOI: 10.17521/cjpe.2016.0258 cstr: 32100.14.cjpe.2016.0258
所属专题: 全球变化与生态系统; 生态系统碳水能量通量
周晓兵1, 张元明1,*( ), 陶冶1,2, 吴林1,3
出版日期:2017-03-10
发布日期:2017-04-12
作者简介:* 通信作者Author for correspondence (E-mail:基金资助:
Xiao-Bing ZHOU1, Yuan-Ming ZHANG1,*(), Ye TAO1,2, Lin WU1,3
Online:2017-03-10
Published:2017-04-12
About author:KANG Jing-yao(1991-), E-mail: 摘要:
沙漠土壤在全球土壤主要温室气体通量中扮演着重要角色, 但是在环境变化条件下的通量估算结果存在很大的不确定性。在新疆古尔班通古特沙漠设定N0、N0.5、N1、N3、N6和N24 6个样方, 以0、0.5、1.0、3.0、6.0和24.0 g·m-2·a-1 6个不同模拟氮(N)沉降浓度进行N处理, 两年后开始对施N样方进行为期两个生长季的N2O、CH4和CO2通量测定。研究表明生长季对照样方(N0)的N2O、CH4和CO2的平均通量分别为4.8 μg·m-2·h-1、-30.5 μg·m-2·h-1和46.7 mg·m-2·h-1, 季节变化显著影响3种气体的通量。N0、N0.5和N1在春季和夏季具有相似的N2O排放速率, 排放速率高于秋季, 而N6和N24的N2O排放主要受N输入时间影响; CH4的吸收在春季和夏季相对较高, 秋季较低; CO2的排放量在第一年春季和夏季之间变化较小, 但高于秋季排放量, 第二年CO2动态与N浓度相关。N增加通常能显著促进N2O的排放, 但受测定季节和年度的影响, 且各处理的N2O排放因子大小无明显规律; CH4的吸收受N增加影响不显著; CO2的排放在第一年不受N增加的影响, 第二年高浓度N增加对春季和夏季CO2排放具有限制作用, 对秋季影响不显著。结构方程模型的研究表明, 对N2O、CH4和CO2的动态变化影响较大的因子分别是施N浓度、土壤温度或土壤含水量和植株密度。整个生长季由N带来的净通量和增温潜力非常小。
周晓兵, 张元明, 陶冶, 吴林. 新疆古尔班通古特沙漠土壤N2O、CH4和CO2通量及其对氮沉降增加的响应. 植物生态学报, 2017, 41(3): 290-300. DOI: 10.17521/cjpe.2016.0258
Xiao-Bing ZHOU, Yuan-Ming ZHANG, Ye TAO, Lin WU. Effluxes of nitrous oxide, methane and carbon dioxide and their responses to increasing nitrogen deposition in the Gurbantünggüt Desert of Xinjiang, China. Chinese Journal of Plant Ecology, 2017, 41(3): 290-300. DOI: 10.17521/cjpe.2016.0258
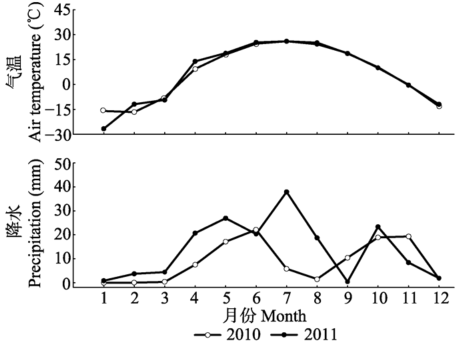
图1 2010和2011年研究区域降水和气温变化。
Fig. 1 Changes in air temperature and precipitation of the study area for 2010 and 2011.
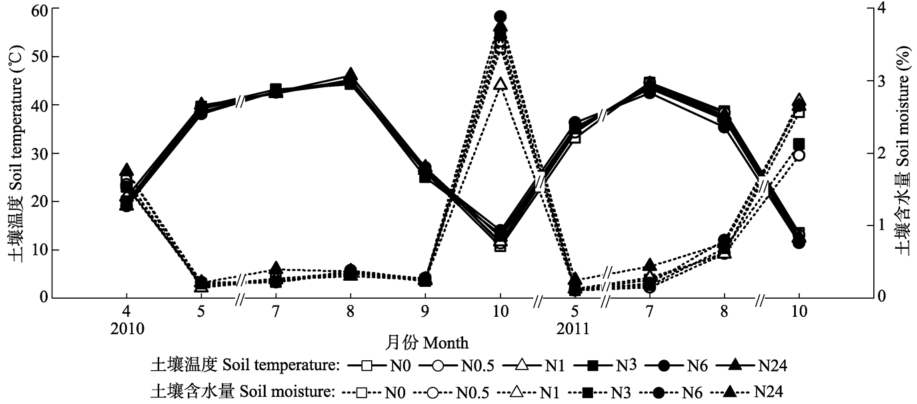
图2 2010和2011年气体采集时各施氮(N)处理土壤温度和土壤含水量变化。N0、N0.5、N1、N3、N6和N24分别是6个样方, 以0、0.5、1.0、3.0、6.0和24.0 g·m-2·a-1 6个不同模拟N沉降浓度进行N处理。
Fig. 2 Changes in soil temperature and moisture at different nitrogen (N) treatments on the gas collected day in 2010 and 2011. N0, N0.5, N1, N3, N6 and N24 indicate 0, 0.5, 1.0, 3.0, 6.0 and 24.0 g·m-2 ·a-1 of simulated N deposition on the studied plots, respectively.
| 自由度 Degree of freedom | N2O | CH4 | CO2 | |
|---|---|---|---|---|
| 季节 Season | 9 | 13.41** | 12.40** | 63.09** |
| N | 5 | 53.19** | 1.84 | 1.55 |
| 季节× N Season × N | 45 | 5.07** | 0.55 | 2.42** |
表1 季节、氮(N)及其交互作用影响3种温室气体通量的重复测量的方差分析
Table 1 Results of repeated measures ANOVAS for the gas efflux on the effects of seasons, nitrogen (N) treatments and their interactions
| 自由度 Degree of freedom | N2O | CH4 | CO2 | |
|---|---|---|---|---|
| 季节 Season | 9 | 13.41** | 12.40** | 63.09** |
| N | 5 | 53.19** | 1.84 | 1.55 |
| 季节× N Season × N | 45 | 5.07** | 0.55 | 2.42** |
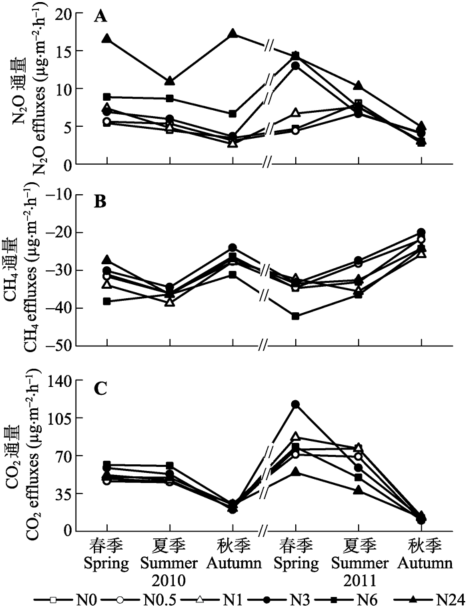
图3 2010和2011年N2O (A)、CH4 (B)、CO2 (C)通量的季节变化。N0、N0.5、N1、N3、N6和N24分别是6个样方, 以0、0.5、1.0、3.0、6.0和24.0 g·m-2·a-1 6个不同模拟氮(N)沉降浓度进行N处理。
Fig. 3 Seasonal changes in N2O (A), CH4 (B) and CO2 (C) effluxes in 2010 and 2011. N0, N0.5, N1, N3, N6 and N24 indicate 0, 0.5, 1.0, 3.0, 6.0 and 24.0 g·m-2·a-1 of simulated nitrogen (N) deposition on the studied plots, respectively.

图4 不同N浓度添加下N2O通量(平均值±标准误差)。A, 5月。B, 8月。C, 10月。*表示两年间差异显著。不同小写字母表示同一年不同处理间差异显著。N0、N0.5、N1、N3、N6和N24分别是6个样方, 以0、0.5、1.0、3.0、6.0和24.0 g·m-2·a-1 6个不同模拟氮(N)沉降浓度进行N处理。
Fig. 4 N2O effluxes under different concentration nitrogen (N) treatments (mean ± SE). A, May. B, August. C, October. * indicates significant differences between two years. Different lowercase letters indicate significant differences among treatments in the same year. N0, N0.5, N1, N3, N6 and N24 indicate 0, 0.5, 1.0, 3.0, 6.0 and 24.0 g·m-2 ·a-1 of simulated N deposition on the studied plots, respectively.
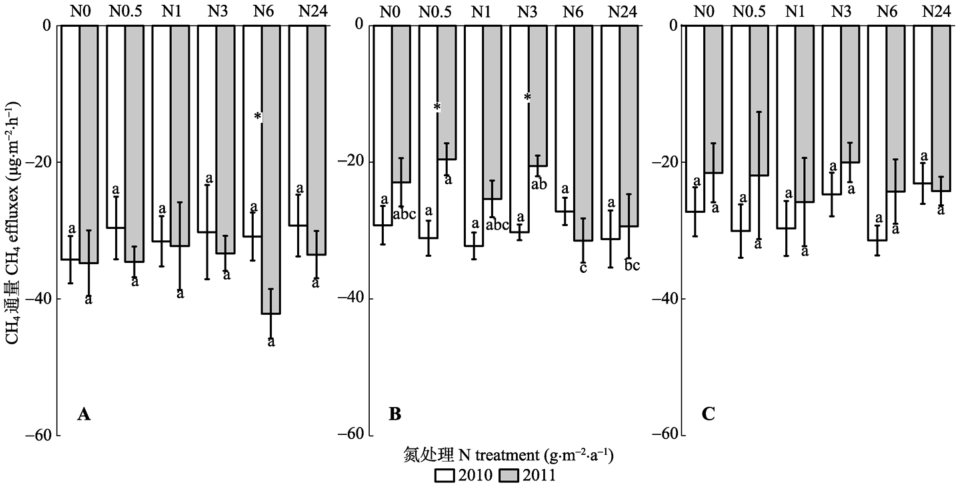
图5 不同N浓度添加下CH4吸收速率(平均值±标准误差)。A, 5月。B, 8月。C, 10月。*表示两年间差异显著。不同小写字母表示同一年不同处理间差异显著。N0、N0.5、N1、N3、N6和N24分别是6个样方, 以0、0.5、1.0、3.0、6.0和24.0 g·m-2·a-1 6个不同模拟氮(N)沉降浓度进行N处理。
Fig. 5 CH4 effluxes under different nitrogen (N) treatments (mean± SE). A, May. B, August. C, October. * indicates significant differences between two years. Different lowercase letters indicate significant differences among treatments in the same year. N0, N0.5, N1, N3, N6 and N24 indicate 0, 0.5, 1.0, 3.0, 6.0 and 24.0 g·m-2·a-1 of simulated N deposition on the plots, respectively.
| 年 Year | N0.5 | N1 | N3 | N6 | N24 |
|---|---|---|---|---|---|
| 2010 | 0.05 | 0.11 | 0.09 | 0.16 | 0.11 |
| 2011 | -0.33 | 0 | 0.03 | 0.04 | 0.03 |
表2 N2O在各个处理的排放因子
Table 2 Emission factor of N2O in different nitrogen (N)-added treatments
| 年 Year | N0.5 | N1 | N3 | N6 | N24 |
|---|---|---|---|---|---|
| 2010 | 0.05 | 0.11 | 0.09 | 0.16 | 0.11 |
| 2011 | -0.33 | 0 | 0.03 | 0.04 | 0.03 |
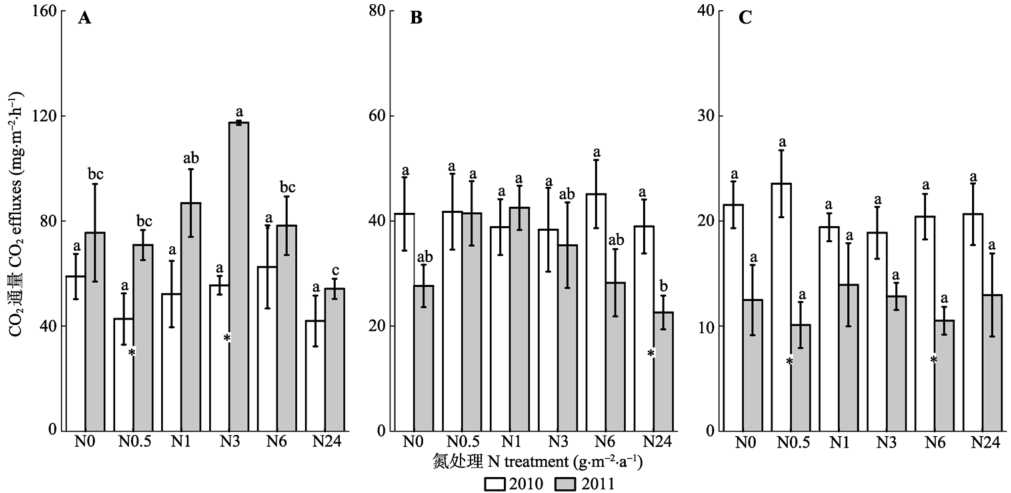
图6 不同N浓度添加下CO2排放速率(平均值±标准误差)。A, 5月。B, 8月。C, 10月。* 表示两年间差异显著。不同小写字母表示同一年不同处理间差异显著。N0、N0.5、N1、N3、N6和N24分别是6个样方, 以0、0.5、1.0、3.0、6.0和24.0 g·m-2·a-1 6个不同模拟氮(N)沉降浓度进行N处理。
Fig. 6 CO2 effluxes under different nitrogen (N) treatments (mean ± SE). A, May. B, August. C, October. * indicates significant differences between two years. Different lowercase letters indicate significant differences among treatments in the same year. N0, N0.5, N1, N3, N6 and N24 indicate 0, 0.5, 1.0, 3.0, 6.0 and 24.0 g·m-2·a-1 of simulated N deposition on the plots, respectively.
| 氮处理 N treatment | 2010 | 2011 | ||||||
|---|---|---|---|---|---|---|---|---|
| N2O | CH4 | CO2 | 增温潜力 GWP | N2O | CH4 | CO2 | 增温潜力 GWP | |
| N0.5 | 1.02 | 0.92 | 0.98 | 0.99 | 0.89 | 0.89 | 0.91 | 0.91 |
| N1 | 1.08 | 0.98 | 1.04 | 1.04 | 1.00 | 1.06 | 1.03 | 1.03 |
| N3 | 1.19 | 0.88 | 1.14 | 1.15 | 1.07 | 0.86 | 0.91 | 0.94 |
| N6 | 1.67 | 1.03 | 1.27 | 1.29 | 1.15 | 1.13 | 0.72 | 1.06 |
| N24 | 2.81 | 0.90 | 1.06 | 1.12 | 1.48 | 1.00 | 0.55 | 0.92 |
表3 生长季各氮(N)处理的温室气体通量和增温潜力与对照(N0)之间的比值
Table 3 The ratios of greenhouse gas effluxes and global warming potentials of nitrogen (N) added plots (N0.5, N1, N3, N6, N24) to controls (N0) during growing seasons
| 氮处理 N treatment | 2010 | 2011 | ||||||
|---|---|---|---|---|---|---|---|---|
| N2O | CH4 | CO2 | 增温潜力 GWP | N2O | CH4 | CO2 | 增温潜力 GWP | |
| N0.5 | 1.02 | 0.92 | 0.98 | 0.99 | 0.89 | 0.89 | 0.91 | 0.91 |
| N1 | 1.08 | 0.98 | 1.04 | 1.04 | 1.00 | 1.06 | 1.03 | 1.03 |
| N3 | 1.19 | 0.88 | 1.14 | 1.15 | 1.07 | 0.86 | 0.91 | 0.94 |
| N6 | 1.67 | 1.03 | 1.27 | 1.29 | 1.15 | 1.13 | 0.72 | 1.06 |
| N24 | 2.81 | 0.90 | 1.06 | 1.12 | 1.48 | 1.00 | 0.55 | 0.92 |
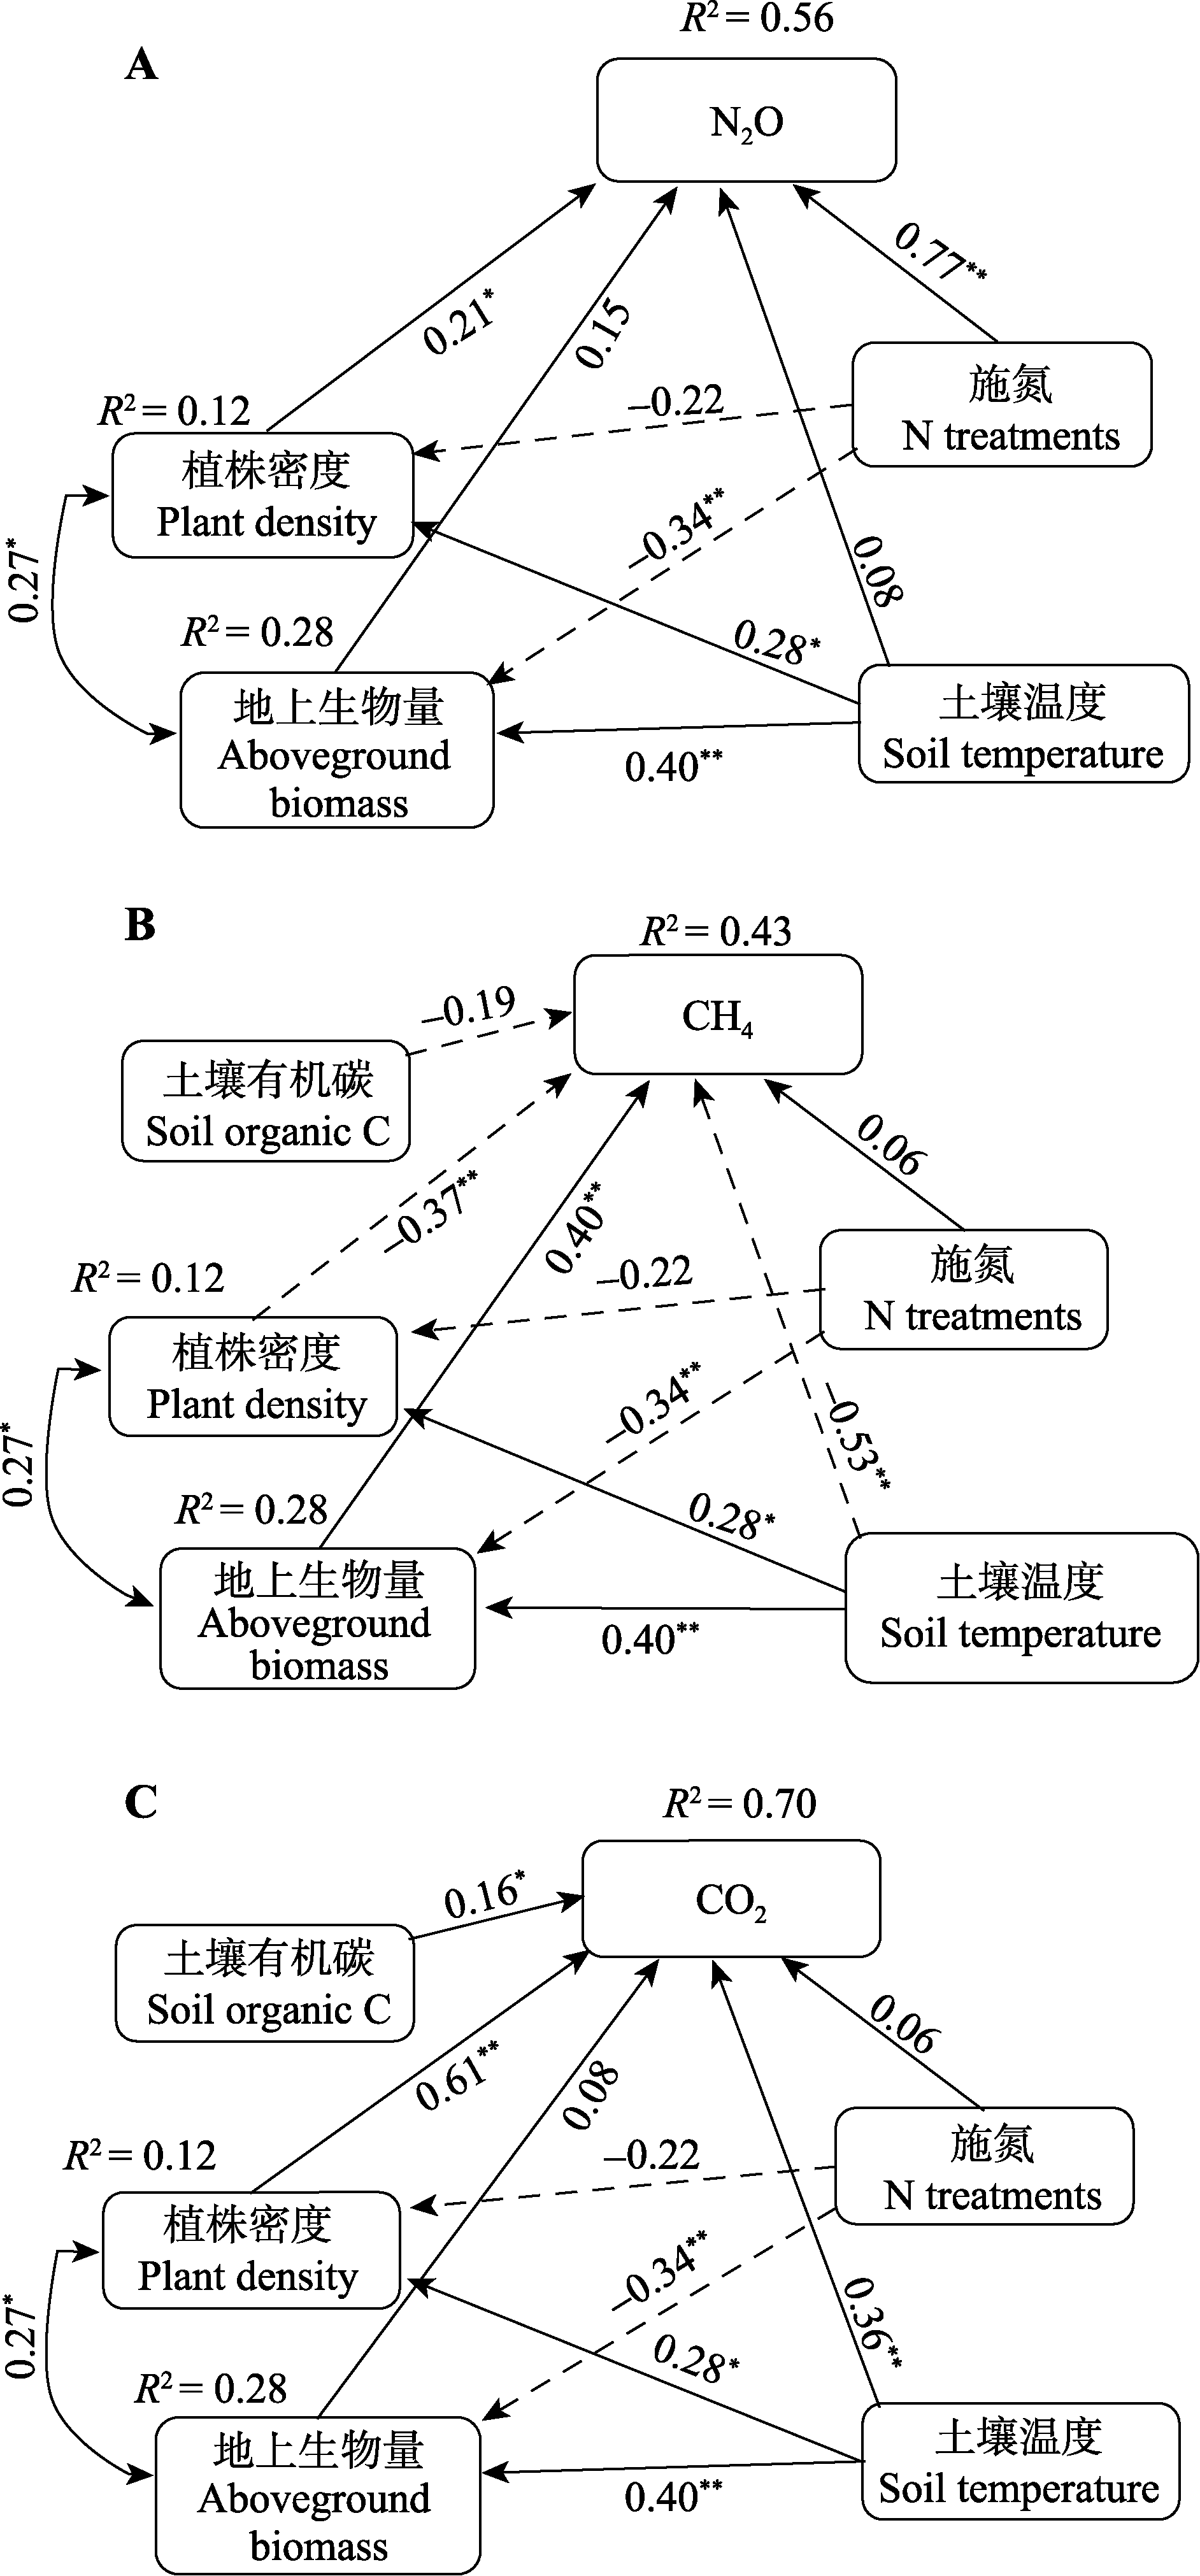
图7 结构方程模型模拟生物和环境因子对温室气体的影响。A, N2O (χ2 = 0.00, p = 0.988; RMSEA = 0.000, p = 0.989)。B, CH4 (χ2 = 0.00, p = 0.988; RMSEA = 0.000, p = 0.989)。C, CO2 (χ2 = 5.12, p = 0.402; RMSEA = 0.020, p = 0.487)。其中, 实线指效应为正, 虚线指效应为负。箭头不同粗细与箭头旁载重系数成正比。RMSEA, 近似误差均方根。*, p < 0.05; **, p < 0.01。
Fig. 7 Final fitted structural equation models depicting relative effects of biotic and abiotic variables on the effulxes of greenhouse gas. A, N2O (χ2 = 0.00, p = 0.988; RMSEA = 0.000, p = 0.989). B, CH4 (χ2 = 0.00, p = 0.988; RMSEA = 0.000, p = 0.989). C, CO2 (χ2 = 5.12, p = 0.402; RMSEA = 0.020, p = 0.487). Continuous and dashed arrows indicate positve and negative relationships, respectively. Arrow width is scaled to be proportional to path coefficients which appear adjacent to arrows. RMSEA, root mean square error of approximation. *, p < 0.05; **, p < 0.01.
| [1] | Adams MB (2003). Ecological issues related to N deposition to natural ecosystems: Research needs. Environment International, 29, 189-199. |
| [2] | Baez S, Fargione J, Moore DI, Collins SL, Gosz JR (2007). Atmospheric nitrogen deposition in the northern Chihu¬ahuan desert: Temporal trends and potential consequences. Journal of Arid Environments, 68, 640-651. |
| [3] | Bai YF, Wu JG, Clark CM, Naeem S, Pan QM, Huang JH, Zhang LX, Han XG (2010). Tradeoffs and thresholds in the effects of nitrogen addition on biodiversity and ecosystem functioning: Evidence from Inner Mongolia Grasslands. Global Change Biology, 16, 358-372. |
| [4] | Bellingrath-Kimura SD, Kishimoto-Mo AW, Oura N, Sekikawa S, Yonemura S, Sudo S, Hayakawa A, Minamikawa K, Takata Y, Hara H (2015). Differences in the spatial variability among CO2, CH4, and N2O gas fluxes from an urban forest soil in Japan. Ambio, 44, 55-66. |
| [5] | Bodelier PLE (2011). Interactions between nitrogenous fertil¬izers and methane cycling in wetland and upland soils. Current Opinion in Environmental Sustainability, 3, 379-388. |
| [6] | Canadell JG, Kirschbaum MUF, Kurz WA, Sanz MJ, Schlamadinger B, Yamagata Y (2007). Factoring out natural and indirect human effects on terrestrial carbon sources and sinks. Environmental Science & Policy, 10, 370-384. |
| [7] | Castro MS, Steudler PA, Melillo JM, Aber JD, Bowden RD (1995). Factors controlling atmospheric methane consum¬ption by temperate forest soils. Global Biogeochemical Cycles, 9, 1-10. |
| [8] | Chen W, Zheng X, Chen Q, Wolf B, Butterbach-Bahl K, Brueggemann N, Lin S (2013). Effects of increasing precipitation and nitrogen deposition on CH4 and N2O fluxes and ecosystem respiration in a degraded steppe in Inner Mongolia, China. Geoderma, 192, 335-340. |
| [9] | Clark CM, Tilman D (2008). Loss of plant species after chronic low level nitrogen deposition to prairie grasslands. Nature, 451, 712-715. |
| [10] | Denman KL, Brasseur GP, Chidthaisong A, Ciais P, Cox PM, Dickinson RE, Hauglustaine DA, Heinze C, Holland EA, Jacob DJ, Lohmann U, Ramachandran S, Leite da Silva Dias P, Wofsy SC, Zhang X, Steffen W (2007). Couplings between changes in the climate system and biogeoche¬mistry. In: Solomon S, Qin D, Manning M, Chen Z, Mar¬quis M eds. Climate Change 2007: The Physical Science Basis Contribution of Working Group I to the Fourth Assessment Report of the Intergovernmental Panel on Climate Change. Cambridge University Press, Cambridge, UK. 501-564. |
| [11] | Emmerton CA, St Louis VL, Lehnherr I, Humphreys ER, Rydz E, Kosolofski HR (2014). The net exchange of methane with high Arctic landscapes during the summer growing season. Biogeosciences, 11, 3095-3106. |
| [12] | Forster P, Ramaswamy V, Artaxo P, Berntsen T, Betts R, Fahey DW, Haywood J, Lean J, Lowe DC, Myhre G, Nganga J, Prinn R, Raga G, Schulz M, van Dorland R (2007). Cha¬nges in Atmospheric Constituents and in Radiative For¬cing Chapter 2. Cambridge University Press, Cambridge, UK. |
| [13] | Galbally IE, Kirstine WV, Meyer CP, Wang YP (2008). Soil-atmosphere trace gas exchange in semiarid and arid zones. Journal of Environmental Quality, 37, 599-607. |
| [14] | Grace JB (2006). Structural Equation Modeling and Natural Systems. Cambridge University Press, Cambridge, UK. 10. |
| [15] | He CE, Liu XJ, Fangmeier A, Zhang FS (2007). Quantifying the total airborne nitrogen input into agroecosystems in the North China Plain. Agriculture, Ecosystems and Environment, 121, 395-400. |
| [16] | Horváth L, Grosz B, Machon A, Tuba Z, Nagy Z, Czóbel SZ, Balogh J, Péli E, Fóti SZ, Weidinger T, Pintér K, Führer E (2010). Estimation of nitrous oxide emission from Hungarian semi-arid sandy and loess grasslands: Effect of soil parameters, grazing, irrigation and use of fertilizer. Agriculture, Ecosystems & Environment, 139, 255-263. |
| [17] | Inclán R, Uribe C, Sánchez L, Sánchez DM, Clavero Á, Fernández AM, Morante R, Blanco A, Jandl R (2012). N2O and CH4 fluxes in undisturbed and burned holm oak, scots pine and pyrenean oak forests in central Spain. Biogeochemistry, 107, 19-41. |
| [18] | IPCC (Intergovernmental Panel on Climate Change) (1996). Contribution of working group I to the second assessment report of the intergovernmental panel on climate change. In: Houghton JJ, Meiro Filho LG, Callander BA, Harris N, Kattenberg A, Maskell K eds. Climate Change 1995: The Science of Climate Change. Cambridge University Press, New York. |
| [19] | Jassal RS, Black TA, Roy R, Ethier G (2011). Effect of nitrogen fertilization on soil CH4 and N2O fluxes, and soil and bole respiration. Geoderma, 162, 182-186. |
| [20] | Jiang CM, Yu GR, Fang HJ, Cao GM, Li YN (2010). Short-term effect of increasing nitrogen deposition on CO2, CH4 and N2O fluxes in an alpine meadow on the Qinghai Tibetan Plateau, China. Atmospheric Environment, 44, 2920-2926. |
| [21] | Konda R, Ohta S, Ishizuka S, Heriyanto J, Wicaksono A (2010). Seasonal changes in the spatial structures of N2O, CO2, and CH4 fluxes from Acacia mangium plantation soils in Indonesia. Soil Biology & Biochemistry, 42, 1512-1522. |
| [22] | Li KH, Gong YM, Song W, He GX, Hu YK, Tian CY, Liu XJ (2012). Responses of CH4, CO2 and N2O fluxes to increasing nitrogen deposition in alpine grassland of the Tianshan Mountains. Chemosphere, 88, 140-143. |
| [23] | Li XY, Cheng SL, Fang HJ, Yu GR, Dang XS, Xu MJ, Wang L, Si GY, Geng J, He S (2015a). The contrasting effects of deposited NH4+ and NO3- on soil CO2, CH4 and N2O fluxes in a subtropical plantation, southern China. Ecological Eng¬ineering, 85, 317-327. |
| [24] | Li YY, Dong SK, Liu SL, Zhou HK, Gao QZ, Cao GM, Wang XX, Su XK, Zhang Y, Tang L, Zhao HD, Wu XY (2015b). Seasonal changes of CO2, CH4 and N2O fluxes in different types of alpine grassland in the Qinghai Tibetan Plateau of China. Soil Biology & Biochemistry, 80, 306-314. |
| [25] | Liu L, Greaver TL (2009). A review of nitrogen enrichment effects on three biogenic GHGs: The CO2 sink may be largely offset by stimulated N2O and CH4 emission. Ecology Letters, 12, 1103-1117. |
| [26] | Maris SC, Teira Esmatges MR, Arbones A, Rufat J (2015). Effect of irrigation, nitrogen application, and a nitrification inhibitor on nitrous oxide, carbon dioxide and methane emissions from an olive (Olea europaea L.) orchard. Science of the Total Environment, 538, 966-978. |
| [27] | Mo JM, Fang YT, Lin ED, Li YE (2006). Soil N2O emission and its response to simulated N deposition in the main forests of Dinghushan in subtropical China. Journal of Plant Ecology (Chinese Version), 30, 901-910. (in Chinese with English abstract)[莫江明, 方运霆, 林而达, 李玉娥 (2006). 鼎湖山主要森林土壤N2O排放及其对模拟N沉降的响应. 植物生态学报, 30, 901-910.] |
| [28] | Schaeffer SM, Evans RD (2005). Pulse additions of soil carbon and nitrogen affect soil nitrogen dynamics in an arid Colorado Plateau shrubland. Oecologia, 145, 425-433. |
| [29] | Schoenbach P, Wolf B, Dickhoefer U, Wiesmeier M, Chen WW, Wan HW, Gierus M, Butterbach Bahl K, Koegel Knabner I, Susenbeth A, Zheng XH, Taube F (2012). Grazing effects on the greenhouse gas balance of a temperate steppe ecosystem. Nutrient Cycling in Agroecosystems, 93, 357-371. |
| [30] | Stewart KJ, Brummell ME, Farrell RE, Siciliano SD (2012). N2O flux from plant soil systems in polar deserts switch between sources and sinks under different light conditions. Soil Biology & Biochemistry, 48, 69-77. |
| [31] | Striegl RG, Mcconnaughey TA, Thorstenson DC, Weeks EP, Woodward JC (1992). Consumption of atmospheric methane by desert soils. Nature, 357, 145-147. |
| [32] | Vourlitis GL, Pasquini S, Zorba G (2007). Plant and soil N response of southern californian semi arid shrublands after 1 year of experimental N deposition. Ecosystems, 10, 263-279. |
| [33] | Wang YF, Chen H, Zhu QA, Peng CH, Wu N, Yang G, Zhu D, Tian JQ, Tian LX, Kang XM, He YX, Gao YH, Zhao XQ (2014). Soil methane uptake by grasslands and forests in China. Soil Biology & Biochemistry, 74, 70-81. |
| [34] | Wang ZW, Hao XY, Shan D, Han GD, Zhao ML, Willms WD, Wang Z, Han X (2011). Influence of increasing temperature and nitrogen input on greenhouse gas emissions from a desert steppe soil in Inner Mongolia. Soil Science and Plant Nutrition, 57, 508-518. |
| [35] | Wohlfahrt G, Fenstermaker LF, Arnone Iii JA (2008). Large annual net ecosystem CO2 uptake of a Mojave Desert ecosystem. Global Change Biology, 14, 1475-1487. |
| [36] | Xu BX, Hu YG, Zhang ZS, Chen YL, Zhang P, Li G (2014). Effects of experimental warming on CO2, CH4 and N2O fluxes of biological soil crust and soil system in a desert region. Chinese Journal of Plant Ecology, 38, 809-820. (in Chinese with English abstract)[徐冰鑫, 胡宜刚, 张志山, 陈永乐, 张鹏, 李刚 (2014). 模拟增温对荒漠生物土壤结皮-土壤系统CO2、CH4和N2O通量的影响. 植物生态学报, 38, 809-820.] |
| [37] | Xu R, Wang M, Wang Y (2003a). Using a modified DNDC model to estimate N2O fluxes from semi arid grassland in China. Soil Biology & Biochemistry, 35, 615-620. |
| [38] | Xu R, Wang YS, Zheng XH, Ji BM, Wang MX (2003b). A comparison between measured and modeled N2O emissions from Inner Mongolian semi-arid grassland. Plant and Soil, 255, 513-528. |
| [39] | Yan JH, Zhang W, Wang KY, Qin F, Wang WT, Dai HT, Li PX (2014). Responses of CO2, N2O and CH4 fluxes between atmosphere and forest soil to changes in multiple environmental conditions. Global Change Biology, 20, 300-312. |
| [40] | Zaady E, Groffman PM, Standing D, Shachak M (2013). High N2O emissions in dry ecosystems. European Journal of Soil Biology, 59, 1-7. |
| [41] | Zhang C, Niu D, Hall SJ, Wen H, Li X, Fu H, Wan C, Elser JJ (2014). Effects of simulated nitrogen deposition on soil respiration components and their temperature sensitivities in a semiarid grassland. Soil Biology & Biochemistry, 75, 113-123. |
| [42] | Zhang JB, Cai ZC, Cheng Y, Zhu TB (2009). Denitrification and total nitrogen gas production from forest soils of Eastern China. Soil Biology & Biochemistry, 41, 2551-2557. |
| [43] | Zhang W, Liu XJ, Hu YK, Li KH, Shen JL, Luo XS, Song W (2011). Analysis on input of atmospheric nitrogen dry deposition in Ürümqi. Arid Zone Research, 28, 771-716. (in Chinese with English abstract)[张伟, 刘学军, 胡玉昆, 李凯辉, 沈健林, 骆晓声, 宋韦 (2011). 乌鲁木齐市区大气N素干沉降的输入性分析. 干旱区研究, 28, 771-716.] |
| [44] | Zhang Y, Zheng LX, Liu XJ, Jickells T, Cape JN, Goulding K, Fangmeier A, Zhang FS (2008). Evidence for organic N deposition and its anthropogenic sources in China. Atmospheric Environment, 42, 1035-1041. |
| [45] | Zhou F, Shang ZY, Ciais P, Tao S, Piao SL, Raymond P, He CF, Li BG, Wang RH, Wang XH, Peng SS, Zeng ZZ, Chen H, Ying N, Hou XK, Xu P (2014). A new high-resolution N2O emission inventory for China in 2008. Environmental Science & Technology, 48, 8538-8547. |
| [46] | Zhou XB, Zhang YM (2014). Seasonal pattern of soil respiration and gradual changing effects of nitrogen addition in a soil of the Gurbantünggüt Desert, northwestern China. Atmospheric Environment, 85, 187-194. |
| [47] | Zhou XB, Zhang YM, Downing A (2012). Non linear response of microbial activity across a gradient of nitrogen addition to a soil from the Gurbantünggüt Desert, northwestern China. Soil Biology & Biochemistry, 47, 67-77. |
| [48] | Zhuang QL, Chen M, Xu K, Tang JY, Saikawa E, Lu YY, Melillo JM, Prinn RG, McGuire AD (2013). Response of global soil consumption of atmospheric methane to changes in atmospheric climate and nitrogen deposition. Global Biogeochemical Cycles, 27, 650-663. |
| [1] | 邹纪开, 吴佳怡, 谷云懿, 陈宝明. 不同形态氮添加与丛枝菌根真菌对外来入侵植物白花鬼针草竞争力的影响[J]. 植物生态学报, 2026, 50(3): 722-730. |
| [2] | 张诚航, 卫星, 吴纯泽, 王裕尧, 李浩楠. 大气还原态氮干湿沉降下水曲柳和兴安落叶松菌根化苗木生长响应[J]. 植物生态学报, 2026, 50(3): 649-659. |
| [3] | 张静, 陈洁, 李艳朋, 盘李军, 许涵, 李意德, 何海生. 南亚热带针阔混交人工林植物生物量比较及其影响因子分析[J]. 植物生态学报, 2026, 50(2): 400-416. |
| [4] | 贾会丽, 王睿, 常玉良, 林茂, 栗国梁, 武帅楷, 苏原, 董宽虎, $\boxed{\hbox{王常慧}}$. 不同水平氮添加下晋北赖草叶片化学计量特征及其对光合的影响[J]. 植物生态学报, 2026, 50(2): 429-441. |
| [5] | 汪子轩, 邢爱军, 陈子歆, 沈海花, 方精云. 长期氮添加对北方森林林下植物功能性状的影响[J]. 植物生态学报, 2026, 50(2): 244-255. |
| [6] | 徐恩相, 周蕾, 章晓炜, 张国萍, 仲杜伟, 黄智, 刘派, 迟永刚. 基于不同生育阶段冠层光谱和碳通量的水稻产量估算[J]. 植物生态学报, 2026, 50(1): 82-93. |
| [7] | 张法伟, 李红琴, 祝景彬, 樊博, 周华坤, 李英年, 梁乃申. 氮添加和降水改变对高寒草甸生态系统地上与地下碳储的影响[J]. 植物生态学报, 2025, 49(9): 1399-1409. |
| [8] | 邢强, 赵斌, 胡永红, 杨君, 秦俊, 刘何铭, 王红兵, 周鹏. 华东地区两种典型立体绿化植物根系性状特征及对新型土壤基质的响应[J]. 植物生态学报, 2025, 49(9): 1498-1514. |
| [9] | 宋珊珊, 唐志尧. 河北塞罕坝草甸草原根际土壤真菌与植物地上生物量的关系[J]. 植物生态学报, 2025, 49(9): 1461-1471. |
| [10] | 朱瑞德, 杨俊薇, 刘宵含, 陈冰瑞, 池秀莲, 田地, 杨光, 程蒙, 戴亚峰, 王诗文. 霍山石斛设施和林下栽培模式中养分对植物-微生物关联的调控[J]. 植物生态学报, 2025, 49(9): 1434-1447. |
| [11] | 樊月玲, 蒋正德, 叶佳舒, 郑立臣, 陈欣. 2005-2015年下辽河平原农田长期观测样地主要农作物收获期性状和产量数据集[J]. 植物生态学报, 2025, 49(8): 1271-1282. |
| [12] | 刘新月, 王立平, 刘春和, 孙艳丽, 刘鹏, 田赟, 贾昕, 查天山, 钱多. 北京不同林龄人工林生物量空间格局及其影响因素[J]. 植物生态学报, 2025, 49(6): 939-951. |
| [13] | 马腾飞, 郝杰, 刁华杰, 宁亚楠, $\boxed{\hbox{王常慧}}$, 董宽虎. 晋北农牧交错带草地土壤无机氮含量的季节变化及其对放牧强度的响应[J]. 植物生态学报, 2025, 49(6): 965-974. |
| [14] | 朱润铖, 蔡锡安, 黄娟. 植物防御相关挥发性有机物排放及对氮沉降的响应[J]. 植物生态学报, 2025, 49(5): 681-696. |
| [15] | 蒋晓玉, 于欣淼, 廖琴, 张金伟, 吴雪峰, 王旭, 潘俊彤, 王俊锋, 穆春生, 石玉杰. 陆地植物排放氧化亚氮的研究进展[J]. 植物生态学报, 2025, 49(4): 513-525. |
| 阅读次数 | ||||||
|
全文 |
|
|||||
|
摘要 |
|
|||||
Copyright © 2026 版权所有 《植物生态学报》编辑部
地址: 北京香山南辛村20号, 邮编: 100093
Tel.: 010-62836134, 62836138; Fax: 010-82599431; E-mail: apes@ibcas.ac.cn, cjpe@ibcas.ac.cn
备案号: 京ICP备16067583号-19
![]()