
植物生态学报 ›› 2013, Vol. 37 ›› Issue (3): 209-219.DOI: 10.3724/SP.J.1258.2013.00021 cstr: 32100.14.SP.J.1258.2013.00021
王敏, 苏永中*( ), 杨荣, 杨晓
发布日期:2014-02-12
作者简介: E-mail: suyzh@lzb.ac.cn基金资助:
WANG Min, SU Yong-Zhong*(), YANG Rong, YANG Xiao
Published:2014-02-12
摘要:
草地生态系统中地上和地下生物量的分配方式对于研究生态系统碳储量和碳循环有着重要的意义。为了解黑河中游荒漠草地的地上和地下生物量分配格局, 从群落和个体两个水平对黑河中游的地上和地下生物量进行了调查。结果表明: 群落水平上地上生物量介于3.2-559.2 g·m-2之间, 地下生物量介于3.3-188.2 g·m-2之间, 个体水平上地上生物量介于6.1-489.0 g·株-1之间, 地下生物量介于2.4-244.2 g·株-1之间, 群落水平上的根冠比(R/S)为0.10-2.49, 个体水平上为0.07-1.55, 地下生物量均小于地上生物量, 群落水平上R/S值大于个体水平。群落和个体水平地上和地下生物量的拟合斜率分别为1.1001和0.9913, 与1没有显著差异, 说明地上与地下生物量呈等速生长关系。群落和个体水平土壤表层0-20 cm和0-30 cm的根系生物量分别占全部根系生物量的89.81%、96.95%和81.42%、93.62%, 表明地下生物量主要集中在0-20 cm和0-30 cm土壤表层。
王敏, 苏永中, 杨荣, 杨晓. 黑河中游荒漠草地地上和地下生物量的分配格局. 植物生态学报, 2013, 37(3): 209-219. DOI: 10.3724/SP.J.1258.2013.00021
WANG Min, SU Yong-Zhong, YANG Rong, YANG Xiao. Allocation patterns of above- and belowground biomass in desert grassland in the middle reaches of Heihe River, Gansu Province, China. Chinese Journal of Plant Ecology, 2013, 37(3): 209-219. DOI: 10.3724/SP.J.1258.2013.00021
| 生物量 Biomass | 群落水平 Community level (g·m-2) | 个体水平 Individual level (g·株-1) | |||||||||
|---|---|---|---|---|---|---|---|---|---|---|---|
| 样本量 Sample size | 最大值 Max | 最小值 Min | 平均值 Mean | 中值 Median | 样本量 Sample size | 最大值 Max | 最小值 Min | 平均值 Mean | 中值 Median | ||
| 地上生物量 Aboveground biomass | 215 | 559.20 | 3.20 | 153.60 | 135.46 | 99 | 489.03 | 6.13 | 112.85 | 82.89 | |
| 地下生物量 Belowground biomass | 83 | 188.20 | 3.28 | 58.01 | 62.01 | 99 | 244.23 | 2.40 | 41.53 | 30.03 | |
| 总生物量 Total biomass | 83 | 530.67 | 10.87 | 197.52 | 184.19 | 99 | 660.76 | 8.53 | 154.38 | 119.15 | |
| R/S | 83 | 2.49 | 0.10 | 0.54 | 0.44 | 99 | 1.55 | 0.07 | 0.44 | 0.35 | |
表1 黑河中游荒漠草地群落和个体水平地上和地下生物量及根冠比(R/S)
Table 1 Above- and belowground biomass and ratio of root to shoot (R/S) at community and individual levels of desert grassland in the middle reaches of Heihe River
| 生物量 Biomass | 群落水平 Community level (g·m-2) | 个体水平 Individual level (g·株-1) | |||||||||
|---|---|---|---|---|---|---|---|---|---|---|---|
| 样本量 Sample size | 最大值 Max | 最小值 Min | 平均值 Mean | 中值 Median | 样本量 Sample size | 最大值 Max | 最小值 Min | 平均值 Mean | 中值 Median | ||
| 地上生物量 Aboveground biomass | 215 | 559.20 | 3.20 | 153.60 | 135.46 | 99 | 489.03 | 6.13 | 112.85 | 82.89 | |
| 地下生物量 Belowground biomass | 83 | 188.20 | 3.28 | 58.01 | 62.01 | 99 | 244.23 | 2.40 | 41.53 | 30.03 | |
| 总生物量 Total biomass | 83 | 530.67 | 10.87 | 197.52 | 184.19 | 99 | 660.76 | 8.53 | 154.38 | 119.15 | |
| R/S | 83 | 2.49 | 0.10 | 0.54 | 0.44 | 99 | 1.55 | 0.07 | 0.44 | 0.35 | |
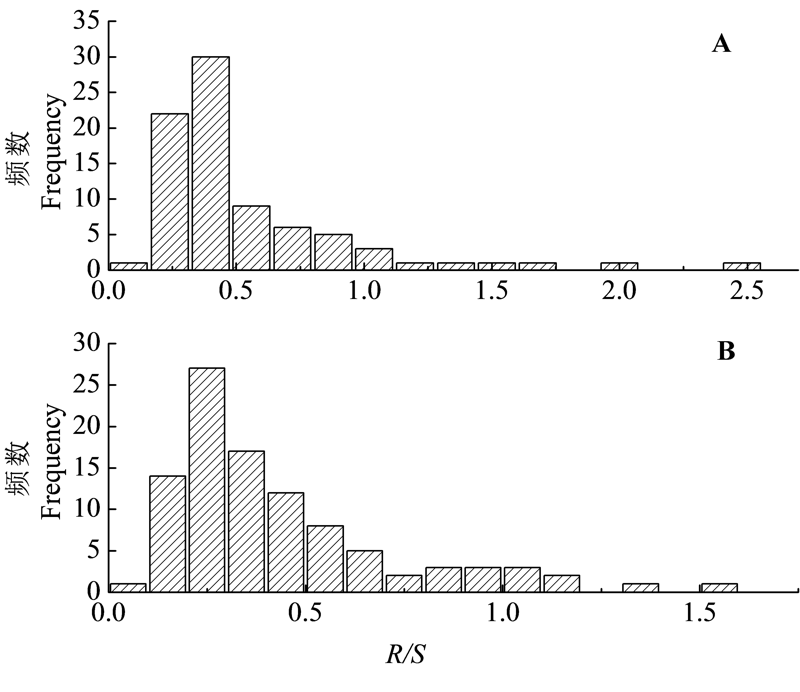
图1 黑河中游荒漠草地群落(A)和个体水平(B)上根冠比(R/S)频数分布。
Fig. 1 Frequency distribution of ratio of root to shoot (R/S) at community (A) and individual (B) levels of desert grassland in the middle reaches of Heihe River.
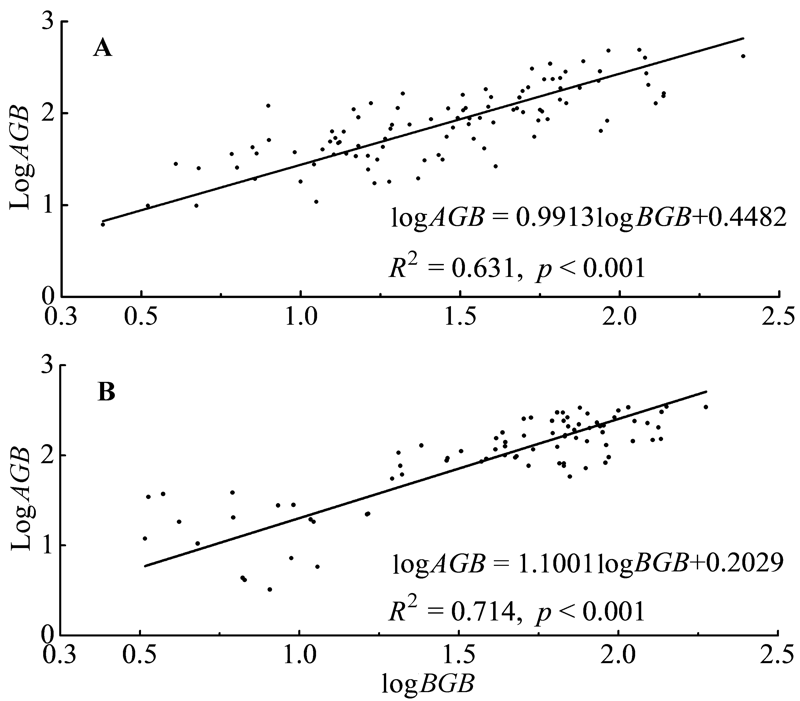
图2 黑河中游荒漠草地个体(A)和群落水平(B)上地上生物量(AGB)和地下生物量(BGB)的等速生长关系。
Fig. 2 Isometric relationships between aboveground biomass (AGB) and belowground biomass (BGB) at individual (A) and community (B) levels of desert grassland in the middle reaches of Heihe River.
| 水平 Level | 样本量 Sample size | R2 | p | 斜率(95%置信区间) Slope (95% confidence interval) | 截距 Intercept | p (H0:斜率=1) p (H0:slope=1) |
|---|---|---|---|---|---|---|
| 群落水平 Community level | 83 | 0.714 | <0.001 | 1.100 1 (0.977 7-1.237 9) | 0.202 9 | 0.112 |
| 珍珠猪毛菜 Salsola passerina | 28 | 0.213 | <0.05 | 1.091 2 (0.768 6-1.549 2) | 0.259 0 | 0.620 |
| 合头草 Sympegma regelii | 10 | 0.400 | <0.05 | 1.659 8 (0.915 0-3.010 8) | -1.147 1 | 0.090 |
| 红砂 Reaumuria songarica | 13 | 0.521 | <0.01 | 1.137 3 (0.729 1-1.774 0) | 0.305 3 | 0.549 |
| 紫菀木 Asterothamnus alyssoides | 12 | 0.651 | <0.01 | 0.693 3 (0.462 4-1.039 3) | 0.896 3 | 0.073 |
| 个体水平 Individual level | 99 | 0.631 | <0.001 | 0.991 3 (0.877 3-1.120 1) | 0.448 2 | 0.887 |
| 珍珠猪毛菜 Salsola passerina | 19 | 0.468 | <0.01 | 0.793 3 (0.550 6-1.143 1) | 0.762 2 | 0.204 |
| 合头草 Sympegma regelii | 16 | 0.881 | <0.001 | 0.910 4 (0.747 8-1.108 5) | 0.296 2 | 0.326 |
| 红砂 Reaumuria songarica | 29 | 0.656 | <0.001 | 1.032 7 (0.820 9-1.299 2) | 0.456 6 | 0.778 |
| 紫菀木 Asterothamnus alyssoides | 35 | 0.731 | <0.001 | 1.022 3 (0.851 6-1.227 3) | 0.469 7 | 0.808 |
表2 黑河中游荒漠草地群落和个体水平地上和地下生物量的分配模式
Table 2 Allocation patterns between aboveground biomass (AGB) and belowground biomass (BGB) at community and individual levels of desert grassland in the middle reaches of Heihe River
| 水平 Level | 样本量 Sample size | R2 | p | 斜率(95%置信区间) Slope (95% confidence interval) | 截距 Intercept | p (H0:斜率=1) p (H0:slope=1) |
|---|---|---|---|---|---|---|
| 群落水平 Community level | 83 | 0.714 | <0.001 | 1.100 1 (0.977 7-1.237 9) | 0.202 9 | 0.112 |
| 珍珠猪毛菜 Salsola passerina | 28 | 0.213 | <0.05 | 1.091 2 (0.768 6-1.549 2) | 0.259 0 | 0.620 |
| 合头草 Sympegma regelii | 10 | 0.400 | <0.05 | 1.659 8 (0.915 0-3.010 8) | -1.147 1 | 0.090 |
| 红砂 Reaumuria songarica | 13 | 0.521 | <0.01 | 1.137 3 (0.729 1-1.774 0) | 0.305 3 | 0.549 |
| 紫菀木 Asterothamnus alyssoides | 12 | 0.651 | <0.01 | 0.693 3 (0.462 4-1.039 3) | 0.896 3 | 0.073 |
| 个体水平 Individual level | 99 | 0.631 | <0.001 | 0.991 3 (0.877 3-1.120 1) | 0.448 2 | 0.887 |
| 珍珠猪毛菜 Salsola passerina | 19 | 0.468 | <0.01 | 0.793 3 (0.550 6-1.143 1) | 0.762 2 | 0.204 |
| 合头草 Sympegma regelii | 16 | 0.881 | <0.001 | 0.910 4 (0.747 8-1.108 5) | 0.296 2 | 0.326 |
| 红砂 Reaumuria songarica | 29 | 0.656 | <0.001 | 1.032 7 (0.820 9-1.299 2) | 0.456 6 | 0.778 |
| 紫菀木 Asterothamnus alyssoides | 35 | 0.731 | <0.001 | 1.022 3 (0.851 6-1.227 3) | 0.469 7 | 0.808 |
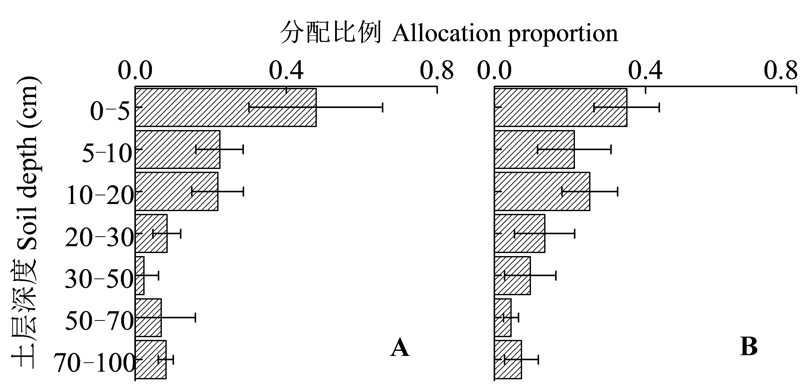
图3 黑河中游荒漠草地地下生物量的垂直分布(平均值±标准误差)。A, 群落水平。 B, 个体水平。
Fig. 3 Vertical distribution of belowground biomass in desert grassland in the middle reaches of Heihe River (mean ± SE). A, Community level. B, Individual level.
| 水平 Level | 土层深度 Soil depth (cm) | 样本数 Sample size | 根系生物量累积百分率 Cumulative percentage of root biomass | ||
|---|---|---|---|---|---|
| 最小值 Min | 最大值 Max | 中值 Mean | |||
| 群落水平 Community level | 0-20 | 20 | 48.78% | 100% | 89.81% |
| 0-30 | 20 | 61.88% | 100% | 96.95% | |
| 个体水平 Individual level | 0-20 | 99 | 44.20% | 100% | 81.42% |
| 0-30 | 99 | 61.02% | 100% | 93.62% | |
表3 黑河中游荒漠草地群落和个体水平根系生物量的累积分布
Table 3 Cumulative distribution of root biomass in community and individual levels of desert grassland in the middle reaches of Heihe River
| 水平 Level | 土层深度 Soil depth (cm) | 样本数 Sample size | 根系生物量累积百分率 Cumulative percentage of root biomass | ||
|---|---|---|---|---|---|
| 最小值 Min | 最大值 Max | 中值 Mean | |||
| 群落水平 Community level | 0-20 | 20 | 48.78% | 100% | 89.81% |
| 0-30 | 20 | 61.88% | 100% | 96.95% | |
| 个体水平 Individual level | 0-20 | 99 | 44.20% | 100% | 81.42% |
| 0-30 | 99 | 61.02% | 100% | 93.62% | |
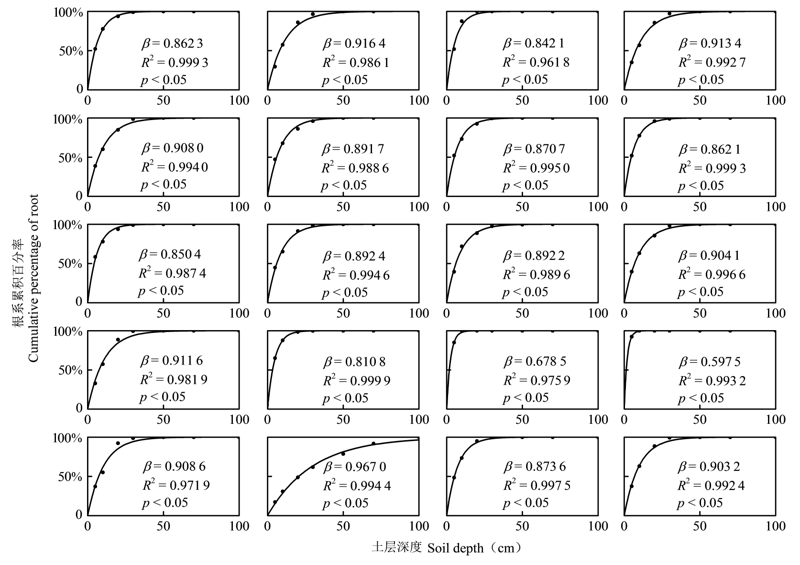
图4 黑河中游荒漠草地20个样地群落水平根系生物量的垂直分布。β, 拟合参数。
Fig. 4 Vertical distribution of root biomass of 20 sample plots at community level of desert grassland in the middle reaches of Heihe River. β, fitted parameter.
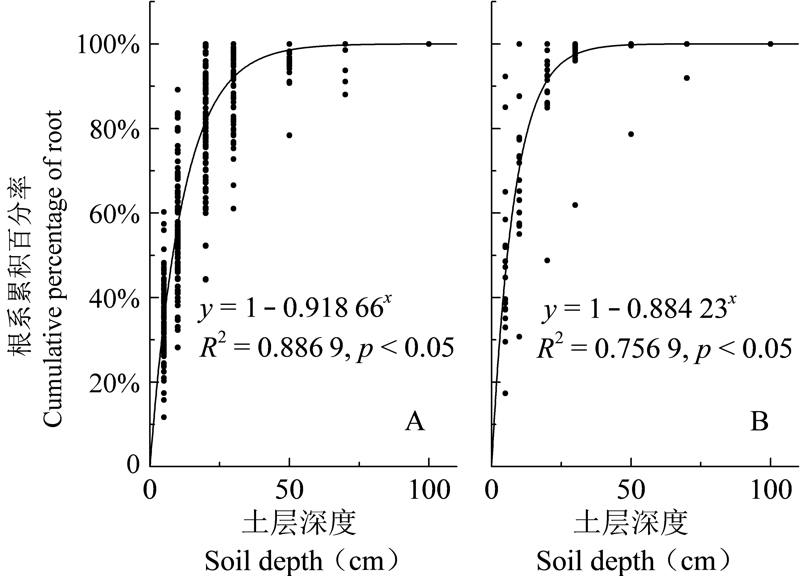
图5 黑河中游荒漠草地个体和群落水平根系生物量的垂直分布。A, 个体水平。B, 群落水平。
Fig. 5 Vertical distribution of root biomass at community and individual levels of desert grassland in the middle reaches of Heihe River. A, Individual level. B, Community level.
| 草地类型 Grassland type | 地上生物量 Aboveground biomass (g·m-2) | 地下生物量 Belowground biomass (g·m-2) | 总生物量 Total biomass (g·m-2) | 文献来源 Reference |
|---|---|---|---|---|
| 草甸草原 Meadow steppe | 183.4 | 1 140.7 | NA | |
| NA | 2 415.7 | NA | ||
| 122.4 | 643.8 | NA | ||
| 典型草原 Typical steppe | 103.4 | 590.3 | NA | |
| NA | 1 777.7 | NA | ||
| 135.1 | 553.9 | NA | ||
| 高寒草原 Alpine steppe | 50.1 | 277.7 | 327.8 | |
| 荒漠草原 Desert steppe | 45.1 | 270.1 | NA | |
| NA | 1 038.8 | NA | ||
| 34.2 | 855.0 | NA | ||
| 荒漠草地 Desert grassland | 153.6 | 58.01 | 197.57 | This study |
| 135.8 | NA | NA | ||
| 0.96-1.93 | NA | NA | ||
| 0.1-0.7 | 0.7-13.5 | 0.7-13.6 | ||
| 内蒙古温带草地 Temperate grassland of Inner Mongolia | 106.9 | 650.8 | NA | |
| 中国草地 Grassland of China | 97.0 | 604.2 | 701.2 |
表4 不同草地类型地上、地下和总生物量的比较
Table 4 Comparison of above- and belowground biomass and total biomass in different grassland types
| 草地类型 Grassland type | 地上生物量 Aboveground biomass (g·m-2) | 地下生物量 Belowground biomass (g·m-2) | 总生物量 Total biomass (g·m-2) | 文献来源 Reference |
|---|---|---|---|---|
| 草甸草原 Meadow steppe | 183.4 | 1 140.7 | NA | |
| NA | 2 415.7 | NA | ||
| 122.4 | 643.8 | NA | ||
| 典型草原 Typical steppe | 103.4 | 590.3 | NA | |
| NA | 1 777.7 | NA | ||
| 135.1 | 553.9 | NA | ||
| 高寒草原 Alpine steppe | 50.1 | 277.7 | 327.8 | |
| 荒漠草原 Desert steppe | 45.1 | 270.1 | NA | |
| NA | 1 038.8 | NA | ||
| 34.2 | 855.0 | NA | ||
| 荒漠草地 Desert grassland | 153.6 | 58.01 | 197.57 | This study |
| 135.8 | NA | NA | ||
| 0.96-1.93 | NA | NA | ||
| 0.1-0.7 | 0.7-13.5 | 0.7-13.6 | ||
| 内蒙古温带草地 Temperate grassland of Inner Mongolia | 106.9 | 650.8 | NA | |
| 中国草地 Grassland of China | 97.0 | 604.2 | 701.2 |
| 草地类型 Grassland type | 群落水平 Community level | 个体水平 Individual level | |||||||
|---|---|---|---|---|---|---|---|---|---|
| 样本量 Sample size | 最大值 Max | 最小值 Min | 中值 Mean | 样本量 Sample size | 最大值 Max | 最小值 Min | 中值 Mean | ||
| 全球 Global | 46 | 26 | 0.8 | 4.5 | 324 | 7.33 | 0.05 | 0.59 | |
| 高寒草甸 Alpine meadow | 73 | 13 | 0.8 | 5.2 | 65 | 17.72 | 0.21 | 0.47 | |
| 高寒草原 Alpine steppe | 39 | 12.7 | 1.4 | 6.8 | 36 | 10.23 | 0.26 | 1.68 | |
| 草甸草原 Meadow steppe | 18 | 14.7 | 1.9 | 5.2 | 34 | 5.36 | 0.30 | 1.11 | |
| 典型草原 Typical steppe | 54 | 19.9 | 0.4 | 5.3 | 47 | 8.16 | 0.29 | 0.67 | |
| 荒漠草原 Desert steppe | 44 | 32.2 | 0.4 | 6.3 | 25 | 12.48 | 0.25 | 1.40 | |
| 荒漠草地 Desert grassland | 83 | 2.5 | 0.1 | 0.5 | 99 | 1.55 | 0.06 | 0.44 | |
表5 群落和个体水平不同草地类型的根冠比(R/S)
Table 5 Ratio of root to shoot (R/S) for different grassland types at individual and community levels
| 草地类型 Grassland type | 群落水平 Community level | 个体水平 Individual level | |||||||
|---|---|---|---|---|---|---|---|---|---|
| 样本量 Sample size | 最大值 Max | 最小值 Min | 中值 Mean | 样本量 Sample size | 最大值 Max | 最小值 Min | 中值 Mean | ||
| 全球 Global | 46 | 26 | 0.8 | 4.5 | 324 | 7.33 | 0.05 | 0.59 | |
| 高寒草甸 Alpine meadow | 73 | 13 | 0.8 | 5.2 | 65 | 17.72 | 0.21 | 0.47 | |
| 高寒草原 Alpine steppe | 39 | 12.7 | 1.4 | 6.8 | 36 | 10.23 | 0.26 | 1.68 | |
| 草甸草原 Meadow steppe | 18 | 14.7 | 1.9 | 5.2 | 34 | 5.36 | 0.30 | 1.11 | |
| 典型草原 Typical steppe | 54 | 19.9 | 0.4 | 5.3 | 47 | 8.16 | 0.29 | 0.67 | |
| 荒漠草原 Desert steppe | 44 | 32.2 | 0.4 | 6.3 | 25 | 12.48 | 0.25 | 1.40 | |
| 荒漠草地 Desert grassland | 83 | 2.5 | 0.1 | 0.5 | 99 | 1.55 | 0.06 | 0.44 | |
| [1] |
Bai YF, Han XG, Wu JG, Chen ZZ, Li LH (2004). Ecosystem stability and compensatory effects in the Inner Mongolia grassland. Nature, 431, 181-184.
URL PMID |
| [2] | Bloom AJ, Chapin FS, Mooney HA (1985). Resource limitation in plants--an economic analogy. Annual Review of Ecology and Systematics, 16, 363-392. |
| [3] | Brown SL, Schroeder P, Kern JS (1999). Spatial distribution of biomass in forests of the eastern USA. Forest Ecology and Management, 123, 81-90. |
| [4] |
Cairns MA, Brown S, Helmer EH, Baumgardner GA (1997). Root biomass allocation in the world’s upland forests. Oecologia, 111, 1-11.
DOI URL PMID |
| [5] | Chapin FS, Bloom AJ, Field CB, Waring RH (1987). Plant responses to multiple environmental factors. BioScience, 37, 49-57. |
| [6] | Cheng DL (2007). Plant Allometric Study of Biomass Allocation Pattern and Biomass Production Rates. PhD dissertation, Lanzhou University, Lanzhou. (in Chinese with English abstract) |
| [ 程栋梁 (2007). 植物生物量分配模式与生长速率的相关规律研究. 博士学位论文, 兰州大学, 兰州.] | |
| [7] |
Cheng DL, Niklas KJ (2007). Above- and below-ground biomass relationships across 1534 forested communities. Annals of Botany, 99, 95-102.
URL PMID |
| [8] | Deng JM, Wang GX, Morris EC, Wei XP, Li DX, Chen BM, Zhao CM, Liu J, Wang Y (2006). Plant mass-density relationship along a moisture gradient in Northwest China. Journal of Ecology, 94, 953-958. |
| [9] |
Enquist BJ, Niklas KJ (2002). Global allocation rules for patterns of biomass partitioning in seed plants. Science, 295, 1517-1520.
URL PMID |
| [10] | Fan JW, Wang K, Harris W, Zhong HP, Hu ZM, Han B, Zhang WY, Wang JB (2009). Allocation of vegetation biomass across a climate-related gradient in the grasslands of Inner Mongolia. Journal of Arid Environments, 73, 521-528. |
| [11] | Fang JY, Liu GH, Xu SL, Wang GC, Wen YP (2007). Carbon Library in Terrestrial Ecosystem in China, China Environmental Science Press. Beijing. 109-128. (in Chinese) |
| [ 方精云, 刘国华, 徐嵩龄, 王庚辰, 温玉璞 (2007). 中国陆地生态系统的碳库. 中国环境科学出版社, 北京. 109-128.] | |
| [12] | Gale MR, Grigal DF (1987). Vertical root distributions of northern tree species in relation to successional status. Canadian Journal of Forest Research, 17, 829-834. |
| [13] | Houghton RA (2005). Aboveground forest biomass and the global carbon balance. Global Change Biology, 11, 945-958. |
| [14] |
Jackson RB, Canadell J, Ehleringer JR, Mooney HA, Sala OE, Schulze ED (1996). A global analysis of root distributions for terrestrial biomes. Oecologia, 108, 389-411.
URL PMID |
| [15] | Jin Z, Dong YS, Qi YC, An ZS (2010). Soil respiration and net primary productivity in perennial grass and desert shrub ecosystems at the Ordos Plateau of Inner Mongolia, China. Journal of Arid Environments, 74, 1248-1256. |
| [16] | Kuzyakov Y, Domanski G (2000). Carbon input by plants into the soil. Review. Journal of Plant Nutrition and Soil Science, 163, 421-431. |
| [17] | Litton CM, Raich JW, Ryan MG (2007). Carbon allocation in forest ecosystems. Global Change Biology, 13, 2089-2109. |
| [18] | Li B (2000). Ecology. Higher Education Press. Beijing. (in Chinese) |
| [ 李博 (2000). 生态学 高等教育出版社, 北京.] | |
| [19] | Ma WH (2006). Carbon Storage in the Temperate Grassland of Inner Mongolia. PhD dissertation, Peking University, Beijing. (in Chinese with English abstract) |
| [ 马文红 (2006). 内蒙古温带草地的碳储量. 博士学位论文, 北京大学, 北京.] | |
| [20] | Ma WH, Fang JY (2006). R:S ratios of temperate steppe and the environmental controls in Inner Mongolia. Acta Scientiarum Naturalium Universitatis Pekinensis, 42, 774-778. (in Chinese with English abstract) |
| [ 马文红, 方精云 (2006). 内蒙古温带草原的根冠比及其影响因素. 北京大学学报(自然科学版), 42, 774-778.] | |
| [21] | Mokany K, Raison R, Prokushkin AS (2006). Critical analysis of root: shoot ratios in terrestrial biomes. Global Change Biology, 12, 84-96. |
| [22] | Ni J (2002). Carbon storage in grasslands of China. Journal of Arid Environments, 50, 205-218. |
| [23] | Ni J (2004). Estimating net primary productivity of grasslands from field biomass measurements in temperate northern China. Plant Ecology, 174, 217-234. |
| [24] |
Niklas KJ (2005). Modelling below- and above-ground biomass for non-woody and woody plants. Annals of Botany, 95, 315-321.
URL PMID |
| [25] | Niklas KJ (2006). A phyletic perspective on the allometry of plant biomass-partitioning patterns and functionally equivalent organ-categories. New Phytologist, 171, 27-40. |
| [26] |
Piao SL, Fang JY, Ciais P, Peylin P, Huang Y, Sitch S, Wang T (2009). The carbon balance of terrestrial ecosystems in China. Nature, 458, 1009-1013.
URL PMID |
| [27] | Qi YC, Dong YS, Geng YB, Yang XH, Geng HL (2003). The progress in the carbon cycle researches in grassland ecosystem in China. Progress in Geography, 22, 342-352. (in Chinese with English abstract) |
| [ 齐玉春, 董云社, 耿元波, 杨小红, 耿会立 (2003). 我国草地生态系统碳循环研究进展. 地理科学进展, 22, 342-352.] | |
| [28] |
Sokal RR, Rohlf FJ (1995). Biometry: the Principles and Practice of Statistics in Biological Research. WH Freeman and Company, New York.
URL PMID |
| [29] |
Southgate RI, Masters P, Seely MK (1996). Precipitation and biomass changes in the Namib Desert dune ecosystem. Journal of Arid Environments, 33, 267-280.
DOI URL |
| [30] |
Wang L, Niu KC, Yang YH, Zhou P (2010). Patterns of above- and belowground biomass allocation in China’s grasslands: evidence from individual-level observations. Science China Life Sciences, 53, 851-857.
DOI URL PMID |
| [31] |
Warton DI, Wright IJ, Falster DS, Westoby M (2006). Bivariate line-fitting methods for allometry. Biological Reviews, 81, 259-291.
DOI URL PMID |
| [32] | Weiner J (2004). Allocation, plasticity and allometry in plants. Perspectives in Plant Ecology, Evolution and Systematics, 6, 207-215. |
| [33] | Wilson JB (1988). A review of evidence on the control of shoot: root ratio, in relation to models. Annals of Botany, 61, 433-449. |
| [34] | Xia Y, Moore DI, Collins SL, Muldavin EH (2010). Aboveground production and species richness of annuals in Chihuahuan Desert grassland and shrubland plant communities. Journal of Arid Environments, 74, 378-385. |
| [35] | Yang YH (2008). Carbon and Nitrogen Storage in Alpine Grasslands on the Tibetan Plateau. PhD dissertation, Peking University, Beijing. (in Chinese with English abstract) |
| [ 杨元合 (2008). 青藏高原高寒草地生态系统碳氮储量. 博士学位论文, 北京大学, 北京.] | |
| [36] | Yang YH, Fang JY, Ji CJ, Han WX (2009a). Above- and belowground biomass allocation in Tibetan grasslands. Journal of Vegetation Science, 20, 177-184. |
| [37] | Yang YH, Fang JY, Ma WH, Guo DL, Mohammat A (2010). Large-scale pattern of biomass partitioning across China’s grasslands. Global Ecology and Biogeography, 19, 268-277. |
| [38] | Yang YH, Fang JY, Pan YD, Ji CJ (2009b). Aboveground biomass in Tibetan grasslands. Journal of Arid Environments, 73, 91-95. |
| [1] | 张静, 陈洁, 李艳朋, 盘李军, 许涵, 李意德, 何海生. 南亚热带针阔混交人工林植物生物量比较及其影响因子分析[J]. 植物生态学报, 2026, 50(2): 400-416. |
| [2] | 徐恩相, 周蕾, 章晓炜, 张国萍, 仲杜伟, 黄智, 刘派, 迟永刚. 基于不同生育阶段冠层光谱和碳通量的水稻产量估算[J]. 植物生态学报, 2026, 50(1): 82-93. |
| [3] | 朱瑞德, 杨俊薇, 刘宵含, 陈冰瑞, 池秀莲, 田地, 杨光, 程蒙, 戴亚峰, 王诗文. 霍山石斛设施和林下栽培模式中养分对植物-微生物关联的调控[J]. 植物生态学报, 2025, 49(9): 1434-1447. |
| [4] | 宋珊珊, 唐志尧. 河北塞罕坝草甸草原根际土壤真菌与植物地上生物量的关系[J]. 植物生态学报, 2025, 49(9): 1461-1471. |
| [5] | 邢强, 赵斌, 胡永红, 杨君, 秦俊, 刘何铭, 王红兵, 周鹏. 华东地区两种典型立体绿化植物根系性状特征及对新型土壤基质的响应[J]. 植物生态学报, 2025, 49(9): 1498-1514. |
| [6] | 张法伟, 李红琴, 祝景彬, 樊博, 周华坤, 李英年, 梁乃申. 氮添加和降水改变对高寒草甸生态系统地上与地下碳储的影响[J]. 植物生态学报, 2025, 49(9): 1399-1409. |
| [7] | 樊月玲, 蒋正德, 叶佳舒, 郑立臣, 陈欣. 2005-2015年下辽河平原农田长期观测样地主要农作物收获期性状和产量数据集[J]. 植物生态学报, 2025, 49(8): 1271-1282. |
| [8] | 刘新月, 王立平, 刘春和, 孙艳丽, 刘鹏, 田赟, 贾昕, 查天山, 钱多. 北京不同林龄人工林生物量空间格局及其影响因素[J]. 植物生态学报, 2025, 49(6): 939-951. |
| [9] | 马腾飞, 郝杰, 刁华杰, 宁亚楠, $\boxed{\hbox{王常慧}}$, 董宽虎. 晋北农牧交错带草地土壤无机氮含量的季节变化及其对放牧强度的响应[J]. 植物生态学报, 2025, 49(6): 965-974. |
| [10] | 陈文义, 王智勇, 周梦岩, 麻文俊, 王军辉, 罗志斌, 周婧. 幼龄楸树生物量分配规律与异速生长模型[J]. 植物生态学报, 2025, 49(2): 356-366. |
| [11] | 郝毅晴, 刘伟, 杨阳, 安冰儿, 范冰, 李超, 崔久辉, 程延彬, 孙佳美, 潘庆民. 有机肥和无机肥对退化草原羊草种群密度和个体生物量的影响[J]. 植物生态学报, 2025, 49(1): 148-158. |
| [12] | 王袼, 胡姝娅, 李阳, 陈晓鹏, 李红玉, 董宽虎, 何念鹏, 王常慧. 不同类型草原土壤净氮矿化速率的温度敏感性[J]. 植物生态学报, 2024, 48(4): 523-533. |
| [13] | 梁逸娴, 王传宽, 臧妙涵, 上官虹玉, 刘逸潇, 全先奎. 落叶松径向生长和生物量分配对气候变暖的响应[J]. 植物生态学报, 2024, 48(4): 459-468. |
| [14] | 黄玲, 王榛, 马泽, 杨发林, 李岚, SEREKPAYEV Nurlan, NOGAYEV Adilbek, 侯扶江. 长期放牧和氮添加对黄土高原典型草原长芒草种群生长的影响[J]. 植物生态学报, 2024, 48(3): 317-330. |
| [15] | 高敏, 缑倩倩, 王国华, 郭文婷, 张宇, 张妍. 低温胁迫对不同母树年龄柠条锦鸡儿种子萌发幼苗生理和生长的影响[J]. 植物生态学报, 2024, 48(2): 201-214. |
| 阅读次数 | ||||||
|
全文 |
|
|||||
|
摘要 |
|
|||||
Copyright © 2026 版权所有 《植物生态学报》编辑部
地址: 北京香山南辛村20号, 邮编: 100093
Tel.: 010-62836134, 62836138; Fax: 010-82599431; E-mail: apes@ibcas.ac.cn, cjpe@ibcas.ac.cn
备案号: 京ICP备16067583号-19
![]()