
植物生态学报 ›› 2025, Vol. 49 ›› Issue (6): 939-951.DOI: 10.17521/cjpe.2023.0325 cstr: 32100.14.cjpe.2023.0325
刘新月1, 王立平2, 刘春和2, 孙艳丽3, 刘鹏1, 田赟1, 贾昕1, 查天山1,*( ), 钱多4
收稿日期:2023-11-07
接受日期:2024-05-06
出版日期:2025-06-20
发布日期:2024-05-07
通讯作者:
*查天山(tianshanzha@bjfu.edu.cn)基金资助:
LIU Xin-Yue1, WANG Li-Ping2, LIU Chun-He2, SUN Yan-Li3, LIU Peng1, TIAN Yun1, JIA Xin1, ZHA Tian-Shan1,*(), QIAN Duo4
Received:2023-11-07
Accepted:2024-05-06
Online:2025-06-20
Published:2024-05-07
Contact:
*ZHA Tian-Shan(tianshanzha@bjfu.edu.cn)Supported by:摘要:
为揭示城市人工林生物量空间变化及其空间异质性的驱动因子, 阐明不同驱动因子对生物量空间分异影响的适宜范围。以北京市不同林龄人工林为研究对象, 基于森林清查数据, 利用转换因子连续函数法得到小班尺度人工林生物量; 选取气候(气温、降水量、日照时数)、植被(归一化植被指数, NDVI)、地形(高程、坡度、坡向)和人为(夜间灯光指数、国内生产总值、人口密度)因子, 运用线性回归分析、多项式拟合等方法分析生物量对各影响因子的响应; 利用随机森林预测不同林龄生物量的空间分布, 基于地理探测器量化各因子及其交互作用对生物量空间异质性的解释力度, 确定各因子对生物量影响的适宜范围。主要结果: (1)生物量随林龄的增加而增大, 幼龄林、中龄林、近熟林、成熟林和过熟林生物量分别为35.22、75.42、88.71、96.17和148.59 Mg·hm-2。(2)相较于地形因子, 气候因子、植被因子和人为因子对生物量的影响更大。幼龄林生物量对各因子的响应与其他林龄存在差别, 可能与幼龄林存在较多的抚育有关。(3)对生物量空间异质性解释最强的因子分别为夜间灯光指数(52.91%)、日照时数(51.28%)和降水量(45.75%)。(4)影响因子之间的交互作用均为非线性增强或双因子增强, 林龄自身对生物量空间异质性的影响较小, 但其与降水量、夜间灯光指数、国内生产总值和人口密度交互后解释力度达到70%以上。(5)气温在12.3-13.0 ℃、降水量在526.8-542.6 mm、日照时数在2 543.1-2 602.8 h、NDVI在0.46-0.59范围内, 中度人为干扰的平坡上具有较高的生物量。因此, 生物量的空间分异是由多种因子共同作用的, 想要获取更高的生物量需要综合考虑研究区的特点。结果有助于更好地理解人工林生物量与影响因子之间的关系, 为后续造林工程的实施和人工林抚育等提供科学合理的理论依据。
刘新月, 王立平, 刘春和, 孙艳丽, 刘鹏, 田赟, 贾昕, 查天山, 钱多. 北京不同林龄人工林生物量空间格局及其影响因素. 植物生态学报, 2025, 49(6): 939-951. DOI: 10.17521/cjpe.2023.0325
LIU Xin-Yue, WANG Li-Ping, LIU Chun-He, SUN Yan-Li, LIU Peng, TIAN Yun, JIA Xin, ZHA Tian-Shan, QIAN Duo. Spatial pattern of biomass and its influencing factors for plantations with different stand ages in Beijing. Chinese Journal of Plant Ecology, 2025, 49(6): 939-951. DOI: 10.17521/cjpe.2023.0325
| 数据类别 Data type | 数据名称 Data | 数据来源 Data source |
|---|---|---|
| 森林清查数据 Forest inventory data | 林分蓄积 Stand volume | 2014年北京市森林清查数据 Forest inventory data of Beijing in 2014 |
| 林分面积 Stand area | ||
| 林龄 Stand age | ||
| 优势树种 Dominate tree species | ||
| 气候因子 Climatic factor | 气温 Air temperature | 国家科技基础条件平台-国家地球系统科学数据中心 National Earth System Science Data Center ( |
| 降水 Precipitation | ||
| 日照时数 Sunshine duration | ||
| 植被因子 Vegetation factor | 归一化植被指数 Normalized difference vegetation index (NDVI) | NASA MODIS归一化植被指数产品 The NASA Moderate-Resolution Imaging Spectroradiometer (MODIS) dataset (MOD13Q1 V006) ( |
| 地形因子 Topographical factor | 高程 Elevation | 空间分辨率12.5 m的ALOS高程数据 Elevation of ALOS with 12.5 m spatial resolution ( |
| 坡度 Slope | 基于数字高程模型 Based on digital elevation model (DEM) | |
| 坡向 Aspect | ||
| 人为因子 Anthropogenic factor | 夜间灯光指数 Nighttime lights index | 地球观测组年度夜间灯光指数 Earth Observation Group annual nighttime lights index ( |
| 国内生产总值 Gross domestic product | 国家科技基础条件平台-国家地球系统科学数据中心 National Earth System Science Data Center ( | |
| 人口密度 Population density |
表1 北京人工林数据来源及说明
Table 1 Description and resource of the data of plantations in Beijing
| 数据类别 Data type | 数据名称 Data | 数据来源 Data source |
|---|---|---|
| 森林清查数据 Forest inventory data | 林分蓄积 Stand volume | 2014年北京市森林清查数据 Forest inventory data of Beijing in 2014 |
| 林分面积 Stand area | ||
| 林龄 Stand age | ||
| 优势树种 Dominate tree species | ||
| 气候因子 Climatic factor | 气温 Air temperature | 国家科技基础条件平台-国家地球系统科学数据中心 National Earth System Science Data Center ( |
| 降水 Precipitation | ||
| 日照时数 Sunshine duration | ||
| 植被因子 Vegetation factor | 归一化植被指数 Normalized difference vegetation index (NDVI) | NASA MODIS归一化植被指数产品 The NASA Moderate-Resolution Imaging Spectroradiometer (MODIS) dataset (MOD13Q1 V006) ( |
| 地形因子 Topographical factor | 高程 Elevation | 空间分辨率12.5 m的ALOS高程数据 Elevation of ALOS with 12.5 m spatial resolution ( |
| 坡度 Slope | 基于数字高程模型 Based on digital elevation model (DEM) | |
| 坡向 Aspect | ||
| 人为因子 Anthropogenic factor | 夜间灯光指数 Nighttime lights index | 地球观测组年度夜间灯光指数 Earth Observation Group annual nighttime lights index ( |
| 国内生产总值 Gross domestic product | 国家科技基础条件平台-国家地球系统科学数据中心 National Earth System Science Data Center ( | |
| 人口密度 Population density |
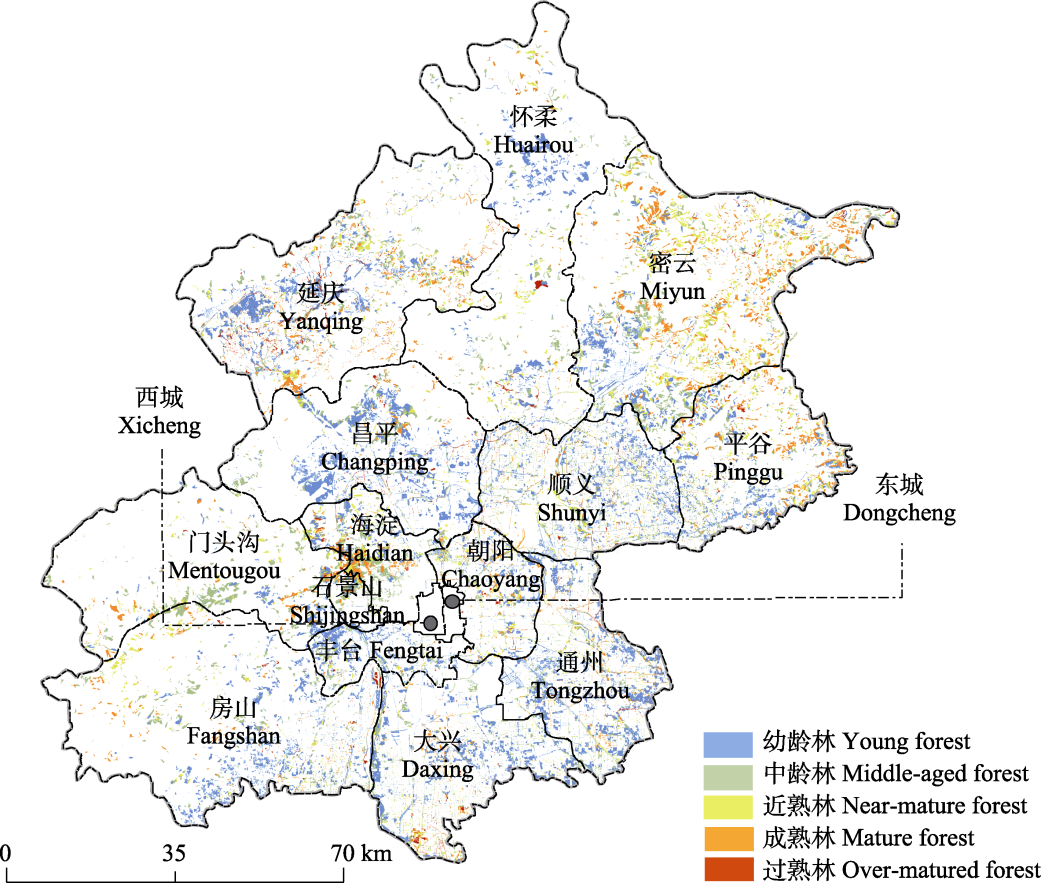
图1 北京市不同林龄人工林空间分布。
Fig. 1 Spatial distribution of plantations with different stand ages in Beijing.
| 树种 Species | a | b | 参考文献 Reference |
|---|---|---|---|
| 白桦 Betula platyphylla | 1.069 | 10.237 | Yang et al., |
| 白皮松 Pinus bungeana | 0.529 | 25.087 | Yang et al., |
| 侧柏 Platycladus orientalis | 0.490 | 30.427 | Zhang et al., |
| 胡桃楸 Juglans mandshurica | 1.039 | 2.373 | Zhang et al., |
| 华山松 Pinus armandi | 0.458 | 32.666 | Yang et al., |
| 栎属 Quercus | 0.785 | 16.715 | Zhang et al., |
| 垂柳 Salix babylonica | 0.892 | 28.441 | Zhang et al., |
| 栾树 Koelreuteria paniculata | 0.892 | 28.441 | Zhang et al., |
| 落叶松 Larix gmelinii | 0.610 | 33.806 | Yang et al., |
| 五角槭 Acer pictum subsp. mono | 0.892 | 28.441 | Zhang et al., |
| 杨属 Populus | 0.497 | 26.973 | Yang et al., |
| 银杏 Ginkgo biloba | 0.892 | 28.441 | Zhang et al., |
| 油松 Pinus tabuliformis | 0.869 | 9.121 | Yang et al., |
| 硬木类、软木类 Hardwoods, softwoods | 0.892 | 28.441 | Zhang et al., |
| 阔叶混交林 Mixed broadleaf forest | 0.739 | 43.210 | Zhang et al., |
表2 北京人工林生物量计算基本参数表
Table 2 Parameters used for calculating biomass of plantations in Beijing
| 树种 Species | a | b | 参考文献 Reference |
|---|---|---|---|
| 白桦 Betula platyphylla | 1.069 | 10.237 | Yang et al., |
| 白皮松 Pinus bungeana | 0.529 | 25.087 | Yang et al., |
| 侧柏 Platycladus orientalis | 0.490 | 30.427 | Zhang et al., |
| 胡桃楸 Juglans mandshurica | 1.039 | 2.373 | Zhang et al., |
| 华山松 Pinus armandi | 0.458 | 32.666 | Yang et al., |
| 栎属 Quercus | 0.785 | 16.715 | Zhang et al., |
| 垂柳 Salix babylonica | 0.892 | 28.441 | Zhang et al., |
| 栾树 Koelreuteria paniculata | 0.892 | 28.441 | Zhang et al., |
| 落叶松 Larix gmelinii | 0.610 | 33.806 | Yang et al., |
| 五角槭 Acer pictum subsp. mono | 0.892 | 28.441 | Zhang et al., |
| 杨属 Populus | 0.497 | 26.973 | Yang et al., |
| 银杏 Ginkgo biloba | 0.892 | 28.441 | Zhang et al., |
| 油松 Pinus tabuliformis | 0.869 | 9.121 | Yang et al., |
| 硬木类、软木类 Hardwoods, softwoods | 0.892 | 28.441 | Zhang et al., |
| 阔叶混交林 Mixed broadleaf forest | 0.739 | 43.210 | Zhang et al., |
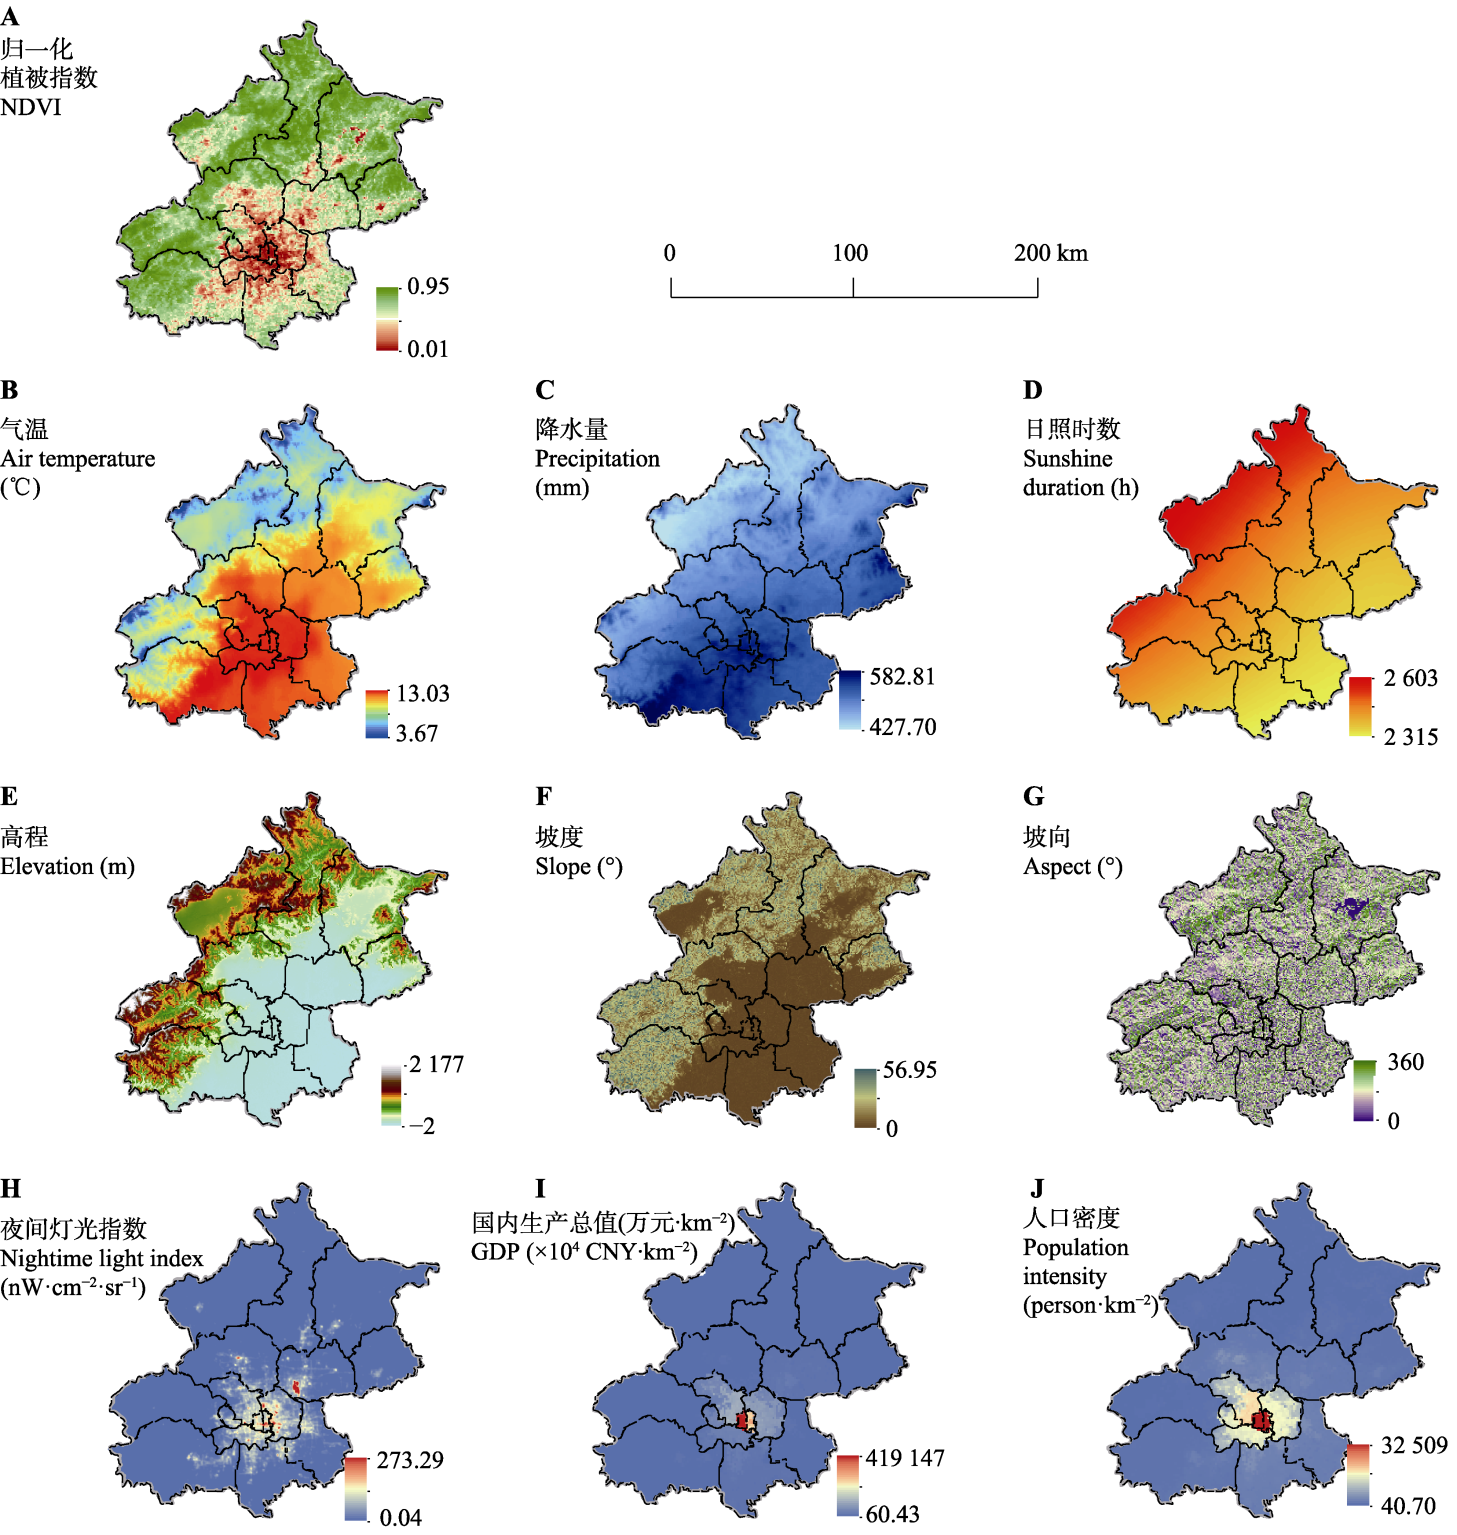
图2 北京人工林植被因子(A)、气候因子(B-D)、地形因子(E-G)和人为因子(H-J)空间分布。
Fig. 2 Spatial distribution of vegetation (A), climatic (B-D), topographical (E-G) and anthropogenic (H-J) factors of plantation in Beijing. GDP, gross domestics product; NDVI, normalized difference vegetation index.
| 判断依据 Criterion | 交互结果 Interaction result |
|---|---|
| q(X1∩X2) < min[q(X1), q(X2)] | 非线性减弱 Weaken, nonlinear |
| min[q(X1), q(X2)] < q(X1∩X2) < max[q(X1), q(X2)] | 单因子非线性减弱 Weaken, univariate |
| q(X1∩X2) > max(q(X1), q(X2)) | 双因子增强 Enhance, bivariate |
| q(X1∩X2) = q(X1) + q(X2) | 独立 Independent |
| q(X1∩X2) > q(X1) + q(X2) | 非线性增强 Enhance, nonlinear |
表3 任意两个影响因子对北京人工林生物量交互作用的类型
Table 3 Types of interaction between two influencing factors and the biomass of plantation in Beijing
| 判断依据 Criterion | 交互结果 Interaction result |
|---|---|
| q(X1∩X2) < min[q(X1), q(X2)] | 非线性减弱 Weaken, nonlinear |
| min[q(X1), q(X2)] < q(X1∩X2) < max[q(X1), q(X2)] | 单因子非线性减弱 Weaken, univariate |
| q(X1∩X2) > max(q(X1), q(X2)) | 双因子增强 Enhance, bivariate |
| q(X1∩X2) = q(X1) + q(X2) | 独立 Independent |
| q(X1∩X2) > q(X1) + q(X2) | 非线性增强 Enhance, nonlinear |
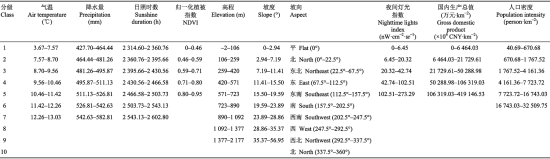 |
表4 生物量影响因子分级标准
Table 4 Classification criteria of factors affecting biomass NDVI, normalized difference vegetation index.
| |
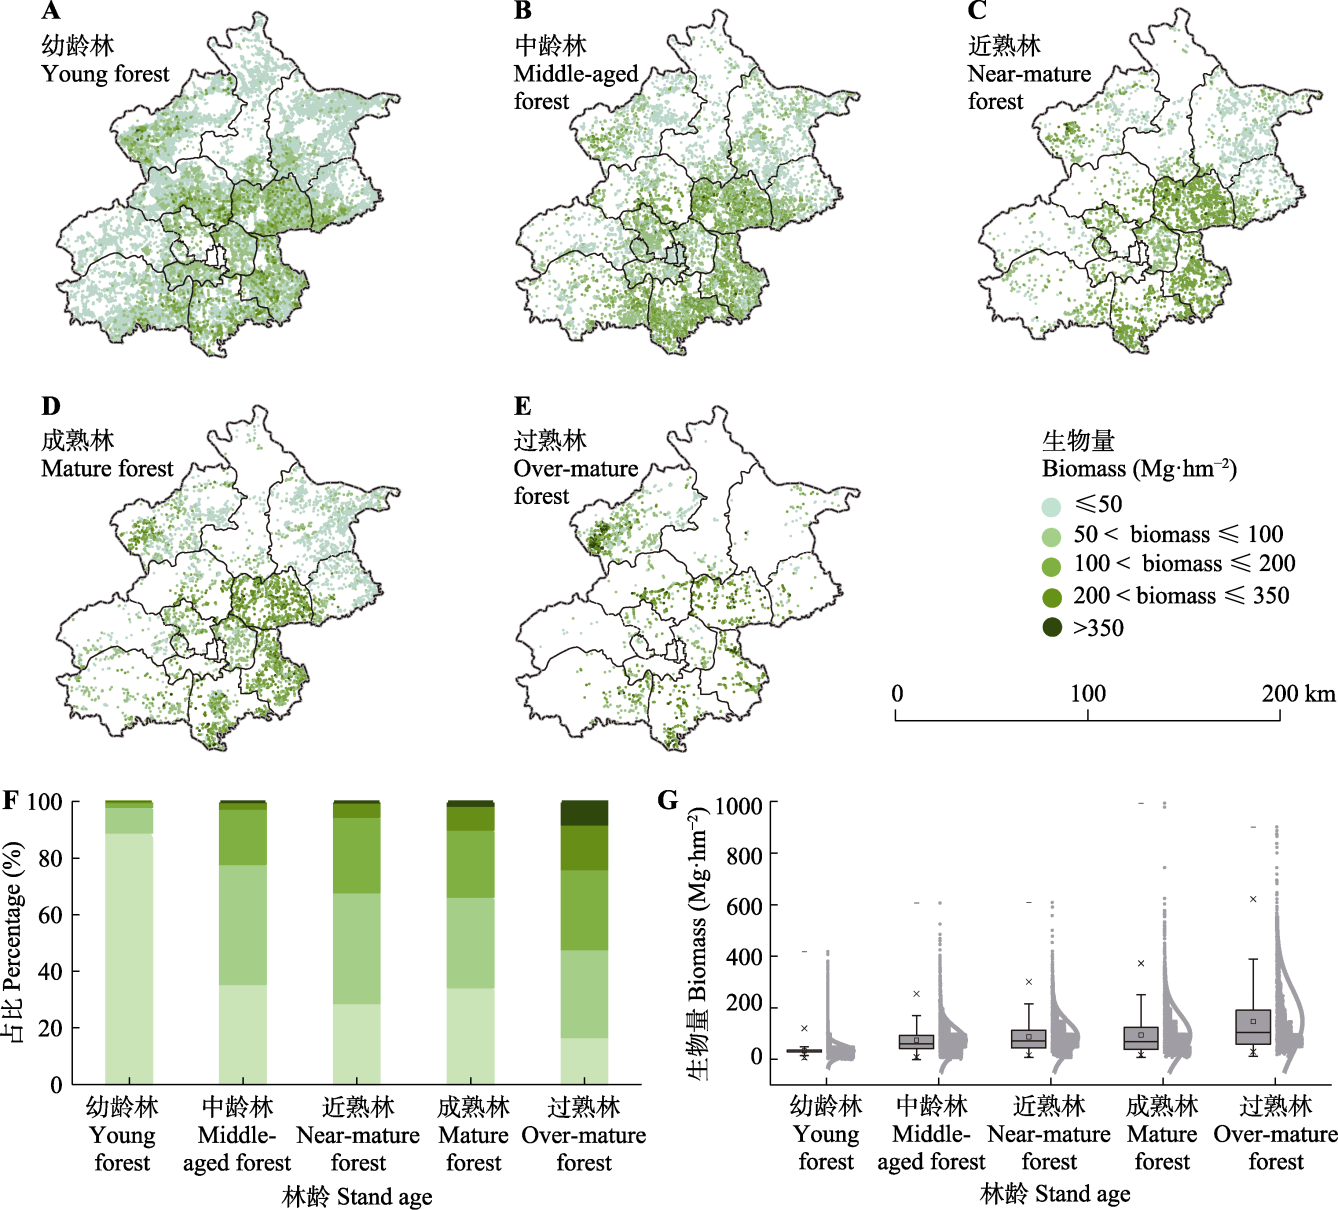
图3 北京不同林龄人工林生物量空间分布(A-E)、占比(F)和各林龄生物量均值(G)。
Fig. 3 Spatial distribution of biomass (A-E), percentage (F) and mean biomass (G) of plantation with different stand ages in Beijing.
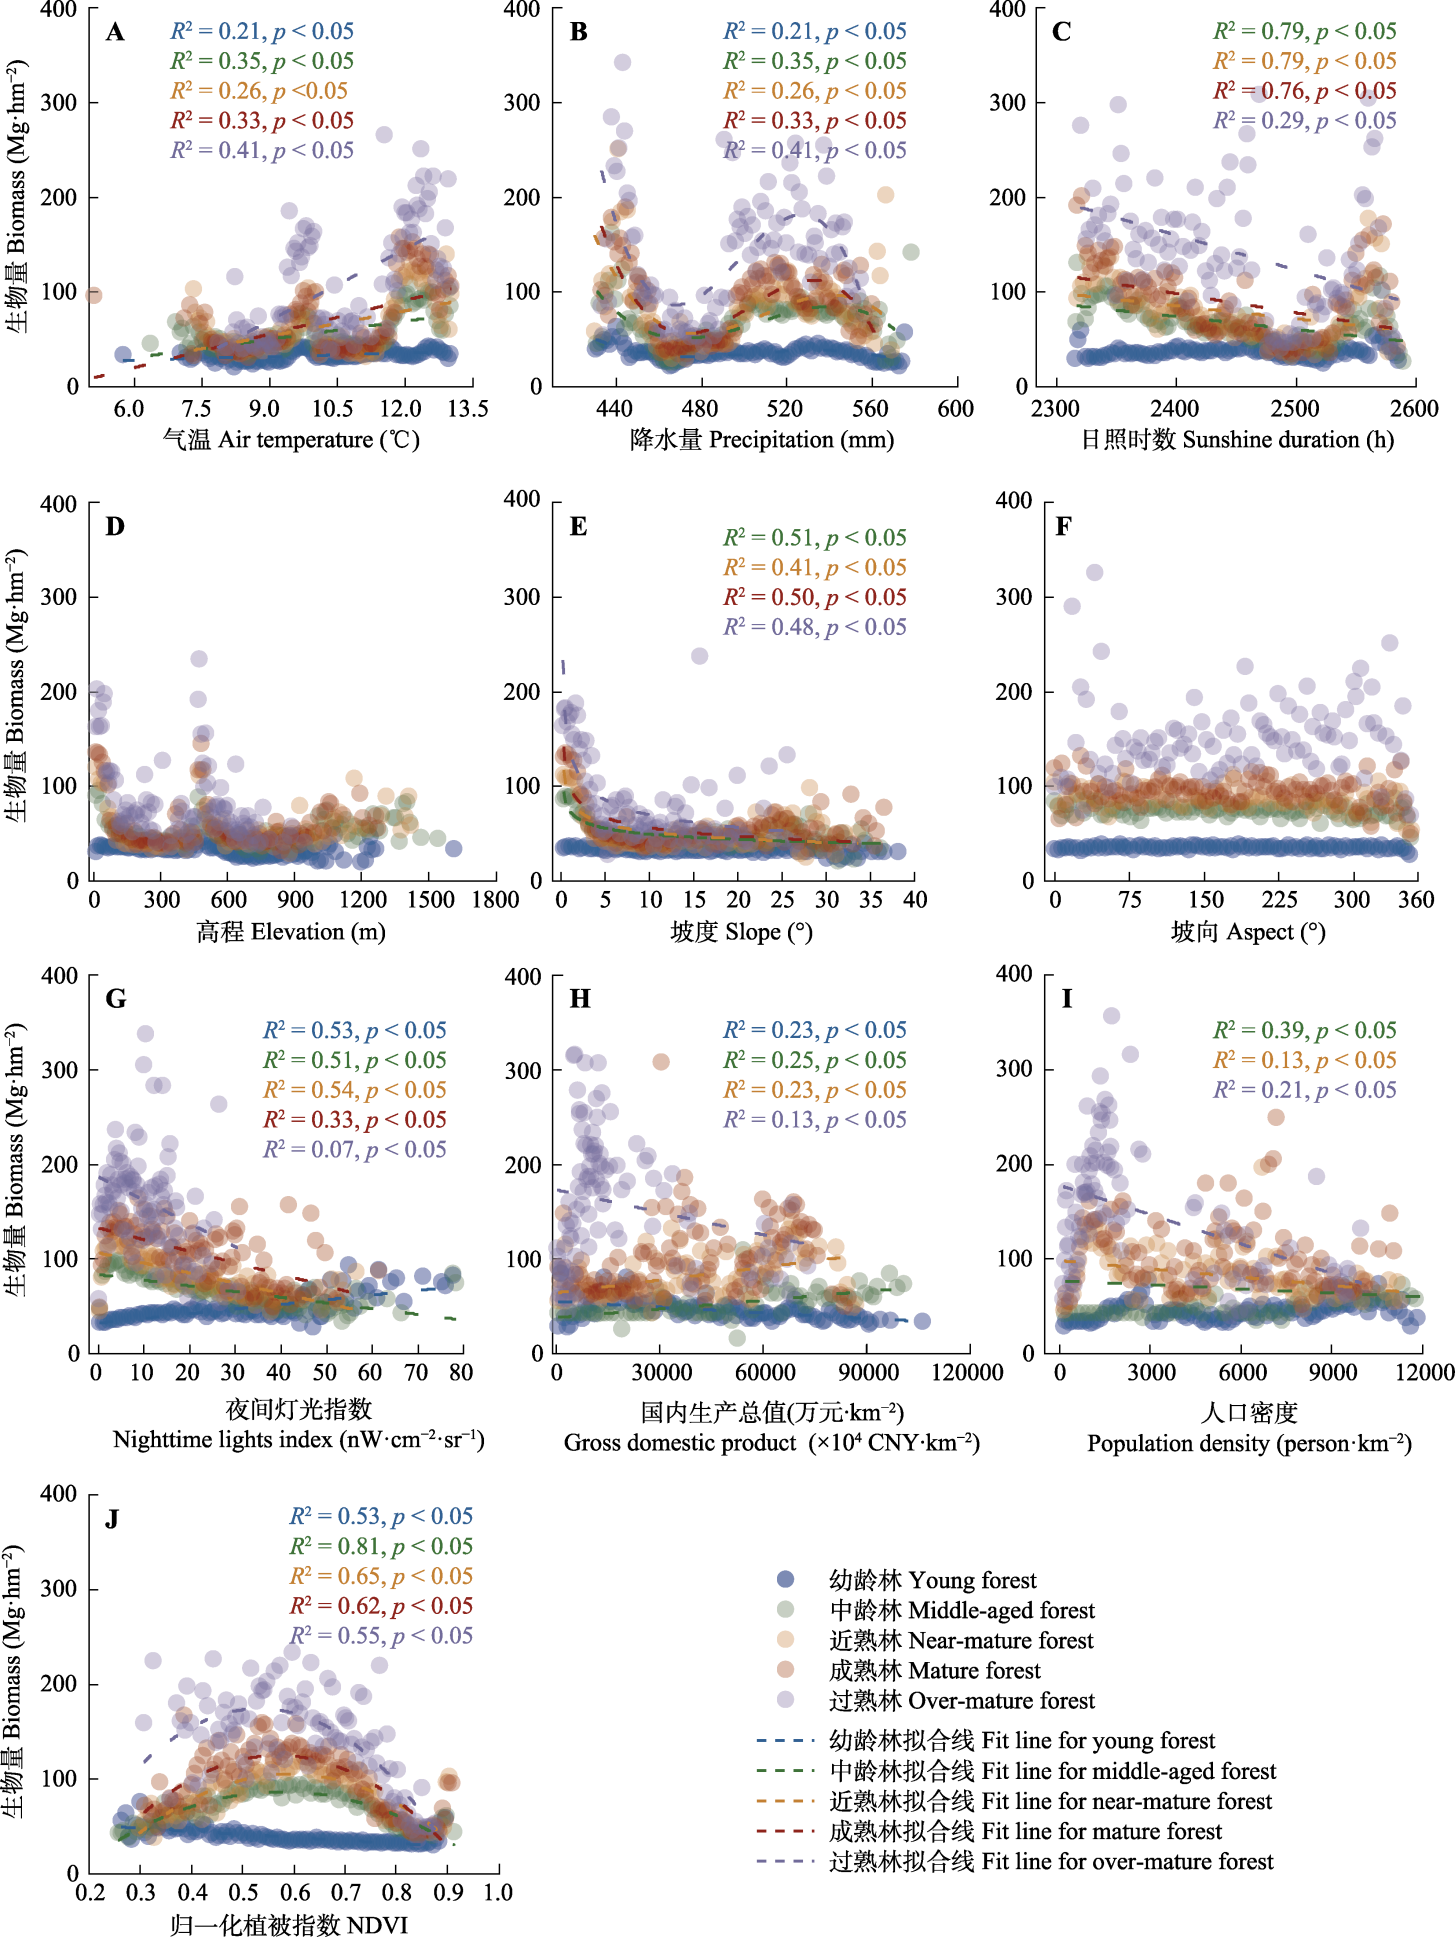
图4 北京市人工林生物量与气候因子(A-C)、地形因子(D-F)、人为因子(G-I)和植被因子(J)之间的关系。
Fig. 4 Relationships between plantation biomass and climatic (A-C), geographical (D-F), anthropogenic (G-I) and vegetation (J) factors in Beijing. NDVI, normalized difference vegetation index.
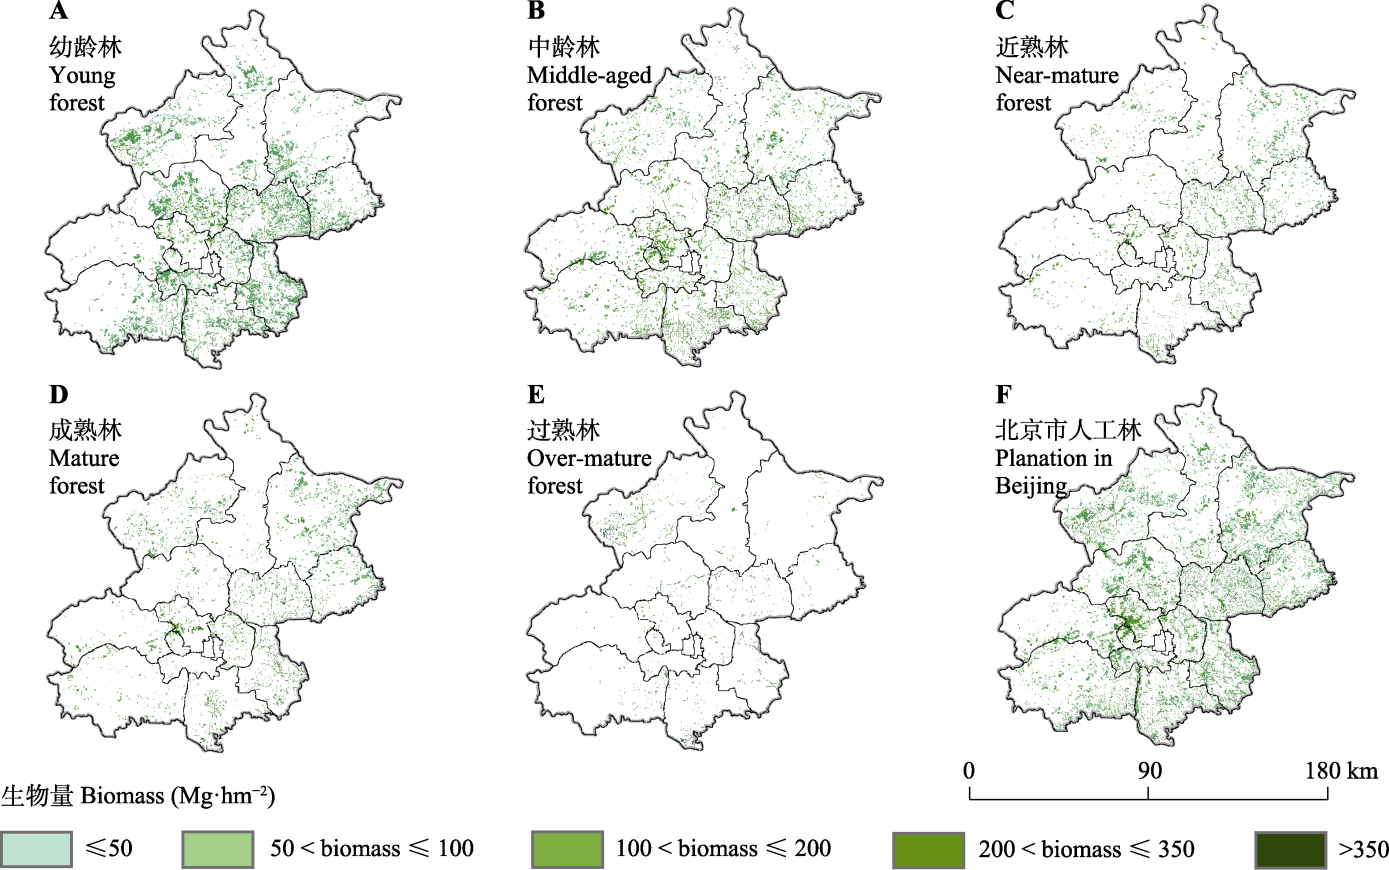
图5 随机森林生物量空间分布预测。
Fig. 5 Spatial distribution of plantation biomass by the prediction of the random forest.
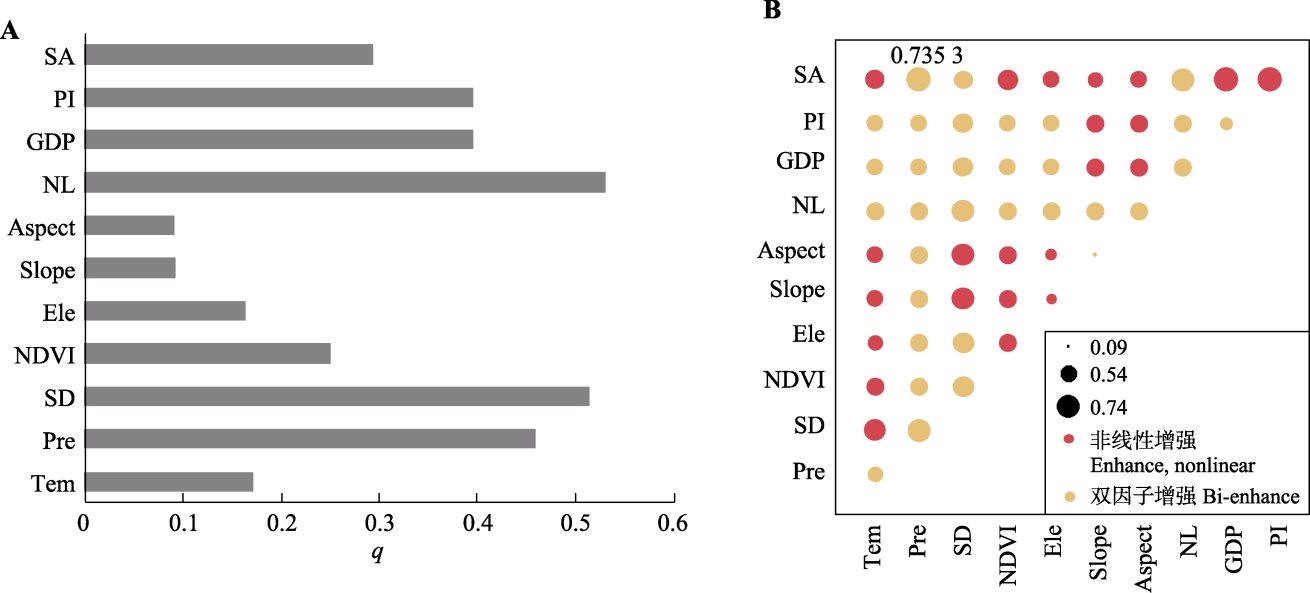
图6 生物量空间分异驱动因子探测(A)和交互探测(B)结果。Aspect, 坡向; Ele, 高程; GDP, 国内生产总值; NDVI, 归一化植被指数; NL, 夜间灯光指数; PI, 人口密度; Pre, 降水量; SA, 林龄; SD, 日照时数; Slope, 坡度; Tem, 气温。
Fig. 6 Results of analyzing the factors of driving spatial variation of biomass (A) and their interactions (B). Ele, elevation; GDP, gross domestic product; NDVI, normalized difference vegetation index; NL, nighttime lights index; PI, population density; Pre, precipitation; SA, stand age; SD, sunshine duration; Tem, air temperature.
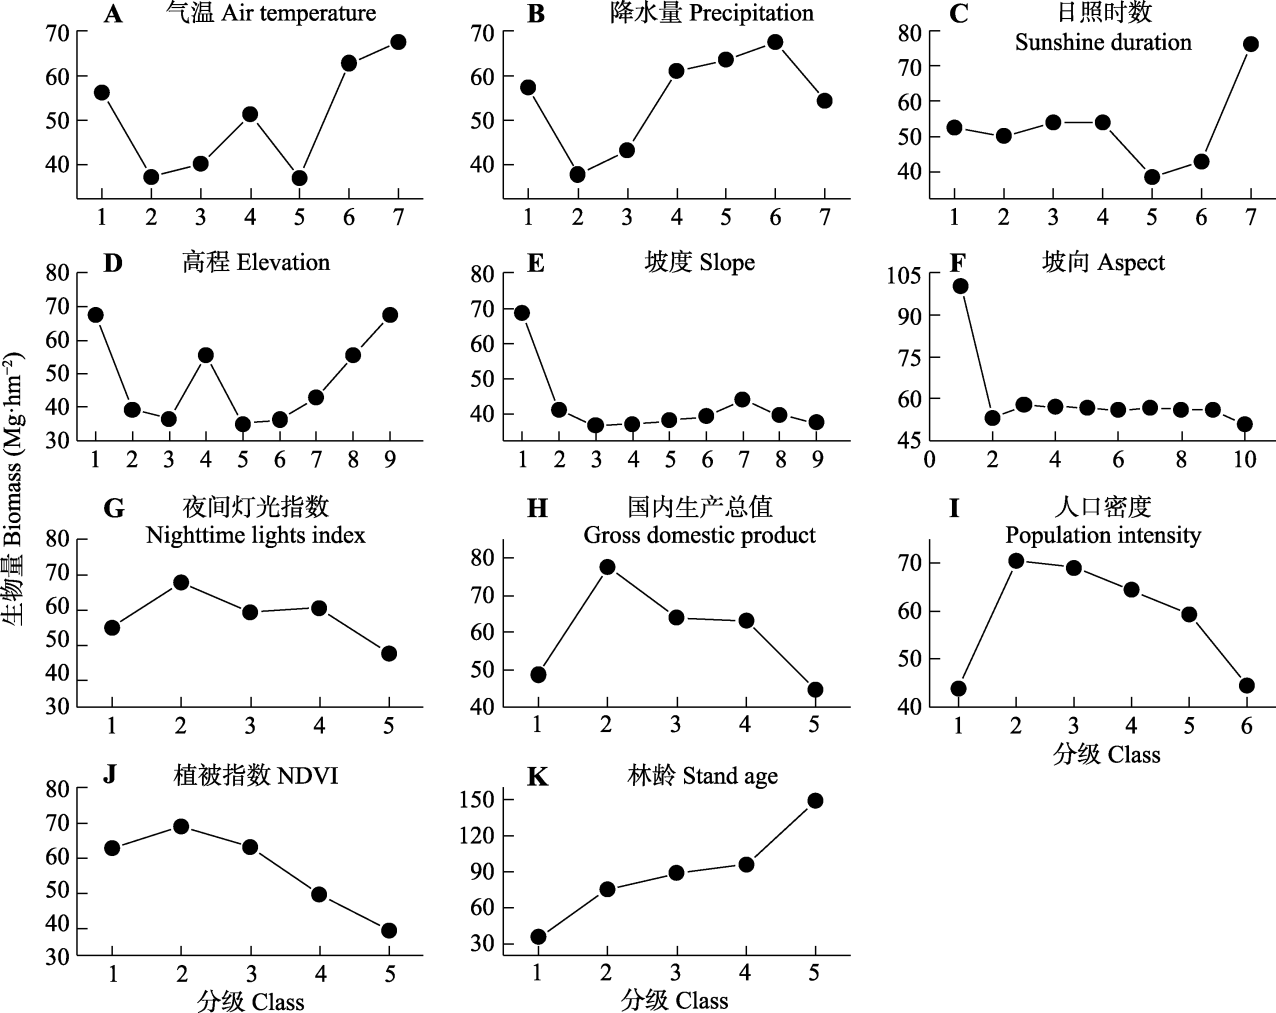
图7 生物量与各影响因子分级变化。具体分级见表4。
Fig. 7 Relationships between biomass and classification grades of different factors. NDVI, normalized difference vegetation index. The classes of factor category were shown in Table 4.
| [1] | Bao ZX, Zhang JY, Wang GQ, Guan TS, Jin JL, Liu YL, Li M, Ma T (2021). The sensitivity of vegetation cover to climate change in multiple climatic zones using machine learning algorithms. Ecological Indicators, 124, 107443. DOI: 10.1016/j.ecolind.2021.107443. |
| [2] | Baraloto C, Rabaud S, Molto Q, Blanc L, Fortunel C, Hérault B, Dávila N, Mesones I, Rios M, Valderrama E, Fine PVA (2011). Disentangling stand and environmental correlates of aboveground biomass in Amazonian forests. Global Change Biology, 17, 2677-2688. |
| [3] |
Berthrong ST, Jobbágy EG, Jackson RB (2009). A global meta-analysis of soil exchangeable cations, pH, carbon, and nitrogen with afforestation. Ecological Applications, 19, 2228-2241.
PMID |
| [4] | Besnard S, Carvalhais N, Arain MA, Black A, de Bruin S, Buchmann N, Cescatti A, Chen JQ, Clevers JGPW, Desai AR, Gough CM, Havrankova K, Herold M, Hörtnagl L, Jung M, et al.(2018). Quantifying the effect of forest age in annual net forest carbon balance. Environmental Research Letters, 13, 124018. DOI: 10.1088/1748-9326/aaeaeb. |
| [5] | Chen Z, Yu GR, Wang QF (2020). Effects of climate and forest age on the ecosystem carbon exchange of afforestation. Journal of Forestry Research, 31, 365-374. |
| [6] | Claus A, George E (2005). Effect of stand age on fine-root biomass and biomass distribution in three European forest chronosequences. Canadian Journal of Forest Research, 35, 1617-1625. |
| [7] |
Collalti A, Ibrom A, Stockmarr A, Cescatti A, Alkama R, Fernández-Martínez M, Matteucci G, Sitch S, Friedlingstein P, Ciais P, Goll DS, Nabel JEMS, Pongratz J, Arneth A, Haverd V, Prentice IC (2020). Forest production efficiency increases with growth temperature. Nature Communications, 11, 5322. DOI: 10.1038/s41467-020-19187-w.
PMID |
| [8] | Du Z, Yu L, Yang J, Xu Y, Chen B, Peng S, Zhang T, Fu H, Harris N, Gong P (2022). A global map of planting years of plantations. Scientific Data, 9, 141. DOI: 10.1038/s41597-022-01260-2. |
| [9] | Duan J, Ma LY, Jia LM, Xu CY, Jia ZK, Che WR (2010). The density effect of Platycladus orientalis plantation in Beijing area. Acta Ecologica Sinica, 30, 3206-3214. |
| [段劼, 马履一, 贾黎明, 徐程扬, 贾忠奎, 车文瑞 (2010). 北京地区侧柏人工林密度效应. 生态学报, 30, 3206-3214.] | |
| [10] | Elvidge CD, Zhizhin M, Ghosh T, Hsu FC, Taneja J (2021). Annual time series of global VIIRS nighttime lights derived from monthly averages: 2012 to 2019. Remote Sensing, 13, 922. DOI: 10.3390/rs13050922. |
| [11] |
Fang JY, Chen AP, Peng CG, Zhao SQ, Ci L (2001). Changes in forest biomass carbon storage in China between 1949 and 1998. Science, 292, 2320-2322.
DOI PMID |
| [12] | FAO (2020). Global Forest Resources Assessment 2020 (FRA 2020).[2023-04-16]. https://www.fao.org/forest-resources-assessment/2020/zh . |
| [13] | Feng Q, Ma H, Jiang XM, Wang X, Cao SX (2015). What has caused desertification in China? Scientific Reports, 5, 15998. DOI: 10.1038/srep15998. |
| [14] | Gao LH, Zhang XL (2021). Above-ground biomass estimation of plantation with complex forest stand structure using multiple features from airborne laser scanning point cloud data. Forests, 12, 1713. DOI: 10.3390/f12121713. |
| [15] | Hernández-Stefanoni JL, Dupuy JM, Tun-Dzul F, May-Pat F (2011). Influence of landscape structure and stand age on species density and biomass of a tropical dry forest across spatial scales. Landscape Ecology, 26, 355-370. |
| [16] | Hua WJ, Chen HS, Zhou LM, Xie ZH, Qin MH, Li X, Ma HD, Huang QH, Sun SL (2017). Observational quantification of climatic and human influences on vegetation greening in China. Remote Sensing, 9, 425. DOI: 10.3390/rs9050425. |
| [17] | Huang J, Tardif JC, Bergeron Y, Denneler B, Berninger F, Girardin MP (2010). Radial growth response of four dominant boreal tree species to climate along a latitudinal gradient in the eastern Canadian boreal forest. Global Change Biology, 16, 711-731. |
| [18] | Huo H, Sun CP (2021). Spatiotemporal variation and influencing factors of vegetation dynamics based on Geodetector: a case study of the northwestern Yunnan Plateau, China. Ecological Indicators, 130, 108005. DOI: 10.1016/j.ecolind.2021.108005. |
| [19] | Jiang MC, Tian SF, Zheng ZJ, Zhan Q, He YX (2017). Human activity influences on vegetation cover changes in Beijing, China, from 2000 to 2015. Remote Sensing, 9, 271. DOI: 10.3390/rs9030271. |
| [20] |
Jucker T, Bongalov B, Burslem DFRP, Nilus R, Dalponte M, Lewis SL, Phillips OL, Qie L, Coomes DA (2018). Topography shapes the structure, composition and function of tropical forest landscapes. Ecology Letters, 21, 989-1000.
DOI PMID |
| [21] | Lamsal S, Rizzo DM, Meentemeyer RK (2012). Spatial variation and prediction of forest biomass in a heterogeneous landscape. Journal of Forestry Research, 23, 13-22. |
| [22] | Lie Z, Xue L, Jacobs DF (2018). Allocation of forest biomass across broad precipitation gradients in China’s forests. Scientific Reports, 8, 10536. DOI: 10.1038/s41598-018-28899-5. |
| [23] | Liu YC, Gao XL, Fu C, Yu GR, Liu ZY (2019). Estimation of carbon sequestration potential of forest biomass in China based on National Forest Resources Inventory. Acta Ecologica Sinica, 39, 4002-4010. |
| [刘迎春, 高显连, 付超, 于贵瑞, 刘兆英 (2019). 基于森林资源清查数据估算中国森林生物量固碳潜力. 生态学报, 39, 4002-4010.] | |
| [24] | Liu YC, Yu GR, Wang QF, Zhang YJ (2014). How temperature, precipitation and stand age control the biomass carbon density of global mature forests. Global Ecology and Biogeography, 23, 323-333. |
| [25] | National Forestry and Grassland Administration (2019). China Forest Resources Report·2014·2018. China Forestry Publishing House, Beijing. |
| [国家林业和草原局(2019). 中国森林资源报告·2014·2018. 中国林业出版社, 北京.] | |
| [26] | Ni YY, Jian ZJ, Zeng LX, Liu JF, Lei L, Zhu JH, Xu J, Xiao WF (2022). Climate, soil nutrients, and stand characteristics jointly determine large-scale patterns of biomass growth rates and allocation in Pinus massoniana plantations. Forest Ecology and Management, 504, 119839. DOI: 10.1016/j.foreco.2021.119839. |
| [27] | Peichl M, Arain MA (2007). Allometry and partitioning of above- and belowground tree biomass in an age-sequence of white pine forests. Forest Ecology and Management, 253, 68-80. |
| [28] | Peng SZ, Ding YX, Liu WZ, Li Z (2019). 1 km monthly temperature and precipitation dataset for China from 1901 to 2017. Earth System Science Data, 11, 1931-1946. |
| [29] | Piao S, Yin G, Tan J, Cheng L, Huang M, Li Y, Liu R, Mao J, Myneni RB, Peng S, Poulter B, Shi X, Xiao Z, Zeng N, Zeng ZZ, Wang Y (2015). Detection and attribution of vegetation greening trend in China over the last 30 years. Global Change Biology, 21, 1601-1609. |
| [30] | Schwaab J, Davin EL, Bebi P, Duguay-Tetzlaff A, Waser LT, Haeni M, Meier R (2020). Increasing the broad-leaved tree fraction in European forests mitigates hot temperature extremes. Scientific Reports, 10, 14153. DOI: 10.1038/s41598-020-71055-1. |
| [31] | Shen AH (2017). A Study on the Spatial and Temporal Character and Remote Sensing Estimation of Public Welfare Forest Biomass in Zhejiang Province Based on Multi-source Data. PhD dissertation, Zhejiang University, Hangzhou. |
| [沈爱华 (2017). 基于多源数据的浙江省公益林生物量时空特征分析与遥感估算方法研究. 博士学位论文, 浙江大学, 杭州.] | |
| [32] | Song YZ, Wang JF, Ge Y, Xu CD (2020). An optimal parameters-based geographical detector model enhances geographic characteristics of explanatory variables for spatial heterogeneity analysis: cases with different types of spatial data. GIScience & Remote Sensing, 57, 593-610. |
| [33] | Vitasse Y, Baumgarten F, Zohner CM, Rutishauser T, Pietragalla B, Gehrig R, Dai J, Wang H, Aono Y, Sparks TH (2022). The great acceleration of plant phenological shifts. Nature Climate Change, 12, 300-302. |
| [34] | Wang JF, Hu Y (2012). Environmental health risk detection with GeogDetector. Environmental Modelling & Software, 33, 114-115. |
| [35] |
Wang JF, Xu CD (2017). Geodetector: principle and prospective. Acta Geographica Sinica, 72, 116-134.
DOI |
|
[王劲峰, 徐成东 (2017). 地理探测器: 原理与展望. 地理学报, 72, 116-134.]
DOI |
|
| [36] | Wang X, Hu HB, Zhang SH, Lu HL (2019). Underground biomass and carbon storage for Quercus acutissima forests of different ages. Acta Ecologica Sinica, 39, 8556-8564. |
| [王霞, 胡海波, 张世豪, 卢洪霖 (2019). 不同林龄麻栎林地下部分生物量与碳储量研究. 生态学报, 39, 8556-8564.] | |
| [37] | Xiang W, Li L, Ouyang S, Xiao W, Zeng L, Chen L, Lei P, Deng X, Zeng Y, Fang J, Forrester DI (2021). Effects of stand age on tree biomass partitioning and allometric equations in Chinese fir (Cunninghamia lanceolata) plantations. European Journal of Forest Research, 140, 317-332. |
| [38] | Xu MJ, Ji HB, Zhuang SY (2018). Carbon stock of Moso bamboo (Phyllostachys pubescens) forests along a latitude gradient in the subtropical region of China. PLoS ONE, 13, e0193024. DOI: 10.1371/journal.pone.0193024. |
| [39] | Xu Y, Dai QY, Zou B, Xu M, Feng YX (2023). Tracing climatic and human disturbance in diverse vegetation zones in China: over 20 years of NDVI observations. Ecological Indicators, 156, 111170. DOI: 10.1016/j.ecolind.2023.111170. |
| [40] | Xu YQ, Xiao FJ, Yu L (2020). Review of spatio-temporal distribution of net primary productity in forest ecosystem and its responses to climate change in China. Acta Ecologica Sinica, 40, 4710-4723. |
| [徐雨晴, 肖风劲, 於琍 (2020). 中国森林生态系统净初级生产力时空分布及其对气候变化的响应研究综述. 生态学报, 40, 4710-4723.] | |
| [41] | Yang C, Shi Y, Sun WJ, Zhu JL, Ji CJ, Feng YH, Ma SH, Guo ZD, Fang JY (2022). Updated estimation of forest biomass carbon pools in China, 1977-2018. Biogeosciences, 19, 2989-2999. |
| [42] | Yu D, Wang X, Yin Y, Zhan J, Lewis BJ, Tian J, Bao Y, Zhou W, Zhou L, Dai L (2014). Estimates of forest biomass carbon storage in Liaoning Province of Northeast China: a review and assessment. PLoS ONE, 9, e89572. DOI: 10.1371/journal.pone.0089572. |
| [43] | Zhang CH, Ju WM, Chen JM, Zan M, Li DQ, Zhou YL, Wang XQ (2013). China’s forest biomass carbon sink based on seven inventories from 1973 to 2008. Climatic Change, 118, 933-948. |
| [44] | Zhao D, Wang ZW, Wu XJ, Qiu T (2023). Response of vegetation dynamics in environmentally sensitive and fragile areas to natural and anthropogenic factors: a case study in Inner Mongolia Autonomous Region, China. Anthropocene, 44, 100414. DOI: 10.1016/j.ancene.2023.100414. |
| [45] | Zhao X, Liu JJ, Hao HK, Yang YZ (2020). Quantifying the spatial heterogeneity and driving factors of aboveground forest biomass in the urban area of Xi’an, China. ISPRS International Journal of Geo-Information, 9, 744. DOI: 10.3390/ijgi9120744. |
| [46] |
Zhu Z, Piao S, Myneni RB, Huang M, Zeng Z, Canadell JG, Ciais P, Sitch S, Friedlingstein P, Arneth A, Cao C, Cheng L, Kato E, Koven C, Li Y, et al.(2016). Greening of the Earth and its drivers. Nature Climate Change, 6, 791-795.
DOI |
| [47] | Zuo YF, Li YH, He KN, Wen YS (2022). Temporal and spatial variation characteristics of vegetation coverage and quantitative analysis of its potential driving forces in the Qilian Mountains, China, 2000-2020. Ecological Indicators, 143, 109429. DOI: 10.1016/j.ecolind.2022.109429. |
| [1] | 李晓花, 刘杰, 李丹丹, 张乐华. 濒危植物小溪洞杜鹃种群结构与动态特征[J]. 植物生态学报, 2025, 49(预发表): 1-. |
| [2] | 张静 陈洁 李艳朋 盘李军 许涵 李意德 何海生. 南亚热带针阔混交人工林植物生物量比较及其影响因子分析[J]. 植物生态学报, 2025, 49(化学计量与功能性状): 0-0. |
| [3] | 周志琼, 丁建林, 李晓明, 何其华. 2005–2010年西南山地人工林生物长期监测样地的植物物种组成与群落特征数据集[J]. 植物生态学报, 2025, 49(典型生态系统数据集): 1-. |
| [4] | 樊月玲, 蒋正德, 叶佳舒, 郑立臣, 陈欣. 2005-2015年下辽河平原农田长期观测样地主要农作物收获期性状和产量动态数据集[J]. 植物生态学报, 2025, 49(典型生态系统数据集): 1-. |
| [5] | 朱瑞德, 杨俊薇, 刘宵含, 陈冰瑞, 池秀莲, 田地, 杨光, 程蒙, 戴亚峰, 王诗文, 陈仲. 霍山石斛设施和林下栽培模式中养分对植物-微生物关联的调控[J]. , 2025, 49(地上地下生态过程关联): 0-. |
| [6] | 马腾飞, 郝杰, 刁华杰, 宁亚楠, $\boxed{\hbox{王常慧}}$, 董宽虎. 晋北农牧交错带草地土壤无机氮含量的季节变化及其对放牧强度的响应[J]. 植物生态学报, 2025, 49(6): 965-974. |
| [7] | 李博文, 周阳, 吕静雅, 阿旺, 陈兰英, 刘世章, 伍晶, 吕汪汪, 孙建平, 贾跃凤, 赵矿, 汪诗平. 山脚基带调查低估了青藏高原山地物种丰富度: 以珠峰绒布河流域山体垂直带为例[J]. 植物生态学报, 2025, 49(3): 404-414. |
| [8] | 陈文义, 王智勇, 周梦岩, 麻文俊, 王军辉, 罗志斌, 周婧. 幼龄楸树生物量分配规律与异速生长模型[J]. 植物生态学报, 2025, 49(2): 356-366. |
| [9] | 王堃莹, 邱贵福, 刘子赫, 孟君, 刘宇轩, 贾国栋. 气候变化对不同退化程度小叶杨林分生长和内在水分利用效率的调节[J]. 植物生态学报, 2025, 49(2): 343-355. |
| [10] | 郝毅晴, 刘伟, 杨阳, 安冰儿, 范冰, 李超, 崔久辉, 程延彬, 孙佳美, 潘庆民. 有机肥和无机肥对退化草原羊草种群密度和个体生物量的影响[J]. 植物生态学报, 2025, 49(1): 148-158. |
| [11] | 童郁强, 吴梦鸽, 王玲, 赵实, 韩叙, 张彤, 刘静, 秦胜金, 董英豪, 魏亚伟, 周永斌. 基于液流径向变化的樟子松蒸腾耗水量估算及影响因素[J]. 植物生态学报, 2024, 48(9): 1118-1127. |
| [12] | 陈炫铮, 朱耀军, 高居娟, 刘一凡, 王荣, 方涛, 罗芳丽, 薛伟, 于飞海. 植物-土壤反馈时空变异研究进展[J]. 植物生态学报, 2024, 48(8): 955-966. |
| [13] | 王袼, 胡姝娅, 李阳, 陈晓鹏, 李红玉, 董宽虎, 何念鹏, 王常慧. 不同类型草原土壤净氮矿化速率的温度敏感性[J]. 植物生态学报, 2024, 48(4): 523-533. |
| [14] | 梁逸娴, 王传宽, 臧妙涵, 上官虹玉, 刘逸潇, 全先奎. 落叶松径向生长和生物量分配对气候变暖的响应[J]. 植物生态学报, 2024, 48(4): 459-468. |
| [15] | 杨尚锦, 范云翔, 章毓文, 韩巧玲, 赵玥, 段劼, 邸楠, 席本野. 树木夜间液流组分划分方法对比——以毛白杨为例[J]. 植物生态学报, 2024, 48(4): 496-507. |
| 阅读次数 | ||||||
|
全文 |
|
|||||
|
摘要 |
|
|||||
Copyright © 2026 版权所有 《植物生态学报》编辑部
地址: 北京香山南辛村20号, 邮编: 100093
Tel.: 010-62836134, 62836138; Fax: 010-82599431; E-mail: apes@ibcas.ac.cn, cjpe@ibcas.ac.cn
备案号: 京ICP备16067583号-19
![]()