
植物生态学报 ›› 2025, Vol. 49 ›› Issue (6): 922-938.DOI: 10.17521/cjpe.2024.0160 cstr: 32100.14.cjpe.2024.0160
段俊丞, 王志勇*( ), 高维聪, 张成凯, 高长宏, 刘晓彤, 李振今
收稿日期:2024-05-16
接受日期:2024-09-28
出版日期:2025-06-20
发布日期:2024-09-29
通讯作者:
*王志勇(wzywlp@163.com)基金资助:
DUAN Jun-Cheng, WANG Zhi-Yong*(), GAO Wei-Cong, ZHANG Cheng-Kai, GAO Chang-Hong, LIU Xiao-Tong, LI Zhen-Jin
Received:2024-05-16
Accepted:2024-09-28
Online:2025-06-20
Published:2024-09-29
Contact:
*WANG Zhi-Yong(wzywlp@163.com)Supported by:摘要: 近年来, 随着入侵物种——互花米草(Spartina alterniflora)的爆发, 黄河三角洲自然保护区的湿地生态系统的结构和功能受到了严重破坏, 分析长时序互花米草入侵特征及其景观格局变化具有重要生态价值。该研究以长时序Landsat光学遥感影像为数据源, 以黄河三角洲湿地为实验区, 基于支持向量机分类算法获取了2000-2022年的黄河三角洲湿地植被类型信息, 在此基础上揭示湿地的时空动态变化, 联合8种景观格局指数, 探究互花米草的爆发特征, 分析互花米草的空间格局、演变特点和生态因子。结果表明: (1)研究获取的23个时期的地物提取结果的平均总体精度为88.60%, 平均Kappa系数为0.85。支持向量机算法具有高于其他传统机器学习方法的分类精度, 其结果可以较好地满足湿地演化机理分析需求; (2)长时序湿地演化结果表明, 互花米草的扩张呈现出明显的阶段性特征: 2002-2010年, 互花米草扩张速度缓慢; 自2010年开始, 互花米草在黄河入海口两侧的扩张进入爆发期, 到2012年面积增长至22.63 km2, 2012-2021年间互花米草面积持续稳定增长, 至2021年, 互花米草的面积扩张至最大, 达到50.42 km2。景观格局指数的变化表明, 研究区内互花米草表现出较高的生态优势。破碎的互花米草斑块不断聚集连接, 逐渐入侵湿地本土植被并与其他植被群落形成了交错分布的空间格局; (3)黄河三角洲互花米草的扩张, 与水热条件、日照时间、地形与滩涂环境等多种自然因素表现出较高的相关性, 其中, 日照情况、离海距离与互花米草的生长极显著相关。研究结果可为相关部门在黄河三角洲自然保护区湿地合理利用以及互花米草治理和清除方面提供数据参考。
段俊丞, 王志勇, 高维聪, 张成凯, 高长宏, 刘晓彤, 李振今. 黄河三角洲湿地入侵物种互花米草时空演化与景观格局分析. 植物生态学报, 2025, 49(6): 922-938. DOI: 10.17521/cjpe.2024.0160
DUAN Jun-Cheng, WANG Zhi-Yong, GAO Wei-Cong, ZHANG Cheng-Kai, GAO Chang-Hong, LIU Xiao-Tong, LI Zhen-Jin. Spatiotemporal evolution and landscape pattern analysis of the invasive species Spartina alterniflora in the Yellow River Delta wetland. Chinese Journal of Plant Ecology, 2025, 49(6): 922-938. DOI: 10.17521/cjpe.2024.0160
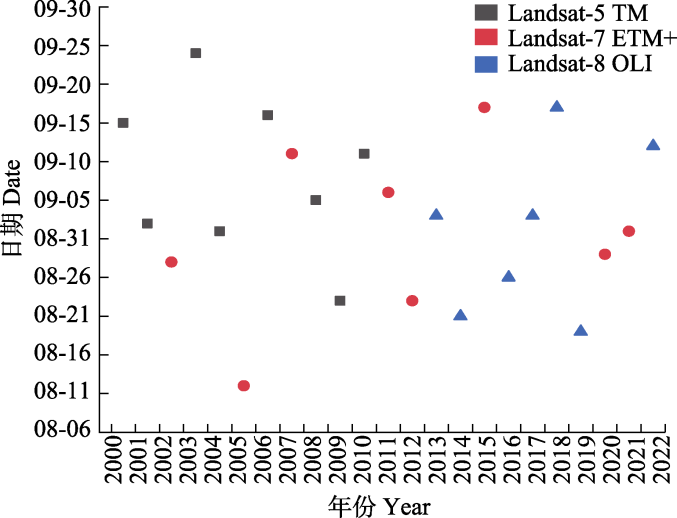
图1 黄河三角洲湿地互花米草研究应用的Landsat影像时间分布图。
Fig. 1 Temporal distribution of Landsat images for researchof Spartina alterniflora in the Yellow River Delta wetland.
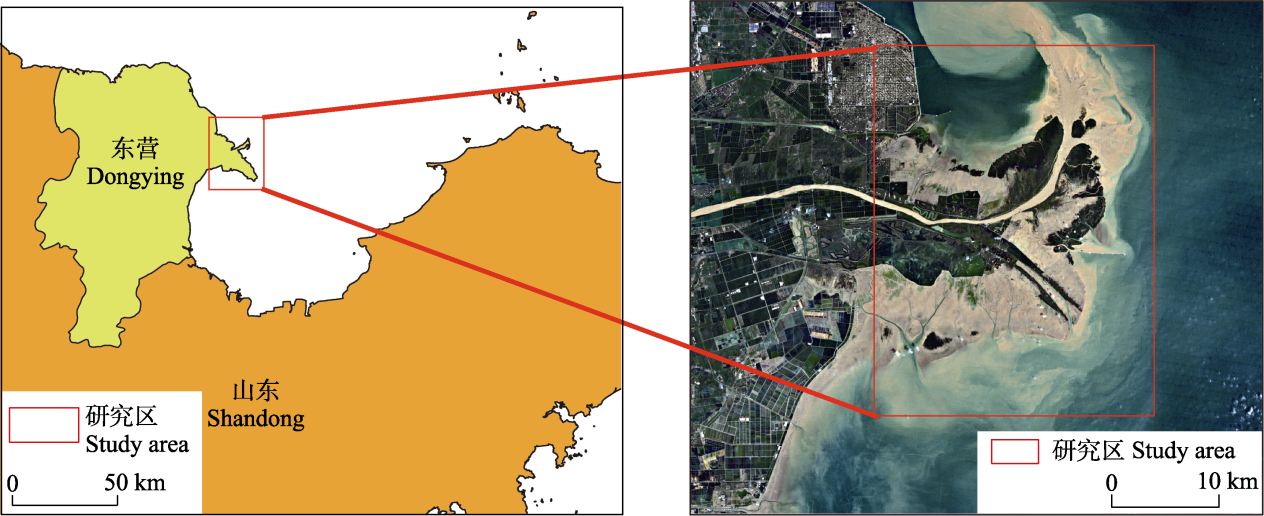
图2 黄河三角洲湿地互花米草研究区位置图。右图为2020年的Landsat7-ETM+卫星影像。
Fig. 2 Location of the study area of Spartina alterniflora in the Yellow River Delta wetland. Right figure based on Landsat7-ETM+ remote sensing images in 2020.
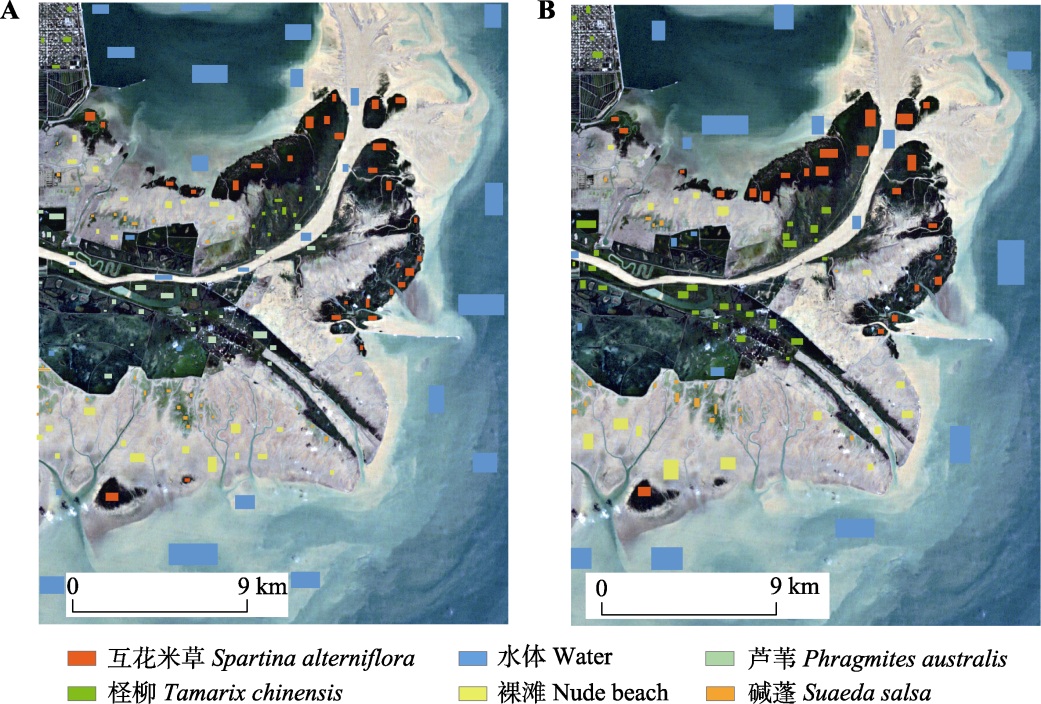
图3 应用于分类的训练样本分布图(A)与应用于精度验证的验证样本分布图(B) (底图是2021年黄河三角洲湿地的Landsat遥感影像图)。
Fig. 3 Distribution of training samples applied to classification (A) and the distribution of test samples applied to accuracy verification (B) (Based on Landsat remote sensing images in the Yellow River Delta wetland in 2021).
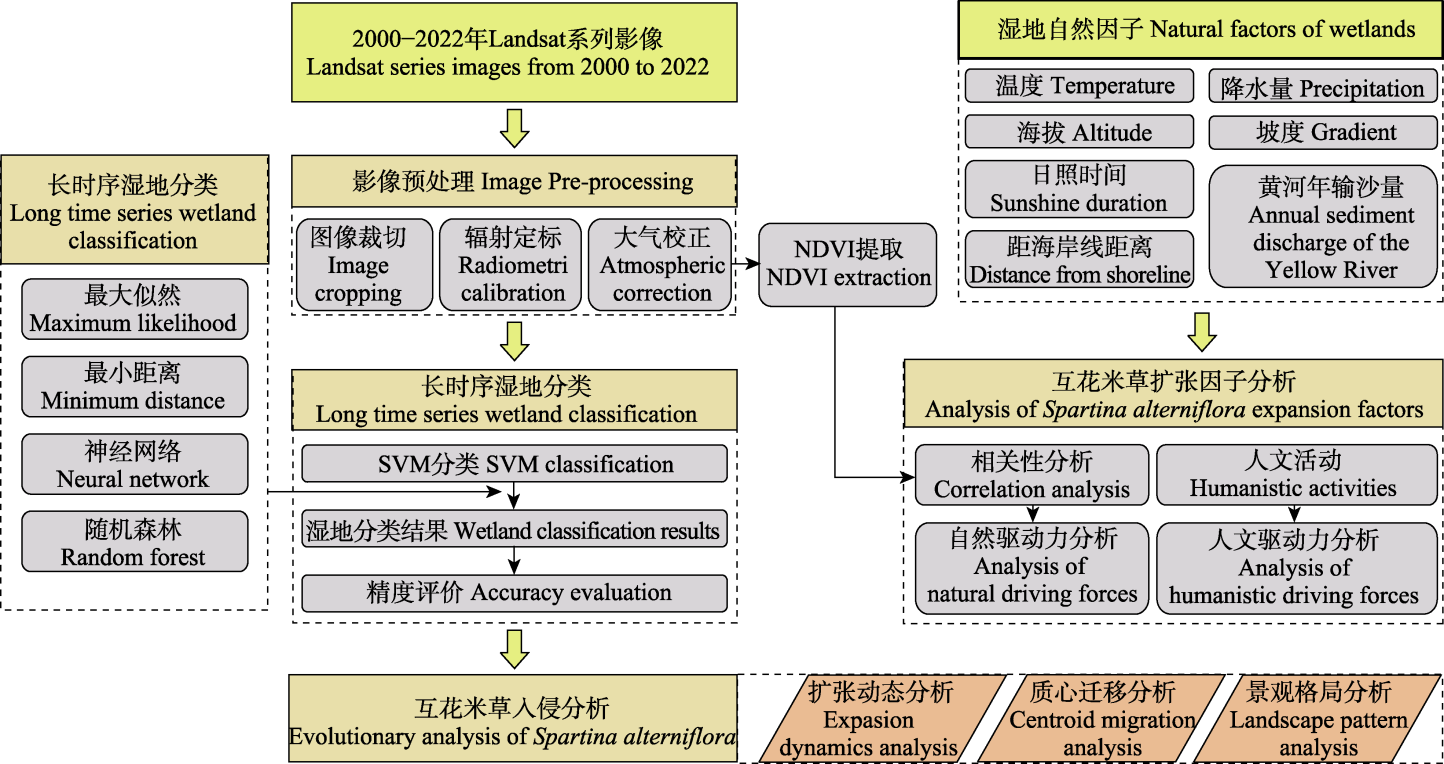
图4 总体技术流程图。NDVI, 归一化植被指数; SVM, 支持向量机。
Fig. 4 Technical process. NDVI, normalized difference vegetation index; SVM, support vector machine.
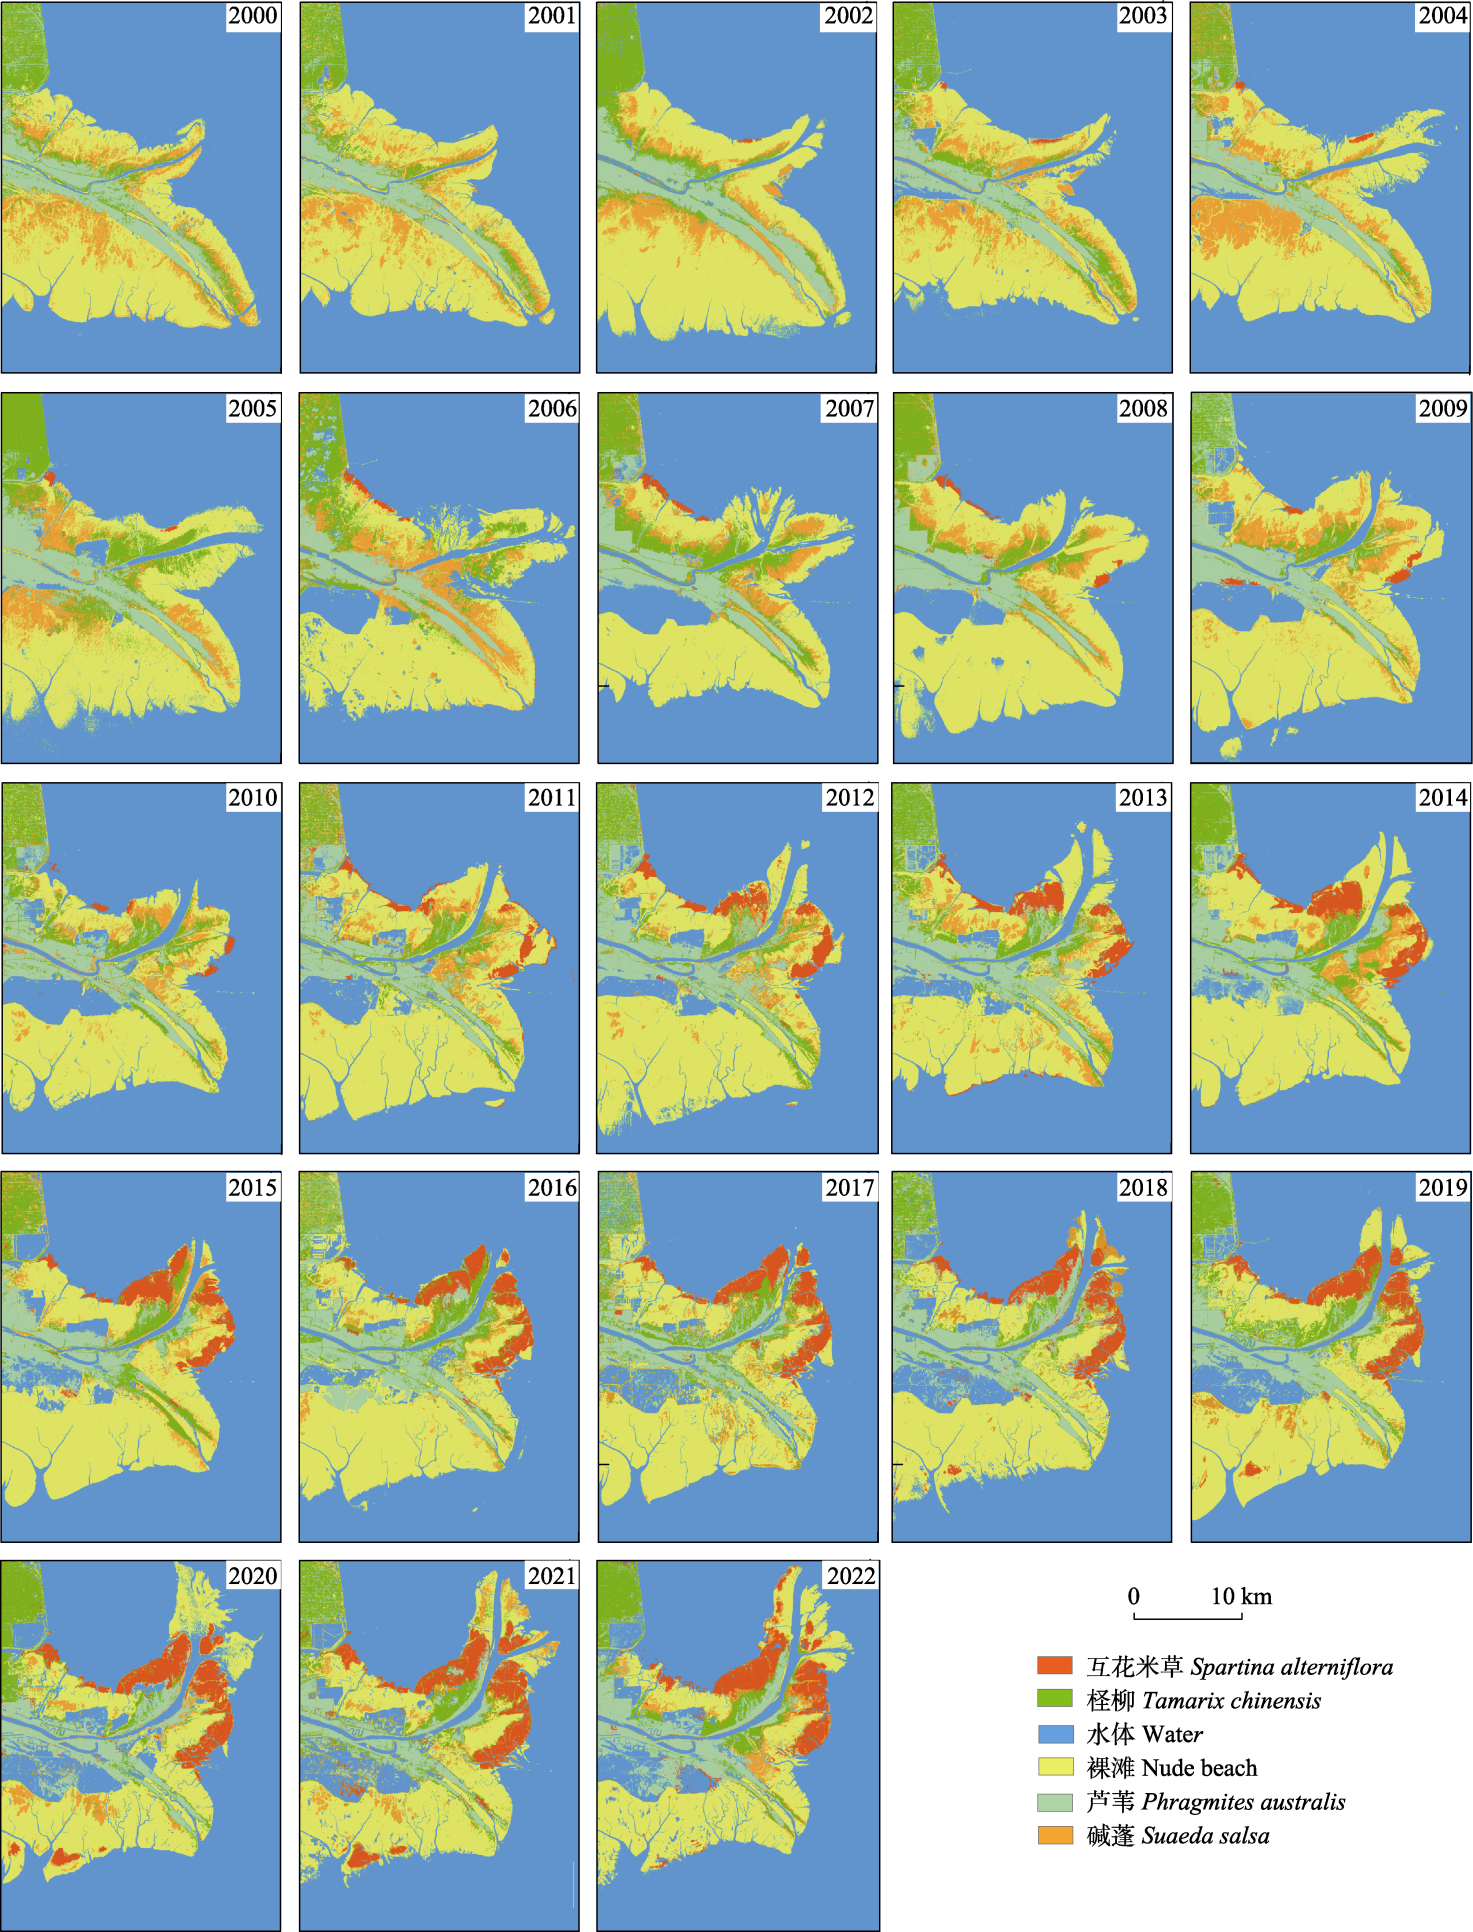
图5 黄河三角洲自然保护区湿地地物分类结果图。
Fig. 5 Yellow River Delta Nature Reserve wetland classification results.
| 年份 Year | 生产者精度 Producer accuracy (%) | 用户精度 User accuracy (%) | 总体精度 Overall accuracy (%) | Kappa系数 Kappa coefficient |
|---|---|---|---|---|
| 2000 | - | - | 92.84 | 0.92 |
| 2001 | - | - | 93.20 | 0.91 |
| 2002 | 80.79 | 98.33 | 95.23 | 0.94 |
| 2003 | 94.26 | 94.74 | 91.12 | 0.90 |
| 2004 | 91.16 | 93.56 | 93.38 | 0.92 |
| 2005 | 95.57 | 92.41 | 92.96 | 0.89 |
| 2006 | 83.74 | 93.58 | 93.09 | 0.92 |
| 2007 | 91.02 | 91.03 | 92.29 | 0.90 |
| 2008 | 93.11 | 87.38 | 93.78 | 0.92 |
| 2009 | 95.48 | 92.41 | 89.16 | 0.86 |
| 2010 | 87.96 | 89.18 | 89.31 | 0.86 |
| 2011 | 87.64 | 85.89 | 80.35 | 0.78 |
| 2012 | 92.44 | 86.17 | 86.22 | 0.82 |
| 2013 | 92.88 | 89.08 | 88.36 | 0.85 |
| 2014 | 84.48 | 86.91 | 93.18 | 0.91 |
| 2015 | 79.13 | 87.16 | 85.88 | 0.79 |
| 2016 | 81.17 | 91.61 | 81.89 | 0.77 |
| 2017 | 81.46 | 89.43 | 84.05 | 0.80 |
| 2018 | 81.85 | 84.43 | 84.67 | 0.80 |
| 2019 | 92.06 | 88.36 | 88.84 | 0.86 |
| 2020 | 83.38 | 85.80 | 85.87 | 0.82 |
| 2021 | 85.74 | 80.25 | 81.25 | 0.77 |
| 2022 | 91.57 | 82.99 | 89.76 | 0.87 |
| 平均 Mean | 87.95 | 89.08 | 88.60 | 0.85 |
表1 黄河三角洲自然保护区湿地地物分类精度验证结果
Table 1 Accuracy verification results of Yellow River Delta Nature Reserve wetland classification
| 年份 Year | 生产者精度 Producer accuracy (%) | 用户精度 User accuracy (%) | 总体精度 Overall accuracy (%) | Kappa系数 Kappa coefficient |
|---|---|---|---|---|
| 2000 | - | - | 92.84 | 0.92 |
| 2001 | - | - | 93.20 | 0.91 |
| 2002 | 80.79 | 98.33 | 95.23 | 0.94 |
| 2003 | 94.26 | 94.74 | 91.12 | 0.90 |
| 2004 | 91.16 | 93.56 | 93.38 | 0.92 |
| 2005 | 95.57 | 92.41 | 92.96 | 0.89 |
| 2006 | 83.74 | 93.58 | 93.09 | 0.92 |
| 2007 | 91.02 | 91.03 | 92.29 | 0.90 |
| 2008 | 93.11 | 87.38 | 93.78 | 0.92 |
| 2009 | 95.48 | 92.41 | 89.16 | 0.86 |
| 2010 | 87.96 | 89.18 | 89.31 | 0.86 |
| 2011 | 87.64 | 85.89 | 80.35 | 0.78 |
| 2012 | 92.44 | 86.17 | 86.22 | 0.82 |
| 2013 | 92.88 | 89.08 | 88.36 | 0.85 |
| 2014 | 84.48 | 86.91 | 93.18 | 0.91 |
| 2015 | 79.13 | 87.16 | 85.88 | 0.79 |
| 2016 | 81.17 | 91.61 | 81.89 | 0.77 |
| 2017 | 81.46 | 89.43 | 84.05 | 0.80 |
| 2018 | 81.85 | 84.43 | 84.67 | 0.80 |
| 2019 | 92.06 | 88.36 | 88.84 | 0.86 |
| 2020 | 83.38 | 85.80 | 85.87 | 0.82 |
| 2021 | 85.74 | 80.25 | 81.25 | 0.77 |
| 2022 | 91.57 | 82.99 | 89.76 | 0.87 |
| 平均 Mean | 87.95 | 89.08 | 88.60 | 0.85 |
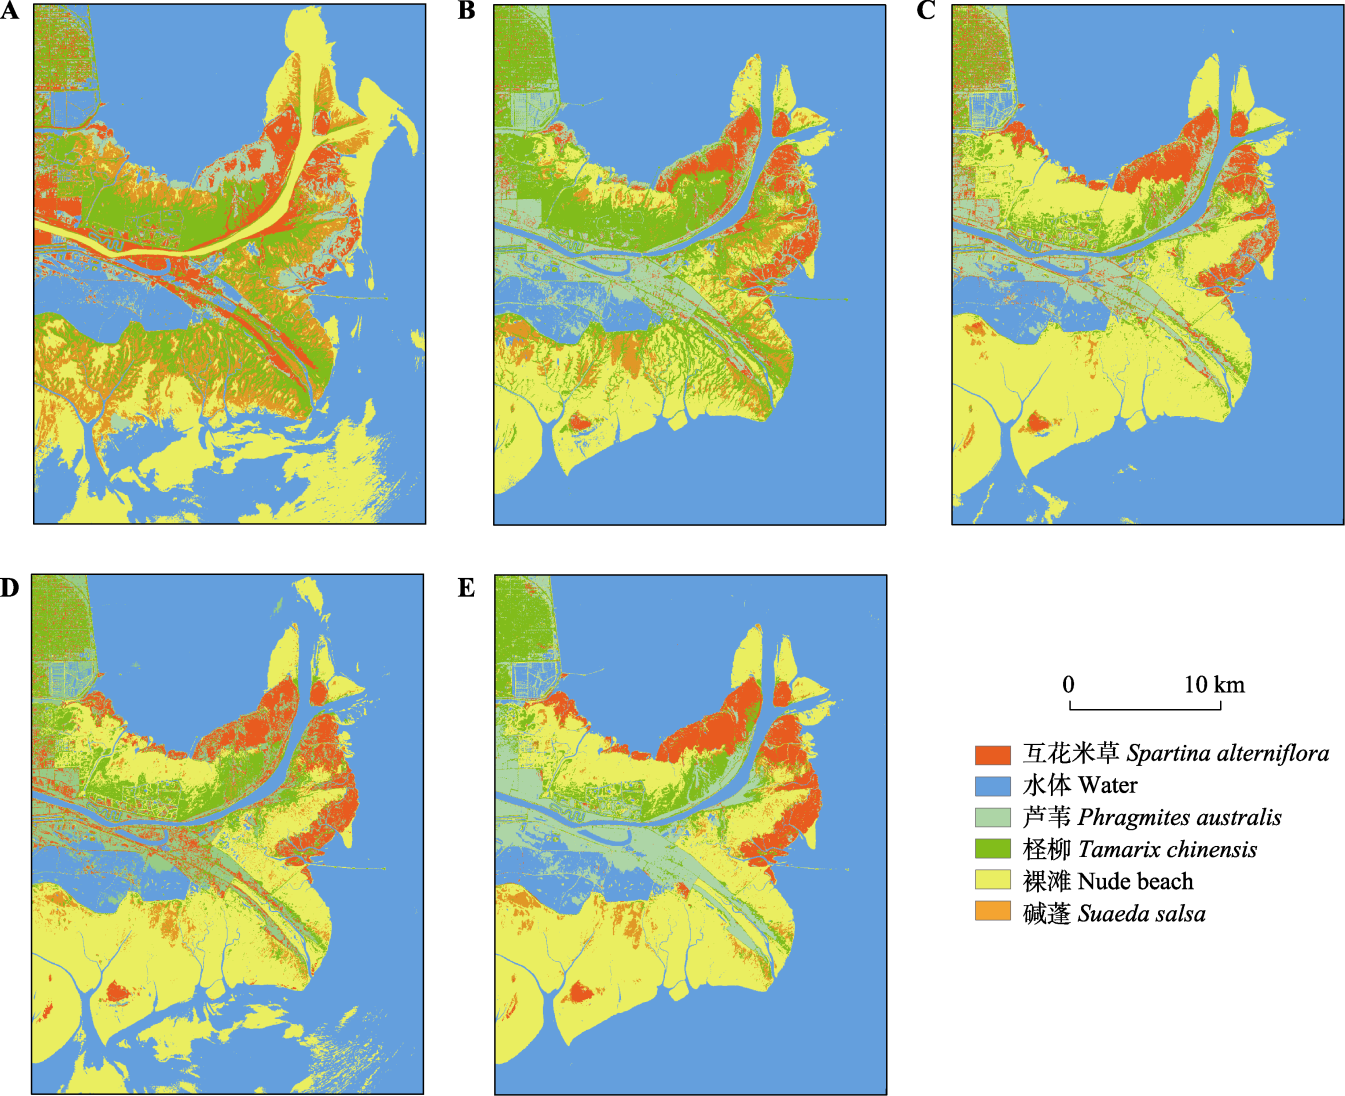
图6 黄河三角洲湿地不同分类方法的地物分类结果对比。A, 最小距离方法。B, 最大似然方法。C, 神经网络方法。D, 随机森林方法。E, 支持向量机算法。
Fig. 6 Classification results from different classification methods in the Yellow River Delta wetland. A, Minimum Distance method. B, Maximum Likelihood method. C, Neural Network method. D, Random Forest method. E, Support Vector Machine method.
| 分类方法 Classification method | 生产者精度 Producer accuracy (%) | 用户精度 User accuracy (%) | 总体精度 Overall accuracy (%) | Kappa系数 Kappa coefficient |
|---|---|---|---|---|
| 最大似然法 Maximum Likelihood | 81.63 | 78.07 | 81.96 | 0.77 |
| 最小距离法 Minimum Distance | 59.16 | 62.10 | 72.19 | 0.69 |
| 神经网络 Neural Network | 71.14 | 95.31 | 85.89 | 0.82 |
| 随机森林 Random Forest | 75.54 | 82.88 | 84.25 | 0.81 |
| 支持向量机 Support Vector Machine | 92.06 | 88.36 | 88.84 | 0.86 |
表2 黄河三角洲湿地不同分类方法的分类精度对比
Table 2 Comparison of classification accuracy in the Yellow River Delta wetland using different classification methods
| 分类方法 Classification method | 生产者精度 Producer accuracy (%) | 用户精度 User accuracy (%) | 总体精度 Overall accuracy (%) | Kappa系数 Kappa coefficient |
|---|---|---|---|---|
| 最大似然法 Maximum Likelihood | 81.63 | 78.07 | 81.96 | 0.77 |
| 最小距离法 Minimum Distance | 59.16 | 62.10 | 72.19 | 0.69 |
| 神经网络 Neural Network | 71.14 | 95.31 | 85.89 | 0.82 |
| 随机森林 Random Forest | 75.54 | 82.88 | 84.25 | 0.81 |
| 支持向量机 Support Vector Machine | 92.06 | 88.36 | 88.84 | 0.86 |
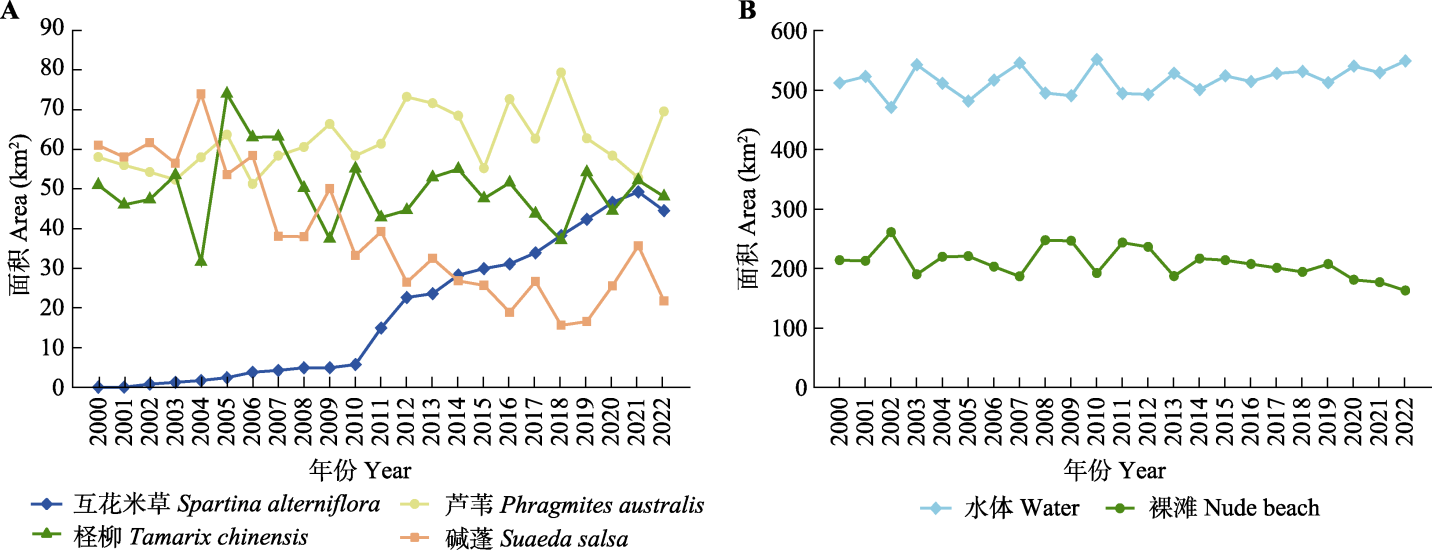
图7 2000-2022年黄河三角洲自然保护区湿地地物面积变化。
Fig. 7 Change of wetland surface area in the Yellow River Delta Nature Reserve from 2000 to 2022.
| 2012 | ||||||||
|---|---|---|---|---|---|---|---|---|
| 互花米草 Spartina alterniflora | 水体 Water | 芦苇 Phragmites australis | 柽柳 Tamarix chinensis | 裸滩 Nude beach | 碱蓬 Suaeda salsa | 总和 Summation | ||
| 2002 | 互花米草 Spartina alterniflora | 0.04 | 0.15 | 0.38 | 0.11 | 0.01 | 0.05 | 0.74 |
| 水体 Water | 16.40 | 410.22 | 3.80 | 4.19 | 31.83 | 4.56 | 470.98 | |
| 芦苇 Phragmites australis | 0.37 | 3.46 | 39.84 | 7.09 | 2.59 | 0.88 | 54.22 | |
| 柽柳 Tamarix chinensis | 0.61 | 5.78 | 14.59 | 19.32 | 5.40 | 1.69 | 47.39 | |
| 裸滩 Nude beach | 4.60 | 50.73 | 6.52 | 8.79 | 176.82 | 13.59 | 261.05 | |
| 碱蓬 Suaeda salsa | 0.62 | 22.43 | 8.06 | 5.10 | 19.77 | 5.67 | 61.65 | |
| 总和 Summation | 22.63 | 492.76 | 73.19 | 44.60 | 236.42 | 26.44 | 896.04 | |
表3 2002-2012年黄河三角洲地物类型面积转移矩阵(单位: km2)
Table 3 Transfer matrix of surface feature types in the Yellow River Delta from 2002 to 2012 (unit: km2)
| 2012 | ||||||||
|---|---|---|---|---|---|---|---|---|
| 互花米草 Spartina alterniflora | 水体 Water | 芦苇 Phragmites australis | 柽柳 Tamarix chinensis | 裸滩 Nude beach | 碱蓬 Suaeda salsa | 总和 Summation | ||
| 2002 | 互花米草 Spartina alterniflora | 0.04 | 0.15 | 0.38 | 0.11 | 0.01 | 0.05 | 0.74 |
| 水体 Water | 16.40 | 410.22 | 3.80 | 4.19 | 31.83 | 4.56 | 470.98 | |
| 芦苇 Phragmites australis | 0.37 | 3.46 | 39.84 | 7.09 | 2.59 | 0.88 | 54.22 | |
| 柽柳 Tamarix chinensis | 0.61 | 5.78 | 14.59 | 19.32 | 5.40 | 1.69 | 47.39 | |
| 裸滩 Nude beach | 4.60 | 50.73 | 6.52 | 8.79 | 176.82 | 13.59 | 261.05 | |
| 碱蓬 Suaeda salsa | 0.62 | 22.43 | 8.06 | 5.10 | 19.77 | 5.67 | 61.65 | |
| 总和 Summation | 22.63 | 492.76 | 73.19 | 44.60 | 236.42 | 26.44 | 896.04 | |
| 2022 | ||||||||
|---|---|---|---|---|---|---|---|---|
| 互花米草 Spartina alterniflora | 水体 Water | 芦苇 Phragmites australis | 柽柳 Tamarix chinensis | 裸滩 Nude beach | 碱蓬 Suaeda salsa | 总和 Summation | ||
| 2012 | 互花米草 Spartina alterniflora | 13.45 | 5.59 | 1.08 | 0.76 | 0.84 | 0.91 | 22.63 |
| 水体 Water | 10.73 | 440.09 | 8.95 | 1.56 | 28.44 | 3.00 | 492.76 | |
| 芦苇 Phragmites australis | 1.15 | 13.31 | 42.89 | 10.94 | 1.79 | 3.11 | 73.19 | |
| 柽柳 Tamarix chinensis | 1.28 | 4.10 | 5.83 | 24.25 | 4.66 | 4.47 | 44.60 | |
| 裸滩 Nude beach | 14.59 | 83.46 | 8.28 | 6.73 | 118.20 | 5.16 | 236.42 | |
| 碱蓬 Suaeda salsa | 3.32 | 2.46 | 2.49 | 3.84 | 9.20 | 5.12 | 26.44 | |
| 总和 Summation | 44.52 | 549.01 | 69.52 | 48.09 | 163.13 | 21.77 | 896.04 | |
表4 2012-2022年黄河三角洲地物类型面积转移矩阵(单位: km2)
Table 4 Transfer matrix of surface feature types in the Yellow River Delta from 2012 to 2022 (unit: km2)
| 2022 | ||||||||
|---|---|---|---|---|---|---|---|---|
| 互花米草 Spartina alterniflora | 水体 Water | 芦苇 Phragmites australis | 柽柳 Tamarix chinensis | 裸滩 Nude beach | 碱蓬 Suaeda salsa | 总和 Summation | ||
| 2012 | 互花米草 Spartina alterniflora | 13.45 | 5.59 | 1.08 | 0.76 | 0.84 | 0.91 | 22.63 |
| 水体 Water | 10.73 | 440.09 | 8.95 | 1.56 | 28.44 | 3.00 | 492.76 | |
| 芦苇 Phragmites australis | 1.15 | 13.31 | 42.89 | 10.94 | 1.79 | 3.11 | 73.19 | |
| 柽柳 Tamarix chinensis | 1.28 | 4.10 | 5.83 | 24.25 | 4.66 | 4.47 | 44.60 | |
| 裸滩 Nude beach | 14.59 | 83.46 | 8.28 | 6.73 | 118.20 | 5.16 | 236.42 | |
| 碱蓬 Suaeda salsa | 3.32 | 2.46 | 2.49 | 3.84 | 9.20 | 5.12 | 26.44 | |
| 总和 Summation | 44.52 | 549.01 | 69.52 | 48.09 | 163.13 | 21.77 | 896.04 | |
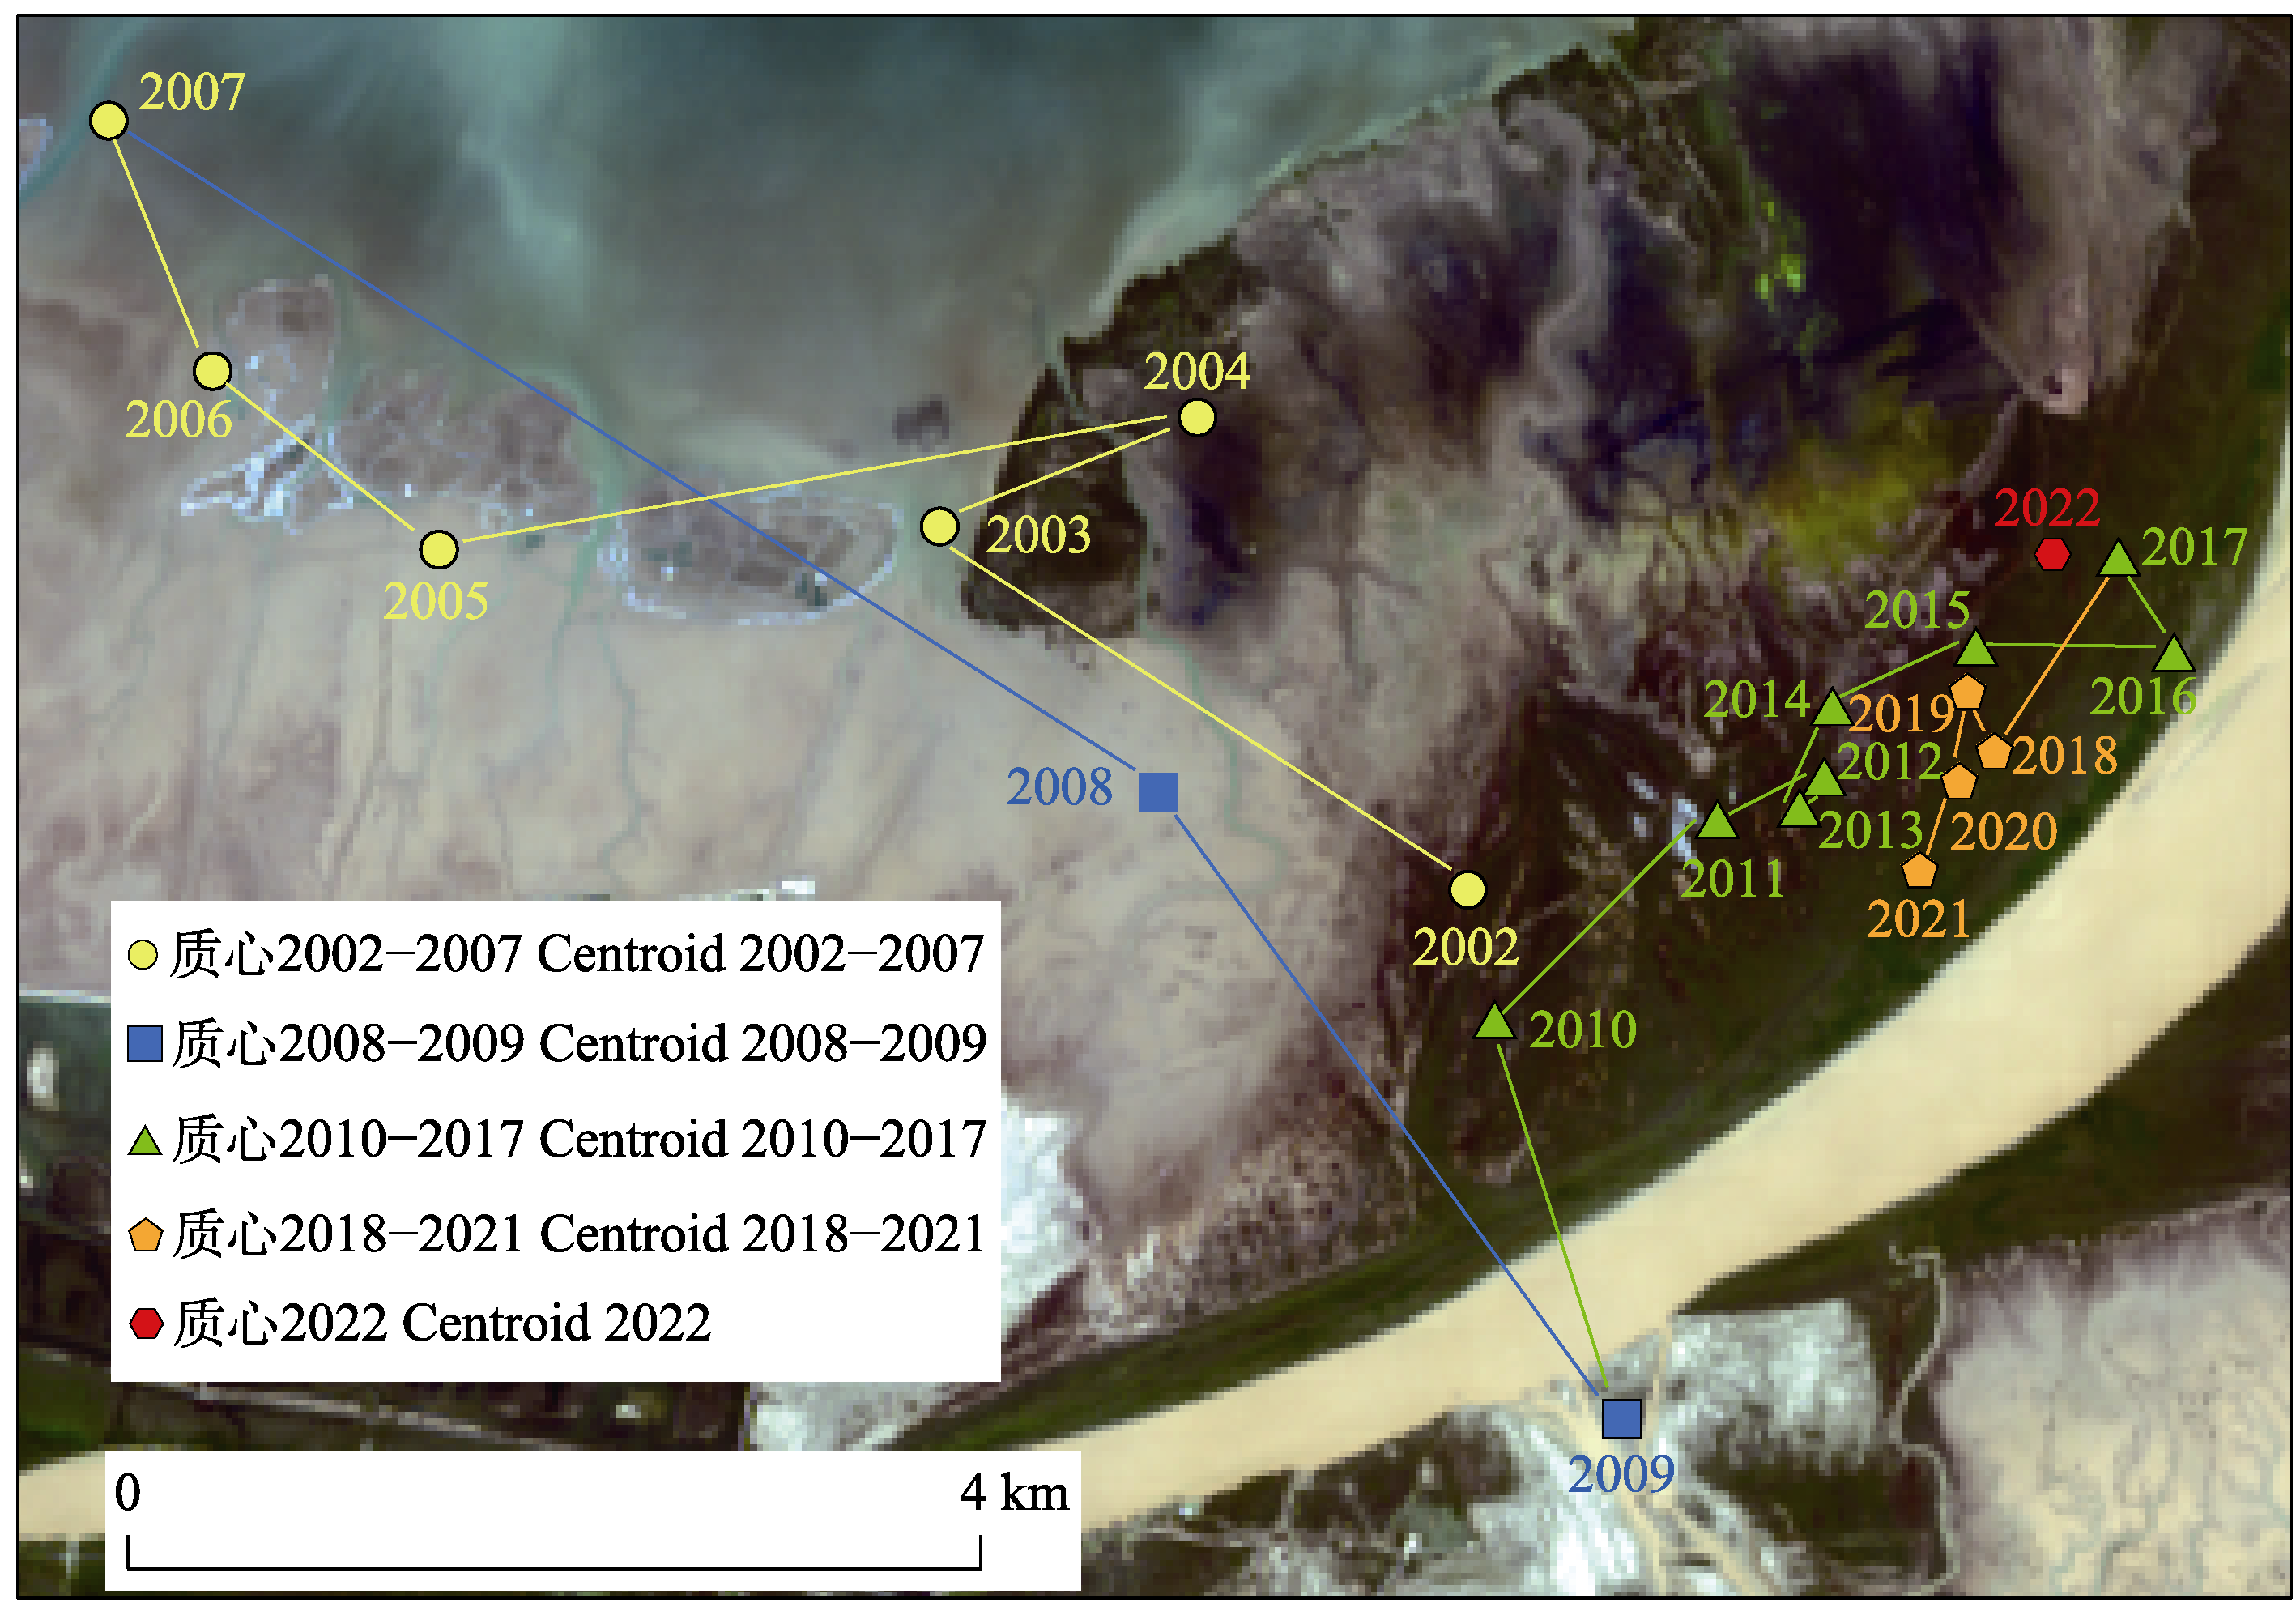
图8 黄河三角洲湿地互花米草质心移动路线图。
Fig. 8 Spartina alterniflora centroid moving route in the Yellow River Delta wetland.
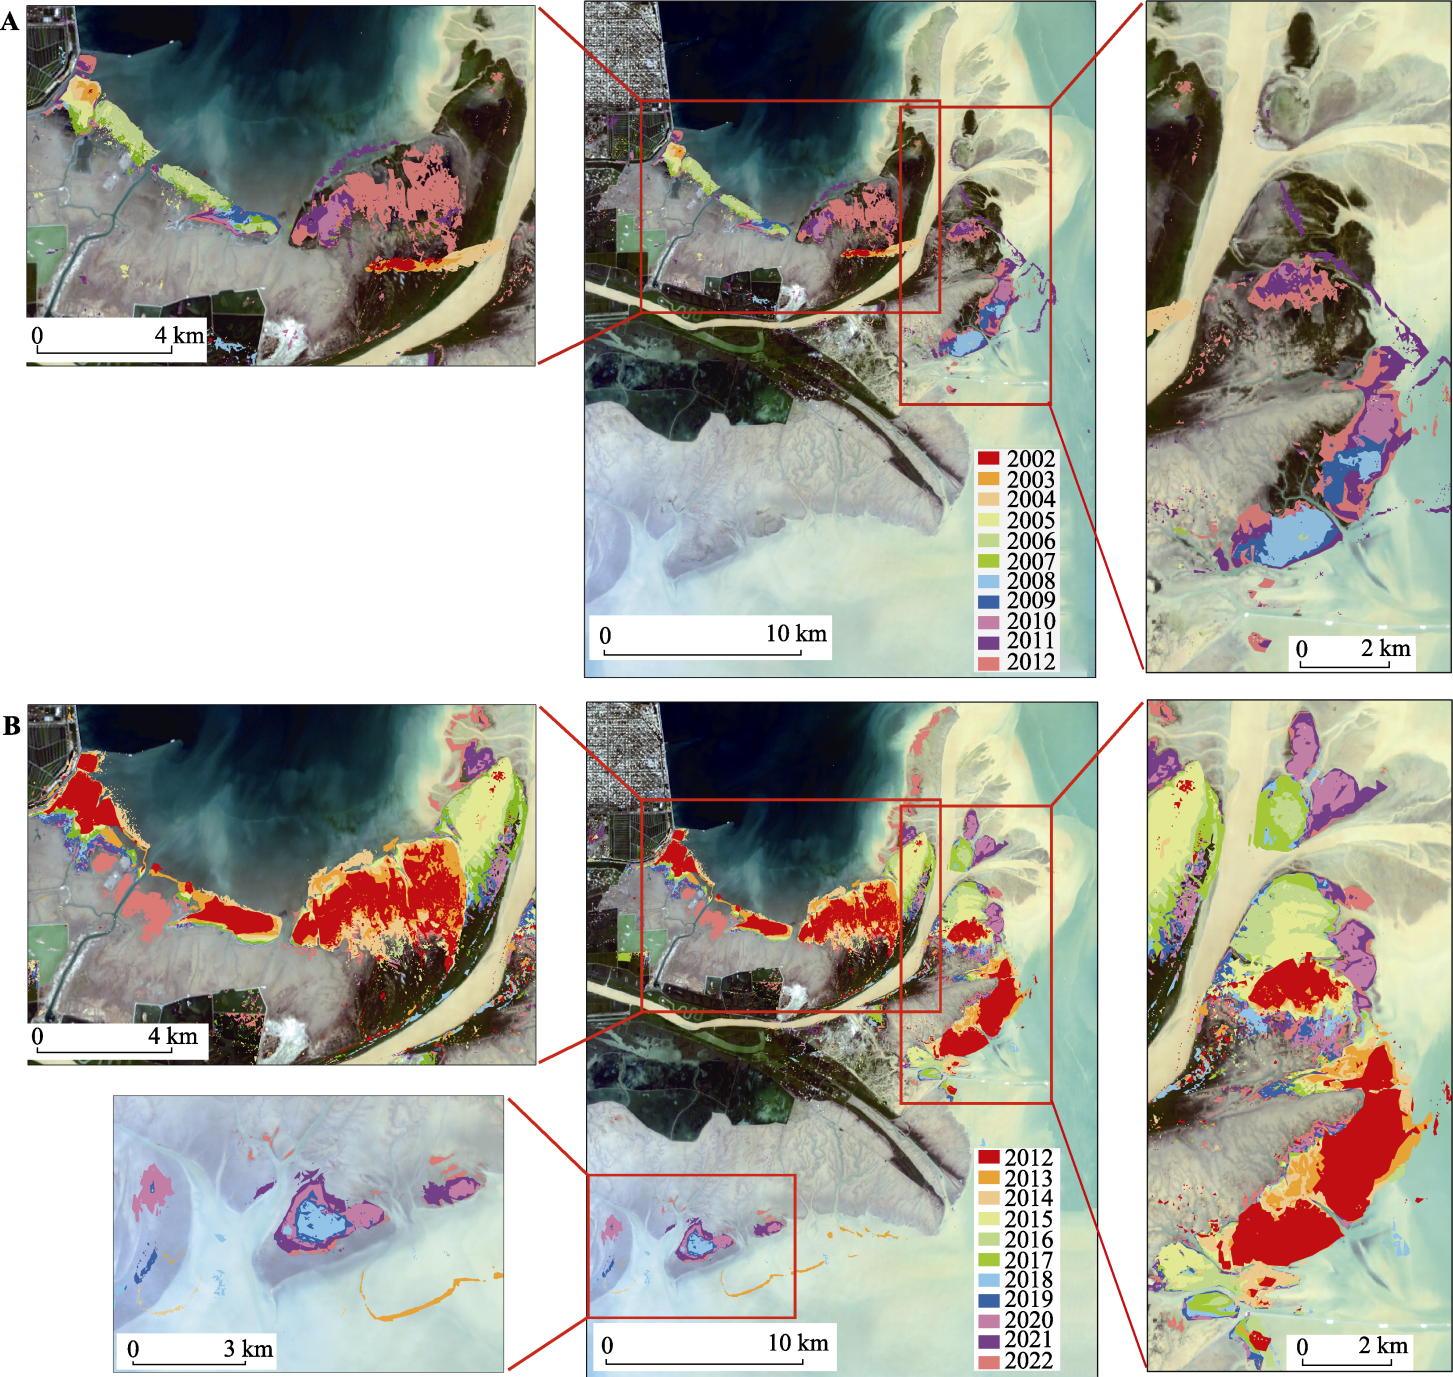
图9 2002-2022年黄河三角洲湿地互花米草扩张情况图。A, 2002-2012年的扩张情况。B, 2012-2022年的扩张情况。
Fig. 9 Spartina alterniflora expansion in the Yellow River Delta wetland, 2002-2022. A, Expansion from 2002 to 2012. B, Expansion from 2012 to 2022.
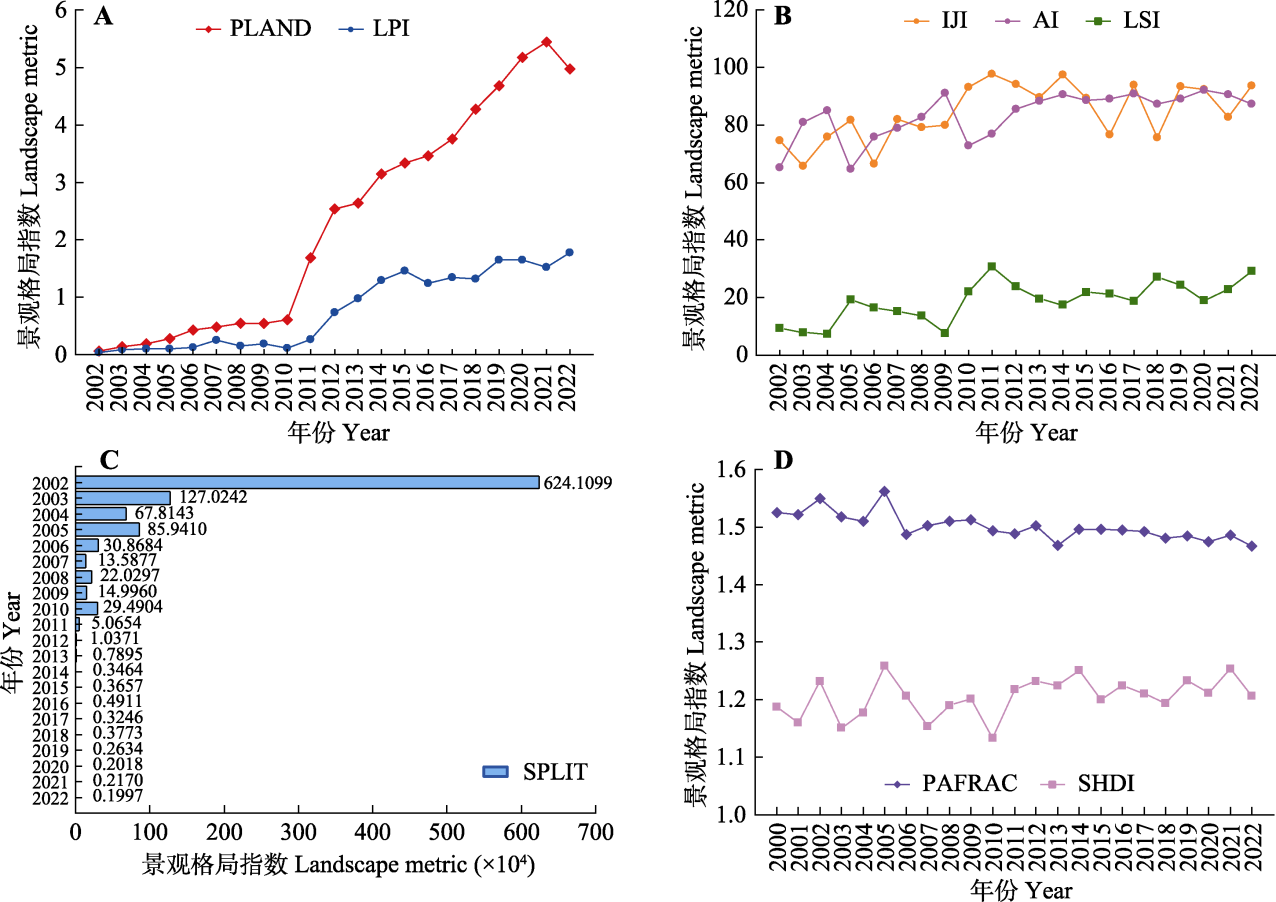
图10 2002-2022年黄河三角洲湿地互花米草景观格局指数图。A, 斑块所占景观面积比例(PLAND)与最大斑块指数(LPI)年际变化图。B, 斑块形状指数(LSI)、散布与并列指数(IJI)、聚合指数(AI)年际变化图。C, 破碎度指数(SPLIT)年际变化图。D, 分维度指数(PAFRAC)与景观多样性指数(SHDI)指数年际变化图。
Fig. 10 Landscape pattern index map of Spartina alterniflora in the Yellow River Delta wetland from 2002 to 2022. A, Annual variation of percentage of landscape (PLAND) and largest patch index (LPI). B, Interannual variation of landscape shape index (LSI), interspersion and juxtaposition index (IJI) and aggregation index (AI). C, Interannual variation of splitting index (SPLIT). D, Annual variation of perimeter-area fractal dimension (PAFRAC) and shannon’s diversity index (SHDI).
| 因素 Factor | 温度 Temperature (℃) | 降水量 Precipitation (mm) | 日照时间 Sunshine duration (h) | 距海岸线距离 Distance from shoreline (m) | 海拔 Altitude (m) | 坡度 Gradient (°) | 黄河年输沙量 Annual sediment discharge (108 t) |
|---|---|---|---|---|---|---|---|
| 相关系数 Correlation coefficient | 0.346* | 0.667* | 0.760** | 0.986** | -0.964* | -0.720* | 0.433* |
表5 各类自然因子与互花米草NDVI的相关性计算
Table 5 Relevance calculation between various natural factors and the NDVI of Spartina alterniflora
| 因素 Factor | 温度 Temperature (℃) | 降水量 Precipitation (mm) | 日照时间 Sunshine duration (h) | 距海岸线距离 Distance from shoreline (m) | 海拔 Altitude (m) | 坡度 Gradient (°) | 黄河年输沙量 Annual sediment discharge (108 t) |
|---|---|---|---|---|---|---|---|
| 相关系数 Correlation coefficient | 0.346* | 0.667* | 0.760** | 0.986** | -0.964* | -0.720* | 0.433* |
| [1] | Abubakar GA, Wang K, Koko AF, Husseini MI, Shuka KAM, Deng J, Gan M (2023). Mapping maize cropland and land cover in semi-arid region in northern Nigeria using machine learning and Google Earth Engine. Remote Sensing, 15, 2835. DOI: 10.3390/rs15112835. |
| [2] | Biçe K, Schalles J, Sheldon JE, Alber M, Meile C (2023). Temporal patterns and causal drivers of aboveground plant biomass in a coastal wetland: insights from time-series analyses. Frontiers in Marine Science, 10, 1130958. DOI: 10.3389/fmars.2023.1130958. |
| [3] | Chang D, Wang ZY, Ning XG, Li ZJ, Zhang L, Liu XT (2022). Vegetation changes in Yellow River Delta wetlands from 2018 to 2020 using PIE-Engine and short time series Sentinel-2 images. Frontiers in Marine Science, 9, 977050. DOI: 10.3389/fmars.2022.977050. |
| [4] | Chen XP, Zhao XY, Zhang J, Wang RX, Lu JN (2023). Variation of NDVI spatio-temporal characteristics and its driving factors based on geodetector model in Horqin Sandy Land, China. Chinese Journal of Plant Ecology, 47, 1082-1093. |
|
[陈雪萍, 赵学勇, 张晶, 王瑞雄, 卢建男 (2023). 基于地理探测器的科尔沁沙地植被NDVI时空变化特征及其驱动因素. 植物生态学报, 47, 1082-1093.]
DOI |
|
| [5] | Congalton RG, Green K (2019). Assessing the Accuracy of Remotely Sensed Data: Principles and Practices. 3rd ed. CRC Press, Boca Raton. |
| [6] | Cui BS, Yang QC, Yang ZF, Zhang KJ (2009). Evaluating the ecological performance of wetland restoration in the Yellow River Delta, China. Ecological Engineering, 35, 1090-1103. |
| [7] | de Luca G, Silva JMN, Cerasoli S, Araújo J, Campos J, Di Fazio S, Modica G (2019). Object-based land cover classification of cork oak woodlands using UAV imagery and Orfeo ToolBox. Remote Sensing, 11, 1238. DOI: 10.3390/rs11101238. |
| [8] |
Hao Q, Huang C (2023). A review of forest aboveground biomass estimation based on remote sensing data. Chinese Journal of Plant Ecology, 47, 1356-1374.
DOI |
|
[郝晴, 黄昌 (2023). 森林地上生物量遥感估算研究综述. 植物生态学报, 47, 1356-1374.]
DOI |
|
| [9] | Hearst MA, Dumais ST, Osuna E, Platt J, Scholkopf B (1998). Support vector machines. IEEE Intelligent Systems and Their Applications, 13, 18-28. |
| [10] | Huang S, Tang L, Hupy JP, Wang Y, Shao G (2021). A commentary review on the use of normalized difference vegetation index (NDVI) in the era of popular remote sensing. Journal of Forestry Research, 32, 1-6. |
| [11] | Hung HY, Hsu CR, Shao BH, Lo NC, Huang KY (2023). In-depth mining spatial pattern of invasive alien species by deep learning from phenological-based drone images// IGARSS 2023-2023 IEEE International Geoscience and Remote Sensing Symposium. Pasadena, USA. 6208-6211. |
| [12] | Jiang FG, Deng ML, Long Y, Sun H (2022). Spatial pattern and dynamic change of vegetation greenness from 2001 to 2020 in Tibet, China. Frontiers in Plant Science, 13, 892625. DOI: 10.3389/fpls.2022.892625. |
| [13] |
Li ST, Wu Q, Kang XD (2023). Hyperspectral remote sensing image intrinsic information decomposition: advances and challenges. Acta Geodaetica et Cartographica Sinica, 52, 1059-1073.
DOI |
|
[李树涛, 吴琼, 康旭东 (2023). 高光谱遥感图像本征信息分解前沿与挑战. 测绘学报, 52, 1059-1073.]
DOI |
|
| [14] | Li ZJ, Wang ZY, Liu XT, Zhu YD, Wang K, Zhang TG (2022). Classification and evolutionary analysis of Yellow River Delta wetlands using decision tree based on time series SAR backscattering coefficient and coherence. Frontiers in Marine Science, 9, 940342. DOI: 10.3389/fmars.2022.940342. |
| [15] | Lin XF, Cheng YW, Chen G, Chen WJ, Chen R, Gao DM, Zhang YL, Wu YB (2023). Semantic segmentation of China’s coastal wetlands based on Sentinel-2 and SegFormer. Remote Sensing, 15, 3714. DOI: 10.3390/rs15153714. |
| [16] | Liu MY, Li HY, Li L, Man WD, Jia MM, Wang ZM, Lu CY (2017). Monitoring the invasion of Spartina alterniflora using multi-source high-resolution imagery in the Zhangjiang Estuary, China. Remote Sensing, 9, 539. DOI: 10.3390/rs9060539. |
| [17] | Liu MY, Mao DH, Wang ZM, Li L, Man WD, Jia MM, Ren CY, Zhang YZ (2018). Rapid invasion of Spartina alterniflora in the coastal zone of mainland China: new observations from Landsat OLI images. Remote Sensing, 10, 1933. DOI: 10.3390/rs10121933. |
| [18] | Liu XT, Zheng XW, Wang ZY, Li ZJ, Wang K, Zhang HY, Duan JC (2024). Monitoring wetland changes and analyzing the Spartina alterniflora invasion in the Yellow River Delta over the past 30 years based on Google Earth Engine. IEEE Geoscience and Remote Sensing Letters, 21, 5003005. DOI: 10.1109/LGRS.2024.3400027. |
| [19] | Liu YF, Ma J, Wang XX, Zhong QY, Zong JM, Wu WB, Wang Q, Zhao B (2020). Joint effect of Spartina alterniflora invasion and reclamation on the spatial and temporal dynamics of tidal flats in Yangtze River Estuary. Remote Sensing, 12, 1725. DOI: 10.3390/rs12111725. |
| [20] | Long XR, Lin H, An XX, Chen SD, Qi SY, Zhang M (2022). Evaluation and analysis of ecosystem service value based on land use/cover change in Dongting Lake wetland. Ecological Indicators, 136, 108619. DOI: 10.1016/j.ecolind.2022.108619. |
| [21] | Mao DH, Liu MY, Wang ZM, Li L, Man WD, Jia MM, Zhang YZ (2019). Rapid invasion of Spartina alterniflora in the coastal zone of mainland China: spatiotemporal patterns and human prevention. Sensors, 19, 2308. DOI: 10.3390/s19102308. |
| [22] | McNairn H, Shang J (2016). A review of multitemporal synthetic aperture radar (SAR) for crop monitoring//Ban Y. Multitemporal Remote Sensing. Remote Sensing and Digital Image Processing: Vol 20. Springer, Cham. 317-340. |
| [23] | Mohajane M, Costache R, Karimi F, Pham QB, Essahlaoui A, Nguyen H, Laneve G, Oudija F (2021). Application of remote sensing and machine learning algorithms for forest fire mapping in a Mediterranean area. Ecological Indicators, 129, 107869. DOI: 10.1016/j.ecolind.2021.107869. |
| [24] | O’Neill RV, Krummel JR, Gardner RH, Sugihara G, Jackson B, DeAngelis DL, Milne BT, Turner MG, Zygmunt B, Christensen SW, Dale VH, Graham RL (1988). Indices of landscape pattern. Landscape Ecology, 1, 153-162. |
| [25] | Passeri DL, Hagen SC, Medeiros SC, Bilskie MV, Alizad K, Wang D (2015). The dynamic effects of sea level rise on low-gradient coastal landscapes: a review. Earth’s Future, 3, 159-181. |
| [26] | Qiu ZQ, Mao DH, Feng KD, Wang M, Xiang HX, Wang ZM (2022). High-resolution mapping changes in the invasion of Spartina alterniflora in the Yellow River Delta. IEEE Journal of Selected Topics in Applied Earth Observations and Remote Sensing, 15, 6445-6455. |
| [27] | Ren GB, Zhao YJ, Wang JB, Wu PQ, Ma Y (2021). Ecological effects analysis of Spartina alterniflora invasion within Yellow River delta using long time series remote sensing imagery. Estuarine, Coastal and Shelf Science, 249, 107111. DOI: 10.1016/j.ecss.2020.107111. |
| [28] | Richards IV DF, Milewski AM, Becker S, Donaldson Y, Davidson LJ, Zowam FJ, Mrazek J, Durham M (2024). Evaluation and analysis of remote sensing-based approach for salt marsh monitoring. Remote Sensing, 16, 2. DOI: 10.3390/rs16010002. |
| [29] | Sheykhmousa M, Mahdianpari M, Ghanbari H, Mohammadimanesh F, Ghamisi P, Homayouni S (2020). Support vector machine versus random forest for remote sensing image classification: a meta-analysis and systematic review. IEEE Journal of Selected Topics in Applied Earth Observations and Remote Sensing, 13, 6308-6325. |
| [30] | Sun WW, Du Q (2019). Hyperspectral band selection: a review. IEEE Geoscience and Remote Sensing Magazine, 7, 118-139. |
| [31] | Tian YL, Jia MM, Wang ZM, Mao DH, Du BJ, Wang C (2020). Monitoring invasion process of Spartina alterniflora by seasonal Sentinel-2 imagery and an object-based random forest classification. Remote Sensing, 12, 1383. DOI: 10.3390/rs12091383. |
| [32] |
Vapnik VN (1999). An overview of statistical learning theory. IEEE Transactions on Neural Networks, 10, 988-999.
DOI PMID |
| [33] | Wang Q, An SQ, Ma Z, Zhao B, Chen JK, Li B (2006). Invasive Spartina alterniflora: biology, ecology and management. Acta Phytotaxonomica Sinica, 44, 559-588. |
| [34] | Wang X, Xiao X, Zou Z, Chen B, Ma J, Dong J, Doughty RB, Zhong Q, Qin Y, Dai S, LI X, Zhao B, Li B (2020). Tracking annual changes of coastal tidal flats in China during 1986-2016 through analyses of Landsat images with Google Earth Engine. Remote Sensing of Environment, 238, 110987. DOI: 10.1016/j.rse.2018.11.030. |
| [35] | Wei CX, Guo B, Lu M, Zang WQ, Yang F, Liu C, Wang BY, Huang XZ, Liu YF, Yu Y, Li JL, Xu M (2023). The changes in dominant driving factors in the evolution process of wetland in the Yellow River Delta during 2015-2022. Remote Sensing, 15, 2858. DOI: 10.3390/rs15112858. |
| [36] | Wu W, Grimes E, Suir G (2023). Impact of freshwater diversions on vegetation in coastal wetlands based on remote sensing derived vegetation index. Frontiers in Marine Science, 10, 1202300. DOI: 10.3389/fmars.2023.1202300. |
| [37] | Xie CH, Zhang SY, Cui LZ, An WT, Tang JK (2022). Progress and trend of remote sensing classification of land cover in the Yellow River Delta. Science Technology and Engineering, 22, 14571-14583. |
| [谢春华, 张帅影, 崔丽珍, 安文韬, 唐家奎 (2022). 黄河三角洲地物遥感分类研究进展与趋势. 科学技术与工程, 22, 14571-14583.] | |
| [38] | Xie T, Wang Q, Ning ZH, Chen C, Cui BS, Bai JH, Shi W, Pang B (2021). Artificial modification on lateral hydrological connectivity promotes range expansion of invasive Spartina alterniflora in salt marshes of the Yellow River delta, China. Science of the Total Environment, 769, 144476. DOI: 10.1016/j.scitotenv.2020.144476. |
| [39] | Yu JB, Zhan C, Li YZ, Zhou D, Fu YQ, Chu XJ, Xing QH, Han GX, Wang GM, Guan B, Wang Q (2016). Distribution of carbon, nitrogen and phosphorus in coastal wetland soil related land use in the Modern Yellow River Delta. Scientific Reports, 6, 37940. DOI: 10.1038/srep37940. |
| [40] | Zhang CY, Chen SL, Li P, Liu QL (2022). Spatiotemporal dynamic remote sensing monitoring of typical wetland vegetation in the Current Huanghe River Estuary Reserve. Haiyang Xuebao, 44(1), 125-136. |
| [张晨宇, 陈沈良, 李鹏, 刘清兰 (2022). 现行黄河口保护区典型湿地植被时空动态遥感监测. 海洋学报, 44(1), 125-136.] | |
| [41] | Zhang JM, Chu L, Zhang ZX, Zhu B, Liu XY, Yang Q (2023). Evolution of small and micro wetlands and their driving factors in the Yangtze River Delta—A case study of Wuxi area. Remote Sensing, 15, 1152. DOI: 10.3390/rs15041152. |
| [42] | Zhang X, Xiao XM, Wang XX, Xu X, Chen BQ, Wang J, Ma J, Zhao B, Li B (2020). Quantifying expansion and removal of Spartina alterniflora on Chongming island, China, using time series Landsat images during 1995-2018. Remote Sensing of Environment, 247, 111916. DOI: 10.1016/j.rse.2020.111916. |
| [43] | Zhu X, Meng L, Zhang Y, Weng Q, Morris J (2019). Tidal and meteorological influences on the growth of invasive Spartina alterniflora: evidence from UAV remote sensing. Remote Sensing, 11, 1208. DOI: 10.3390/rs11101208. |
| [1] | 王晓颖, 孙志高, 陈冰冰, 武慧慧, 张党玉. 闽江河口互花米草残体异位分解及磷养分释放特征[J]. 植物生态学报, 2024, 48(7): 844-857. |
| [2] | 李雪, 董杰, 韩广轩, 张奇奇, 谢宝华, 李培广, 赵明亮, 陈克龙, 宋维民. 黄河三角洲典型滨海盐沼湿地土壤CO2和CH4排放对水盐变化的响应[J]. 植物生态学报, 2023, 47(3): 434-446. |
| [3] | 史欢欢, 雪穷, 于振林, 汪承焕. 密度、物种比例对盐沼植物种子萌发阶段种内、种间相互作用的影响[J]. 植物生态学报, 2023, 47(1): 77-87. |
| [4] | 孙慧敏, 姜姜, 崔莉娜, 张水锋, 张金池. 互花米草入侵对漳江口红树林湿地土壤有机碳官能团特征的影响[J]. 植物生态学报, 2018, 42(7): 774-784. |
| [5] | 陈权, 马克明. 互花米草入侵对红树林湿地沉积物重金属累积的效应与潜在机制[J]. 植物生态学报, 2017, 41(4): 409-417. |
| [6] | 孔庆仙, 夏江宝, 赵自国, 屈凡柱. 不同地下水矿化度对柽柳光合特征及树干液流的影响[J]. 植物生态学报, 2016, 40(12): 1298-1309. |
| [7] | 孙宝玉, 韩广轩, 陈亮, 初小静, 邢庆会, 吴立新, 朱书玉. 模拟增温对黄河三角洲滨海湿地非生长季土壤呼吸的影响[J]. 植物生态学报, 2016, 40(11): 1111-1123. |
| [8] | 王丹, 张荣, 熊俊, 郭海强, 赵斌. 互花米草入侵对滨海湿地土壤碳库的贡献——基于稳定同位素的研究[J]. 植物生态学报, 2015, 39(10): 941-949. |
| [9] | 胡楚琦, 刘金珂, 王天弘, 王文琳, 卢山, 周长芳. 三种盐胁迫对互花米草和芦苇光合作用的影响[J]. 植物生态学报, 2015, 39(1): 92-103. |
| [10] | 夏江宝, 张淑勇, 赵自国, 赵艳云, 高源, 谷广义, 孙景宽. 贝壳堤岛旱柳光合效率的土壤水分临界效应及其阈值分级[J]. 植物生态学报, 2013, 37(9): 851-860. |
| [11] | 朱敏,张振华,于君宝,吴立新,韩广轩,杨利琼,邢庆会,谢宝华,毛培利,王光美. 氮沉降对黄河三角洲芦苇湿地土壤呼吸的影响[J]. 植物生态学报, 2013, 37(6): 517-529. |
| [12] | 杨利琼,韩广轩,于君宝,吴立新,朱敏,邢庆会,王光美,毛培利. 开垦对黄河三角洲湿地净生态系统CO2交换的影响[J]. 植物生态学报, 2013, 37(6): 503-516. |
| [13] | 吴大千, 刘建, 王炜, 丁文娟, 王仁卿. 黄河三角洲植被指数与地形要素的多尺度分析[J]. 植物生态学报, 2009, 33(2): 237-245. |
| [14] | 赵聪蛟, 邓自发, 周长芳, 关保华, 安树青, 陈琳, 陆霞梅. 氮水平和竞争对互花米草与芦苇叶特征的影响[J]. 植物生态学报, 2008, 32(2): 392-401. |
| [15] | 陈琳, 邓自发, 安树青, 赵聪蛟, 周长芳, 智颖飙. 淡咸水轮换浇灌抑制互花米草的克隆生长和繁殖[J]. 植物生态学报, 2007, 31(4): 645-651. |
| 阅读次数 | ||||||
|
全文 |
|
|||||
|
摘要 |
|
|||||
Copyright © 2026 版权所有 《植物生态学报》编辑部
地址: 北京香山南辛村20号, 邮编: 100093
Tel.: 010-62836134, 62836138; Fax: 010-82599431; E-mail: apes@ibcas.ac.cn, cjpe@ibcas.ac.cn
备案号: 京ICP备16067583号-19
![]()