
植物生态学报 ›› 2023, Vol. 47 ›› Issue (3): 434-446.DOI: 10.17521/cjpe.2021.0486
所属专题: 微生物生态学
• 研究论文 • 上一篇
李雪1,3,4, 董杰3, 韩广轩1,2, 张奇奇1, 谢宝华1,2, 李培广1,2, 赵明亮1,2, 陈克龙4, 宋维民1,2,*( )
)
收稿日期:2021-12-20
接受日期:2022-05-20
出版日期:2023-03-20
发布日期:2022-05-21
通讯作者:
宋维民
作者简介:* (wmsong@yic.ac.cn)基金资助:
LI Xue1,3,4, DONG Jie3, HAN Guang-Xuan1,2, ZHANG Qi-Qi1, XIE Bao-Hua1,2, LI Pei-Guang1,2, ZHAO Ming-Liang1,2, CHEN Ke-Long4, SONG Wei-Min1,2,*()
Received:2021-12-20
Accepted:2022-05-20
Online:2023-03-20
Published:2022-05-21
Contact:
SONG Wei-Min
Supported by:摘要:
滨海盐沼湿地是重要的“蓝碳”碳汇, 研究水盐变化对土壤碳矿化(CO2和CH4排放)的影响, 对理解滨海盐沼湿地的碳汇稳定机制具有重要意义。该研究选取黄河三角洲典型盐沼湿地土壤为研究对象, 通过水盐梯度模拟实验, 研究土壤碳矿化、理化性质、微生物生物量及群落结构对不同土壤水分和盐分含量的响应。主要结果: (1)水盐变化对土壤CO2、CH4排放量以及CH4:CO2的影响均不存在交互作用, CO2排放量随土壤含水量增加呈先升后降的单峰型变化趋势, 盐分含量升高则显著抑制CO2排放; 水分含量升高对CH4排放具有显著促进作用, 盐分升高则显著抑制CH4排放。(2)水盐变化对土壤可溶性有机碳(DOC)含量具有弱交互作用, 在低水分处理下, DOC随着土壤盐分的增加呈减少趋势, 但在高水分处理下呈增加趋势; CO2排放与DOC含量呈显著正相关关系, 而CH4排放与DOC含量没有显著相关性。(3)土壤微生物生物量随水分含量的增加呈先增加后降低的变化趋势, 随盐分含量的升高则显著降低; 且相比于CH4排放, CO2排放量与微生物生物量具有更高的相关关系。(4)水盐变化显著改变了土壤微生物群落结构, 细菌数量和α多样性指数均随水分含量升高而显著增加, 随盐分含量升高则显著降低; 同时发现土壤CO2、CH4排放均与细菌数量、α多样性指数具有显著正相关关系。因此, 在该地区气候暖干化背景下, 土壤水盐条件变化将可能通过调控土壤理化性质、微生物生物量及群落结构等条件对该滨海盐沼湿地碳汇功能产生深远影响。
李雪, 董杰, 韩广轩, 张奇奇, 谢宝华, 李培广, 赵明亮, 陈克龙, 宋维民. 黄河三角洲典型滨海盐沼湿地土壤CO2和CH4排放对水盐变化的响应. 植物生态学报, 2023, 47(3): 434-446. DOI: 10.17521/cjpe.2021.0486
LI Xue, DONG Jie, HAN Guang-Xuan, ZHANG Qi-Qi, XIE Bao-Hua, LI Pei-Guang, ZHAO Ming-Liang, CHEN Ke-Long, SONG Wei-Min. Response of soil CO2 and CH4 emissions to changes in moisture and salinity at a typical coastal salt marsh of Yellow River Delta. Chinese Journal of Plant Ecology, 2023, 47(3): 434-446. DOI: 10.17521/cjpe.2021.0486
| TC (g·kg-1) | TN (g·kg-1) | NH4+ -N (mg·kg-1) | NO3- -N (mg·kg-1) | pH | Soil salinity (%) |
|---|---|---|---|---|---|
| 12.76 ± 0.07 | 0.21 ± 0.01 | 6.56 ± 0.06 | 1.49 ± 0.03 | 7.64 ± 0.04 | 0.90 ± 0.04 |
表1 黄河三角洲滨海盐沼湿地0-10 cm表层土壤基本特征(平均值±标准误)
Table 1 Soil physiochemical properties at 0-10 cm depth in the research site at coastal salt marsh of Yellow River Delta (mean ± SE)
| TC (g·kg-1) | TN (g·kg-1) | NH4+ -N (mg·kg-1) | NO3- -N (mg·kg-1) | pH | Soil salinity (%) |
|---|---|---|---|---|---|
| 12.76 ± 0.07 | 0.21 ± 0.01 | 6.56 ± 0.06 | 1.49 ± 0.03 | 7.64 ± 0.04 | 0.90 ± 0.04 |
| 因子 Factor | TC | TN | DOC | MBC | Cumulative CO2 | Cumulative CH4 | GWP | CH4:CO2 | |
|---|---|---|---|---|---|---|---|---|---|
| 土壤水分 Soil moisture | p | <0.01 | 0.65 | <0.01 | <0.01 | <0.01 | <0.01 | <0.01 | 0.09 |
| F | 33.78 | 0.56 | 21.08 | 8.33 | 72.17 | 6.38 | 14.21 | 2.42 | |
| 土壤盐分 Soil salinity | p | 0.22 | <0.01 | 0.15 | 0.02 | <0.01 | <0.01 | <0.01 | 0.01 |
| F | 1.59 | 9.06 | 2.22 | 6.07 | 47.68 | 14.73 | 22.99 | 7.71 | |
| 土壤水分×盐分 Soil moisture × salinity | p | 0.79 | 0.92 | 0.06 | 0.04 | 0.29 | 0.96 | 0.95 | 0.88 |
| F | 0.35 | 0.17 | 2.81 | 3.33 | 1.33 | 0.10 | 0.12 | 0.23 |
表2 土壤水分和盐分对土壤理化性质和碳矿化速率影响的方差分析
Table 2 Results of two-way ANOVA on the effects of soil moisture and salinity on soil physical and chemical characteristics as well as soil carbon mineralization rate
| 因子 Factor | TC | TN | DOC | MBC | Cumulative CO2 | Cumulative CH4 | GWP | CH4:CO2 | |
|---|---|---|---|---|---|---|---|---|---|
| 土壤水分 Soil moisture | p | <0.01 | 0.65 | <0.01 | <0.01 | <0.01 | <0.01 | <0.01 | 0.09 |
| F | 33.78 | 0.56 | 21.08 | 8.33 | 72.17 | 6.38 | 14.21 | 2.42 | |
| 土壤盐分 Soil salinity | p | 0.22 | <0.01 | 0.15 | 0.02 | <0.01 | <0.01 | <0.01 | 0.01 |
| F | 1.59 | 9.06 | 2.22 | 6.07 | 47.68 | 14.73 | 22.99 | 7.71 | |
| 土壤水分×盐分 Soil moisture × salinity | p | 0.79 | 0.92 | 0.06 | 0.04 | 0.29 | 0.96 | 0.95 | 0.88 |
| F | 0.35 | 0.17 | 2.81 | 3.33 | 1.33 | 0.10 | 0.12 | 0.23 |
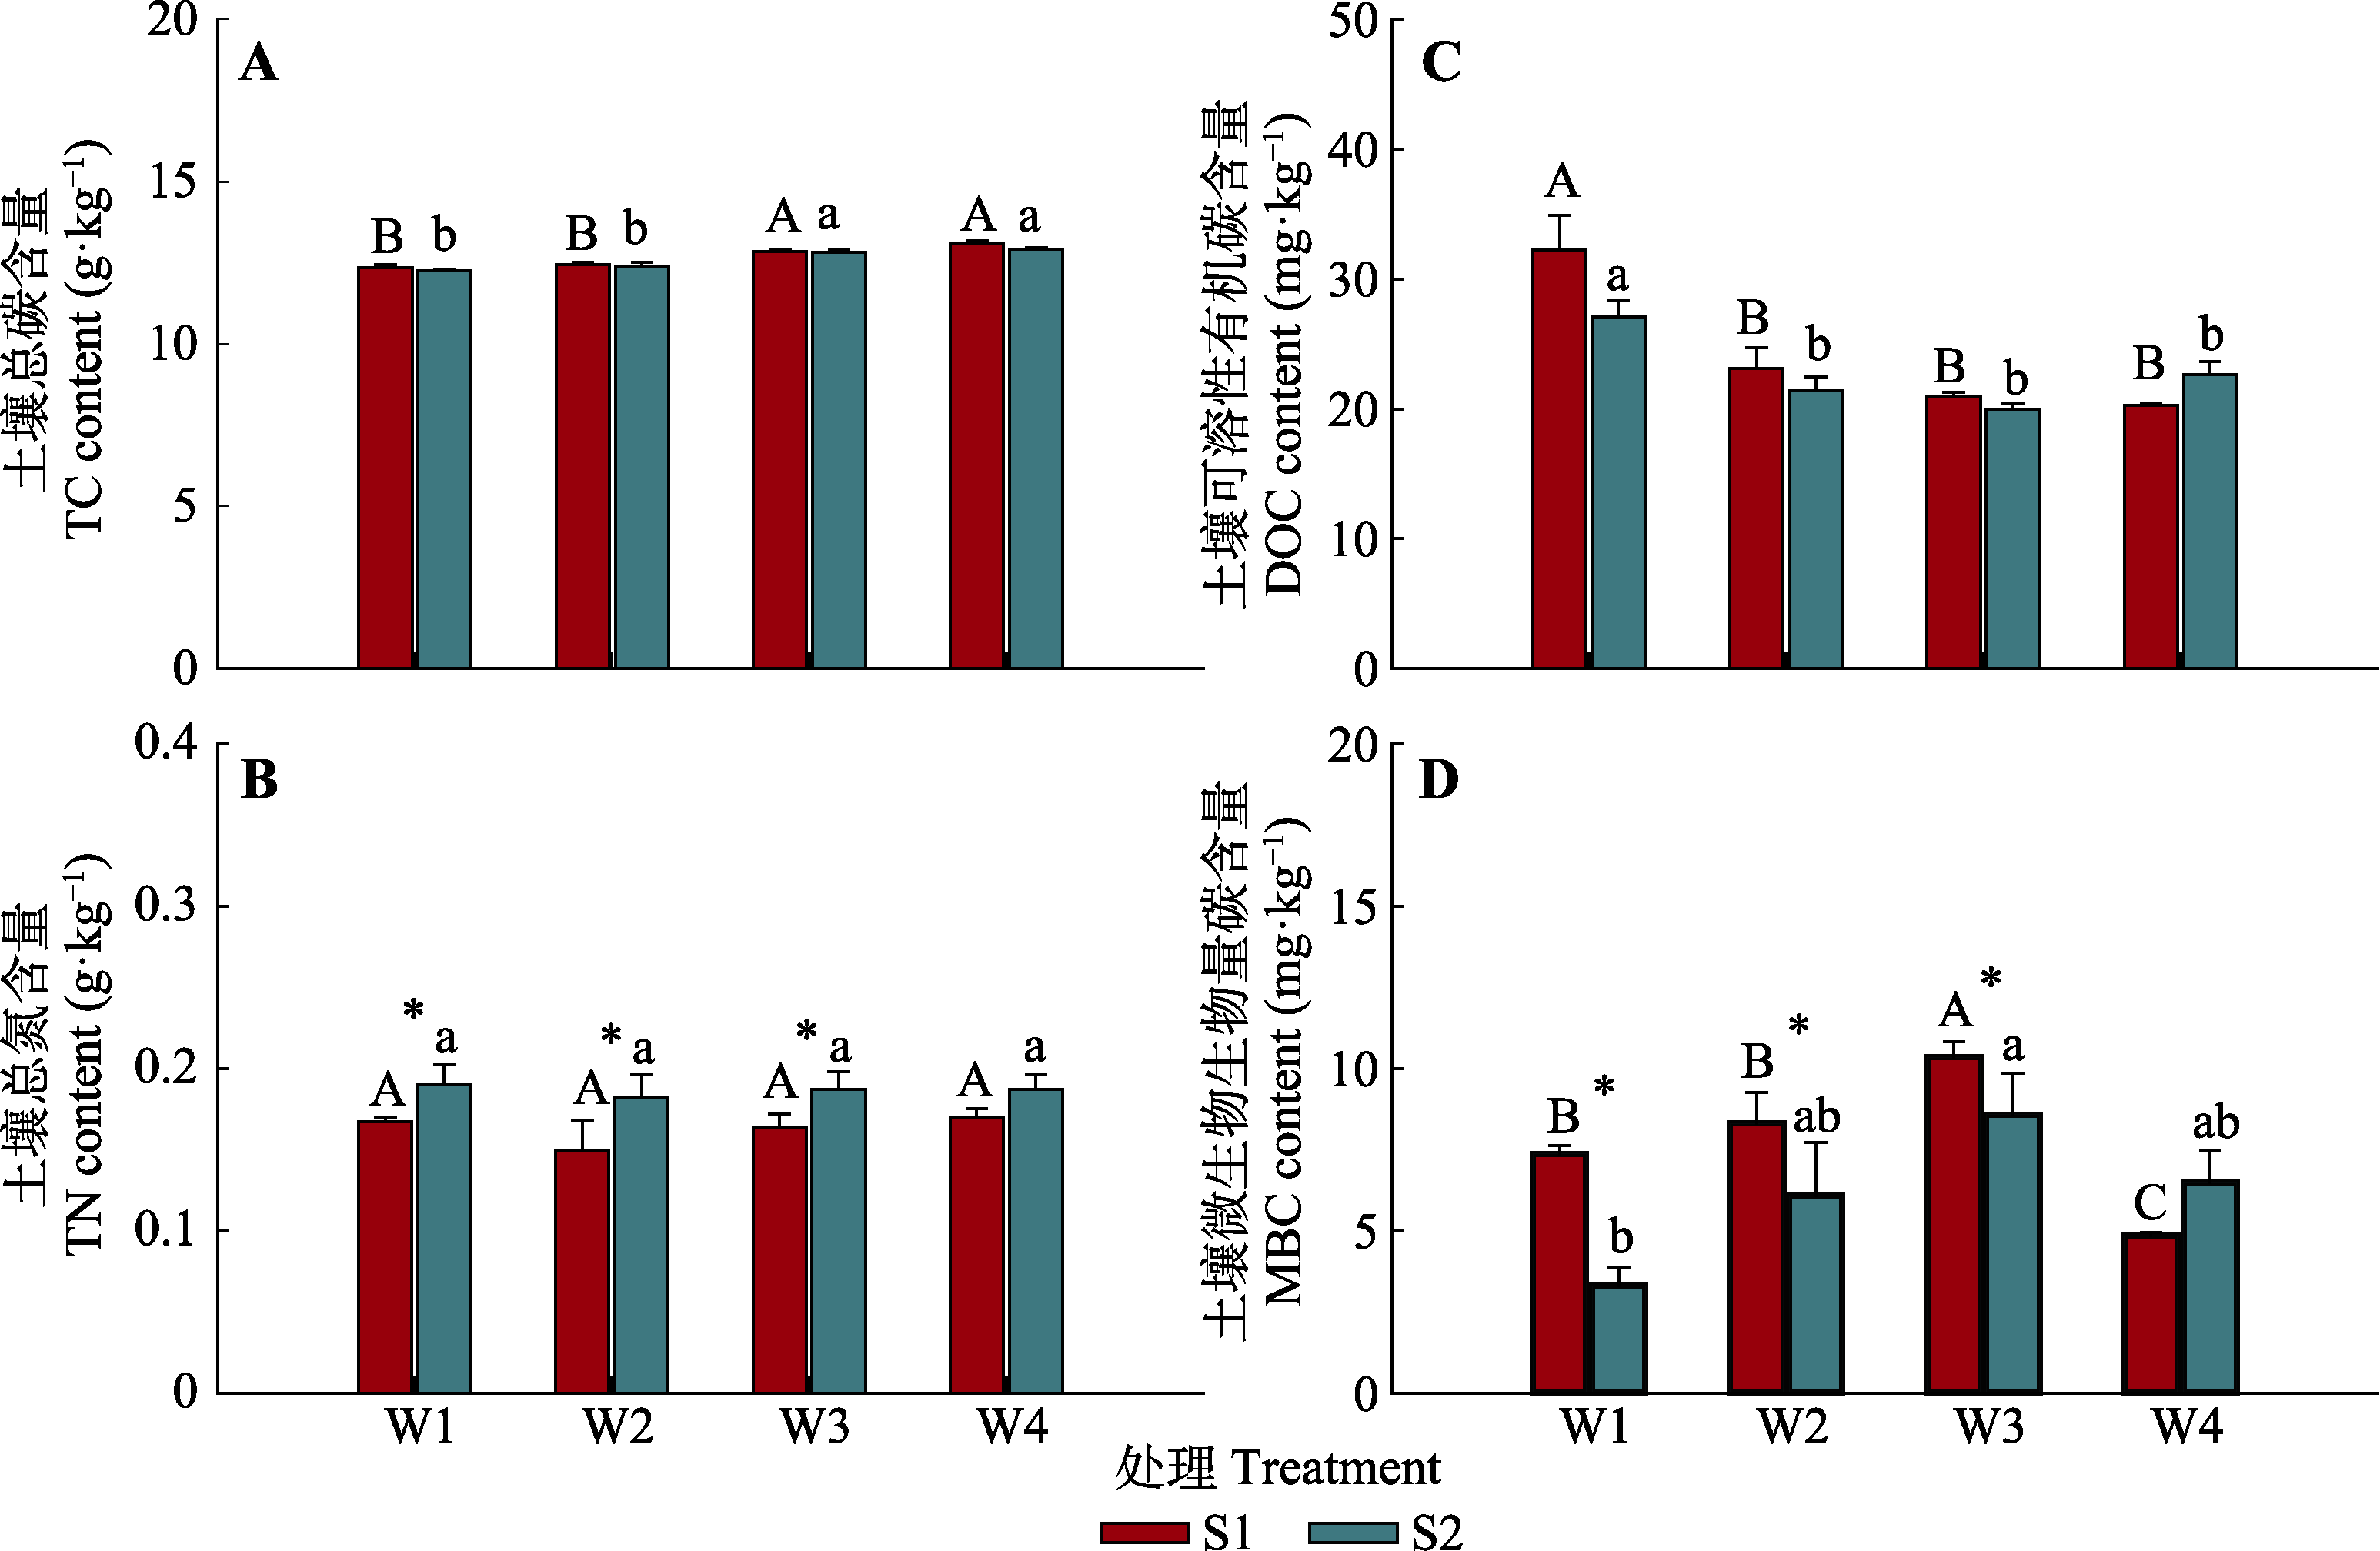
图1 不同水盐处理下土壤总碳(TC) (A)、总氮(TN) (B)、可溶性有机碳(DOC) (C)和微生物生物量碳(MBC) (D)含量的均值变化(标准值±标准误)。不同大写字母表示在低盐分(S1)下不同水分处理间的差异显著(p < 0.05), 不同小写字母表示在高盐分(S2)下不同水分处理间的差异显著(p < 0.05), *表示相同水分下不同盐分处理间的差异显著(p < 0.05)。W1, 25%土壤饱和含水量; W2, 50%土壤饱和含水量; W3, 75%土壤饱和含水量; W4, 100%土壤饱和含水量。
Fig. 1 Effects of soil moisture and salinity on mean values of soil total carbon (TC) content (A), soil total nitrogen (TN) content (B), soil dissolved organic carbon (DOC) content (C) and soil microbial biomass carbon (MBC) content (D) (mean ± SE). Different uppercase letters indicate significant difference between soil moisture treatments under low salinity level (S1) (p < 0.05), different lowercase letters indicate significant difference between soil moisture treatments under high salinity level (S2) (p < 0.05), and * indicates the significant difference between salinity treatments under the same moisture condition (p < 0.05). W1, 25% soil saturated moisture content; W2, 50% soil saturated moisture content; W3, 75% soil saturated moisture content; W4, 100% soil saturated moisture content.
| 因子 Factor | 物种数量 Observed species | PD whole tree指数 PD whole tree index | Shannon-Wiener多样性指数 Shannon-Wiener diversity index | Chao1指数 Chao1 index | |
|---|---|---|---|---|---|
| 土壤水分 Soil moisture | p | <0.01 | <0.01 | <0.01 | <0.01 |
| F | 31.96 | 29.35 | 40.49 | 6.46 | |
| 土壤盐分 Soil salinity | p | <0.01 | <0.01 | <0.01 | 0.30 |
| F | 29.51 | 22.25 | 39.07 | 1.11 | |
土壤水分  ×盐分 ×盐分Soil moisture  × salinity × salinity | p | <0.01 | <0.01 | 0.01 | 0.82 |
| F | 9.02 | 6.93 | 5.25 | 0.31 |
表3 土壤水分和盐分含量对土壤细菌α多样性指数的双因素方差分析结果
Table 3 Results of two-way ANOVA on the effects of soil moisture and salinity on soil bacterial alpha diversity index
| 因子 Factor | 物种数量 Observed species | PD whole tree指数 PD whole tree index | Shannon-Wiener多样性指数 Shannon-Wiener diversity index | Chao1指数 Chao1 index | |
|---|---|---|---|---|---|
| 土壤水分 Soil moisture | p | <0.01 | <0.01 | <0.01 | <0.01 |
| F | 31.96 | 29.35 | 40.49 | 6.46 | |
| 土壤盐分 Soil salinity | p | <0.01 | <0.01 | <0.01 | 0.30 |
| F | 29.51 | 22.25 | 39.07 | 1.11 | |
| 土壤水分 ×盐分 Soil moisture × salinity | p | <0.01 | <0.01 | 0.01 | 0.82 |
| F | 9.02 | 6.93 | 5.25 | 0.31 |
| 盐分处理 Salinity treatment | 水分处理 Moisture treatment | 物种数量 Observed species | PD whole tree指数 PD whole tree index | Shannon-Wiener多样性指数 Shannon-Wiener diversity index | Chao1指数 Chao1 index |
|---|---|---|---|---|---|
| S1 | W1 | 2 603.26 ± 41.57Ba | 213.04 ± 10.30Ba | 6.59 ± 0.41Ba | 3 845.65 ± 165.76Ba |
| W2 | 3 068.08 ± 36.67Aa | 252.76 ± 3.12Aa | 8.29 ± 0.12Ba | 4 383.72 ± 70.05Aa | |
| W3 | 3 227.84 ± 34.21Aa | 265.12 ± 3.10Aa | 8.81 ± 0.05Aa | 4 577.47 ± 47.85Aa | |
| W4 | 3 241.94 ± 56.62Aa | 268.94 ± 5.06Aa | 8.44 ± 0.13Aa | 4 558.03 ± 63.28Aa | |
| S2 | W1 | 2 629.74 ± 18.92Ba | 223.32 ± 2.96Ba | 6.46 ± 0.08Ca | 3 881.19 ± 89.97Ba |
| W2 | 2 541.14 ± 64.56Bb | 219.07 ± 4.55Bb | 6.95 ± 0.19Bb | 3 836.97 ± 84.56ABb | |
| W3 | 2 903.29 ± 39.22Ab | 241.88 ± 2.68Ab | 7.72 ± 0.10Ab | 4 290.19 ± 56.94Ab | |
| W4 | 3 002.14 ± 29.46Ab | 251.94 ± 2.18Ab | 8.00 ± 0.02Ab | 4 395.78 ± 60.89Aa |
表4 不同水盐处理下土壤细菌α多样性指数(平均值±标准误)
Table 4 Soil bacterial alpha diversity index under different moisture and salinity treatments (mean ± SE)
| 盐分处理 Salinity treatment | 水分处理 Moisture treatment | 物种数量 Observed species | PD whole tree指数 PD whole tree index | Shannon-Wiener多样性指数 Shannon-Wiener diversity index | Chao1指数 Chao1 index |
|---|---|---|---|---|---|
| S1 | W1 | 2 603.26 ± 41.57Ba | 213.04 ± 10.30Ba | 6.59 ± 0.41Ba | 3 845.65 ± 165.76Ba |
| W2 | 3 068.08 ± 36.67Aa | 252.76 ± 3.12Aa | 8.29 ± 0.12Ba | 4 383.72 ± 70.05Aa | |
| W3 | 3 227.84 ± 34.21Aa | 265.12 ± 3.10Aa | 8.81 ± 0.05Aa | 4 577.47 ± 47.85Aa | |
| W4 | 3 241.94 ± 56.62Aa | 268.94 ± 5.06Aa | 8.44 ± 0.13Aa | 4 558.03 ± 63.28Aa | |
| S2 | W1 | 2 629.74 ± 18.92Ba | 223.32 ± 2.96Ba | 6.46 ± 0.08Ca | 3 881.19 ± 89.97Ba |
| W2 | 2 541.14 ± 64.56Bb | 219.07 ± 4.55Bb | 6.95 ± 0.19Bb | 3 836.97 ± 84.56ABb | |
| W3 | 2 903.29 ± 39.22Ab | 241.88 ± 2.68Ab | 7.72 ± 0.10Ab | 4 290.19 ± 56.94Ab | |
| W4 | 3 002.14 ± 29.46Ab | 251.94 ± 2.18Ab | 8.00 ± 0.02Ab | 4 395.78 ± 60.89Aa |
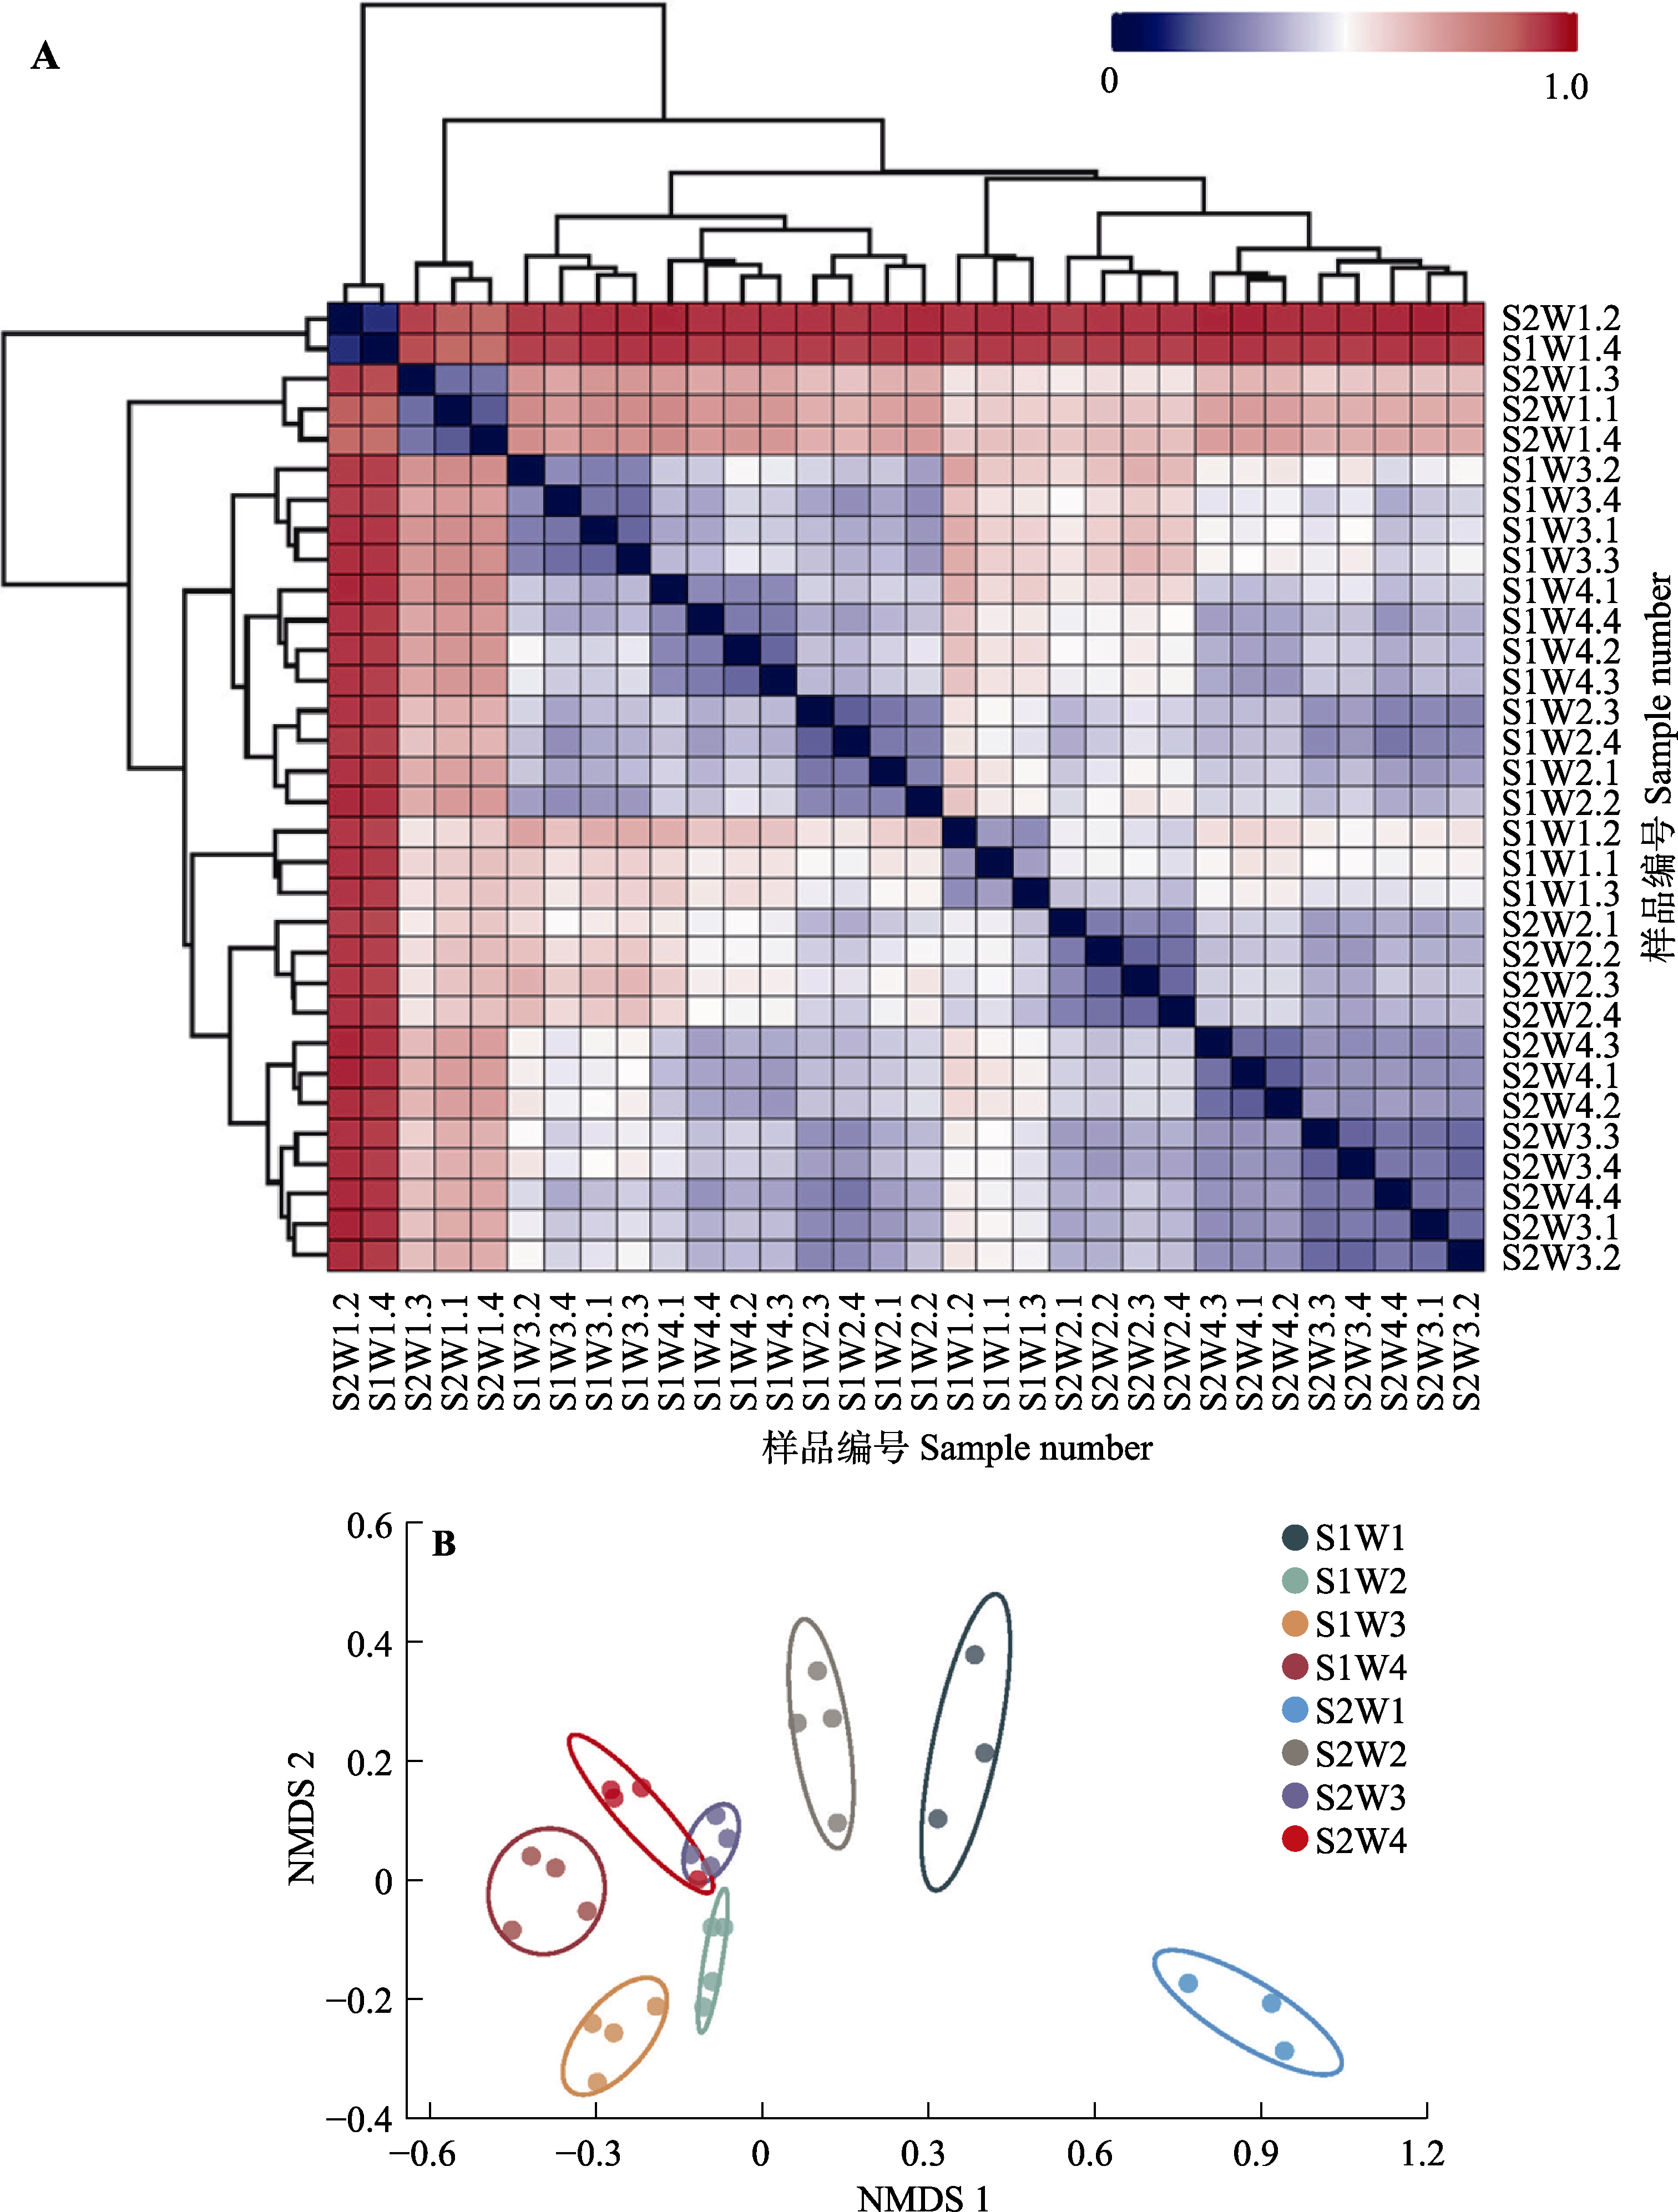
图2 土壤细菌群落样本距离热图(A)及非度量多维尺度分析(NMDS)分析图(B)。A中大写字母和数字代表土壤样品编号, B中大写字母和数字代表实验处理编号。S1, 9 g·kg-1的土壤盐分; S2, 18 g·kg-1的土壤盐分; W1, 25%的土壤饱和含水量; W2, 50%的土壤饱和含水量; W3, 75%的土壤饱和含水量; W4, 100%的土壤饱和含水量。
Fig. 2 Heat map of soil bacterial community sample distance (A) and non-metric multidimensional scaling (NMDS) analysis (B). In A, uppercase letters and numbers represent soil sample numbers; in B, uppercase letters and numbers represent the experimental treatment number. S1, 9 g·kg-1 soil salinity; S2, 18 g·kg-1 soil salinity; W1, 25% soil saturation moisture content; W2, 50% soil saturation moisture content; W3, 75% soil saturation moisture content; W4, 100% soil saturation moisture content.
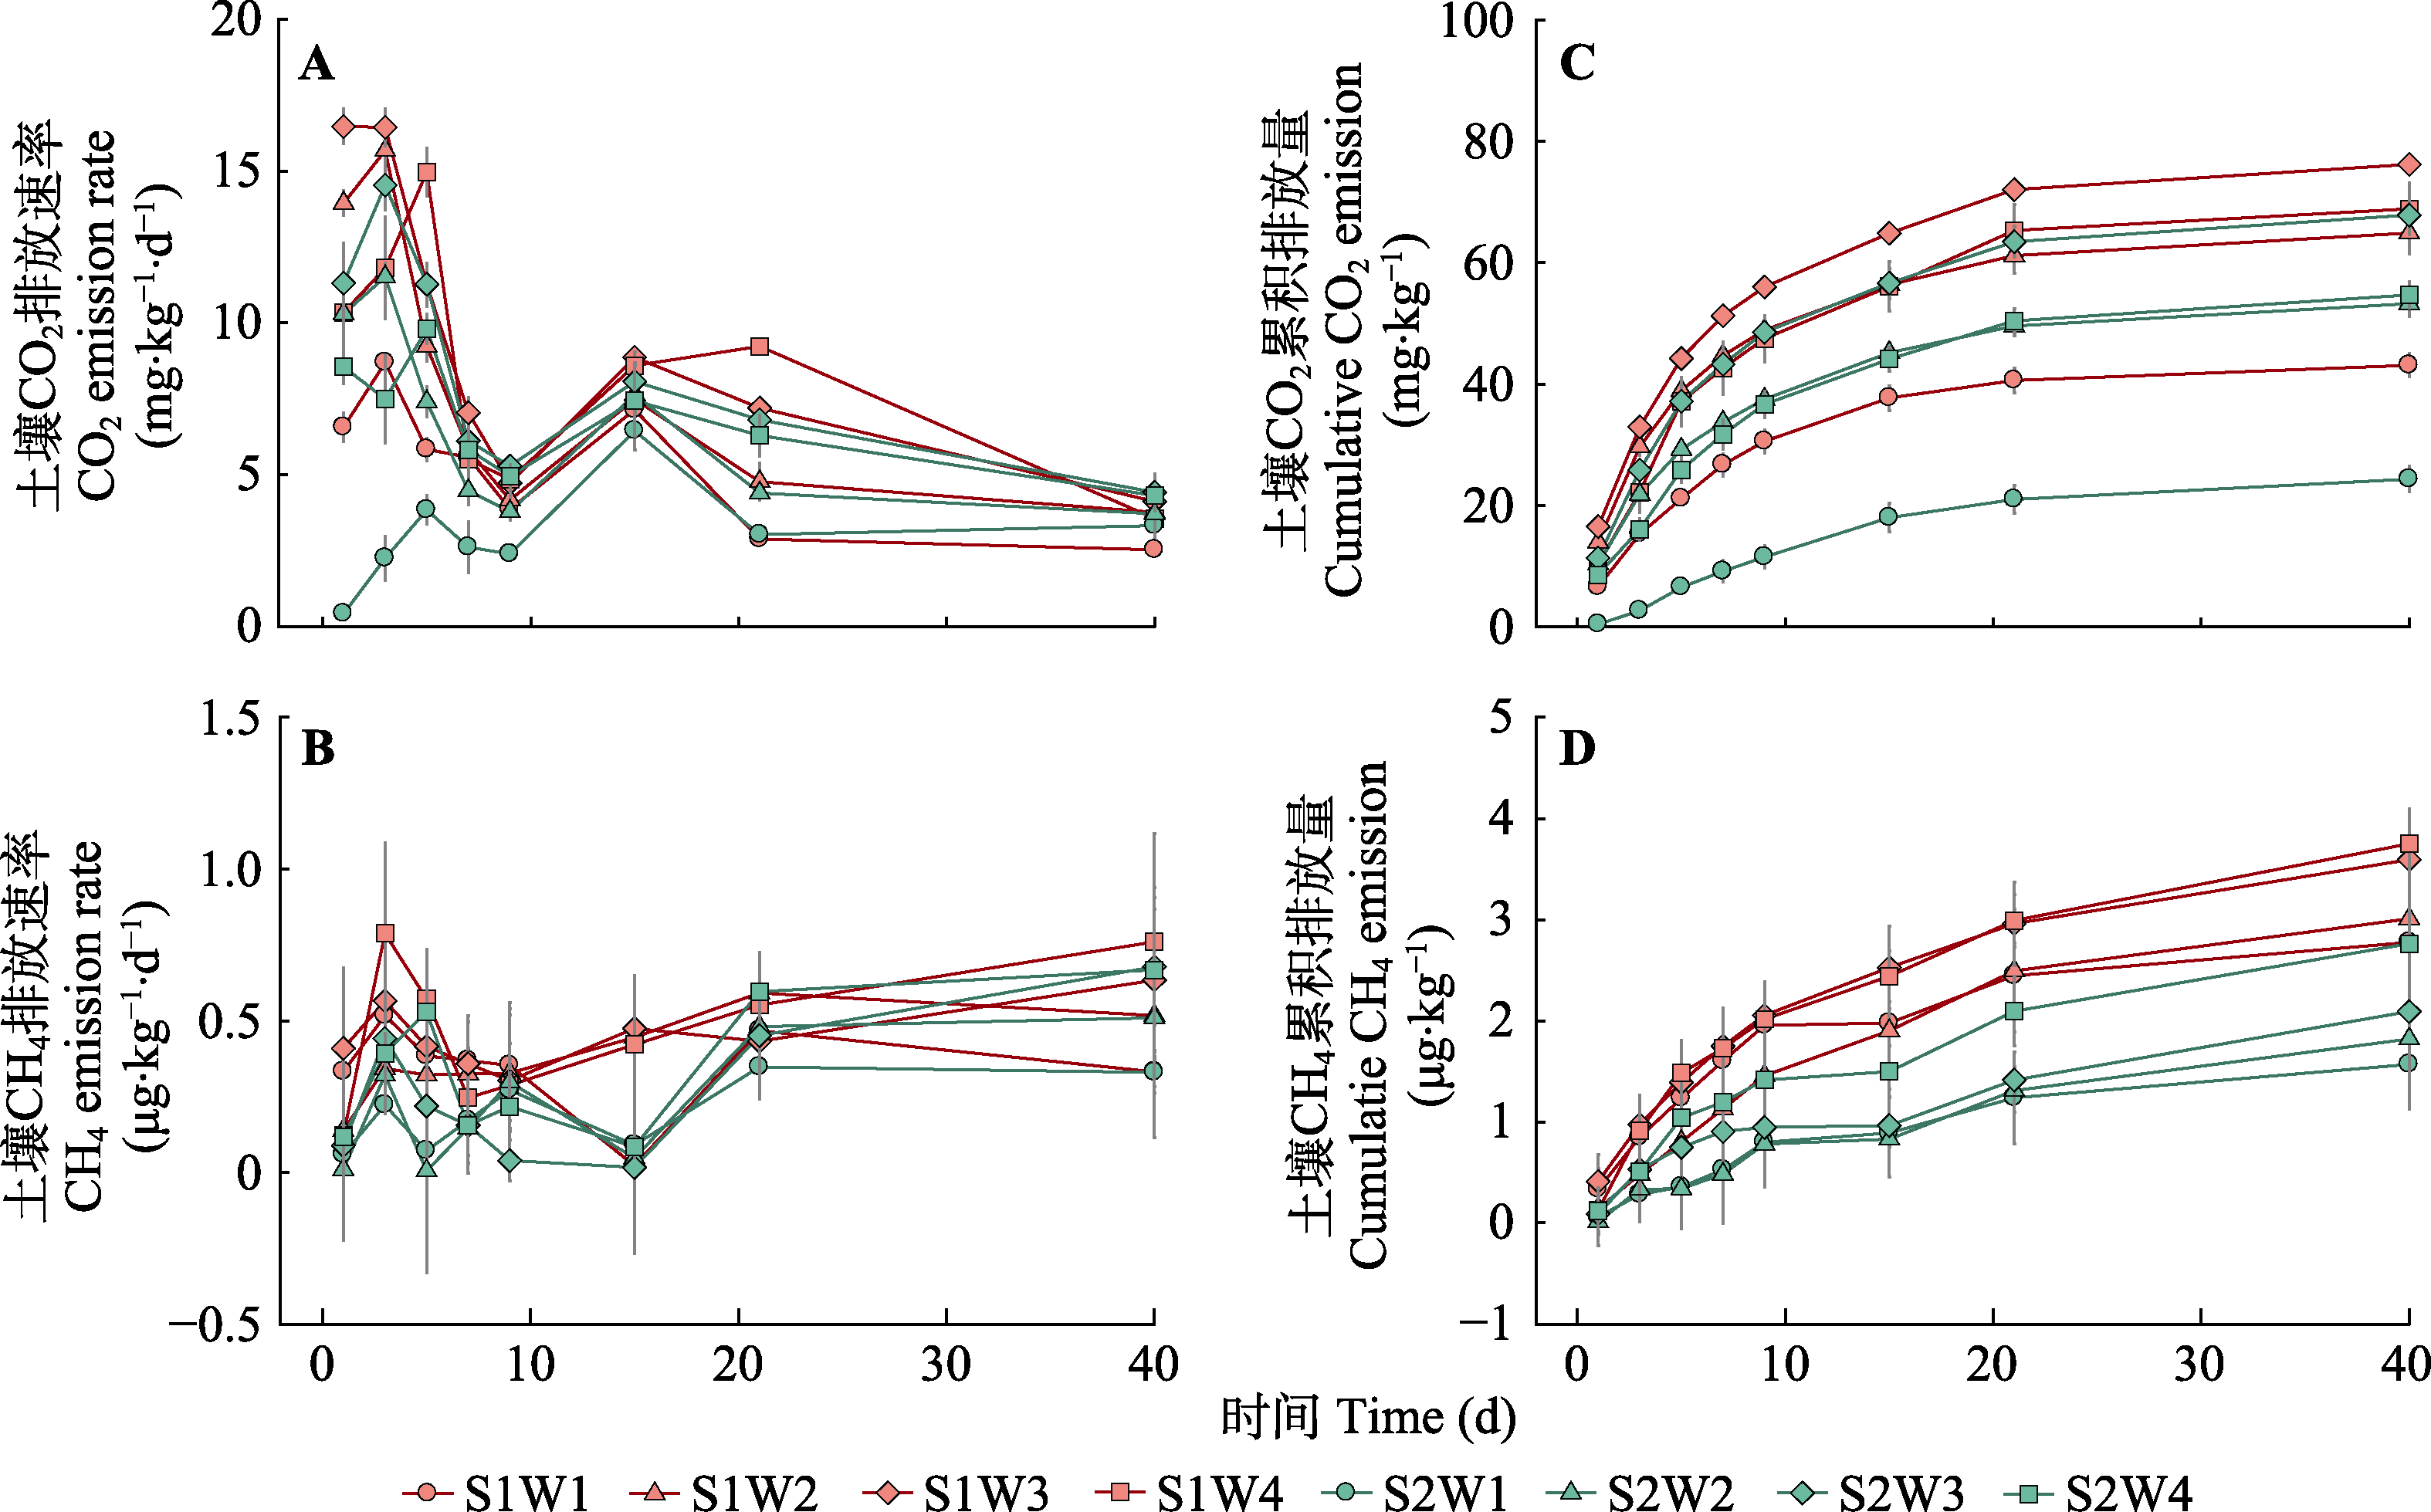
图3 不同水盐处理下土壤CO2排放速率(A)、土壤CH4排放速率(B)、土壤CO2累积排放量(C)和土壤CH4累积排放量(D)的动态变化(平均值±标准误)。S1, 9 g·kg-1的土壤盐分; S2, 18 g·kg-1的土壤盐分; W1, 25%的土壤饱和含水量; W2, 50%的土壤饱和含水量; W3, 75%的土壤饱和含水量; W4, 100%的土壤饱和含水量。
Fig. 3 Dynamic changes of soil CO2 emission rate (A), soil CH4 emission rate (B), soil cumulative CO2 emission rate (C) and soil cumulative CH4 emission rate (D) under different soil moisture and salinity treatments (mean ± SE). S1, 9 g·kg-1 soil salinity; S2, 18 g·kg-1 soil salinity; W1, 25% soil saturation moisture content; W2, 50% soil saturation moisture content; W3, 75% soil saturation moisture content; W4, 100% soil saturation moisture content.
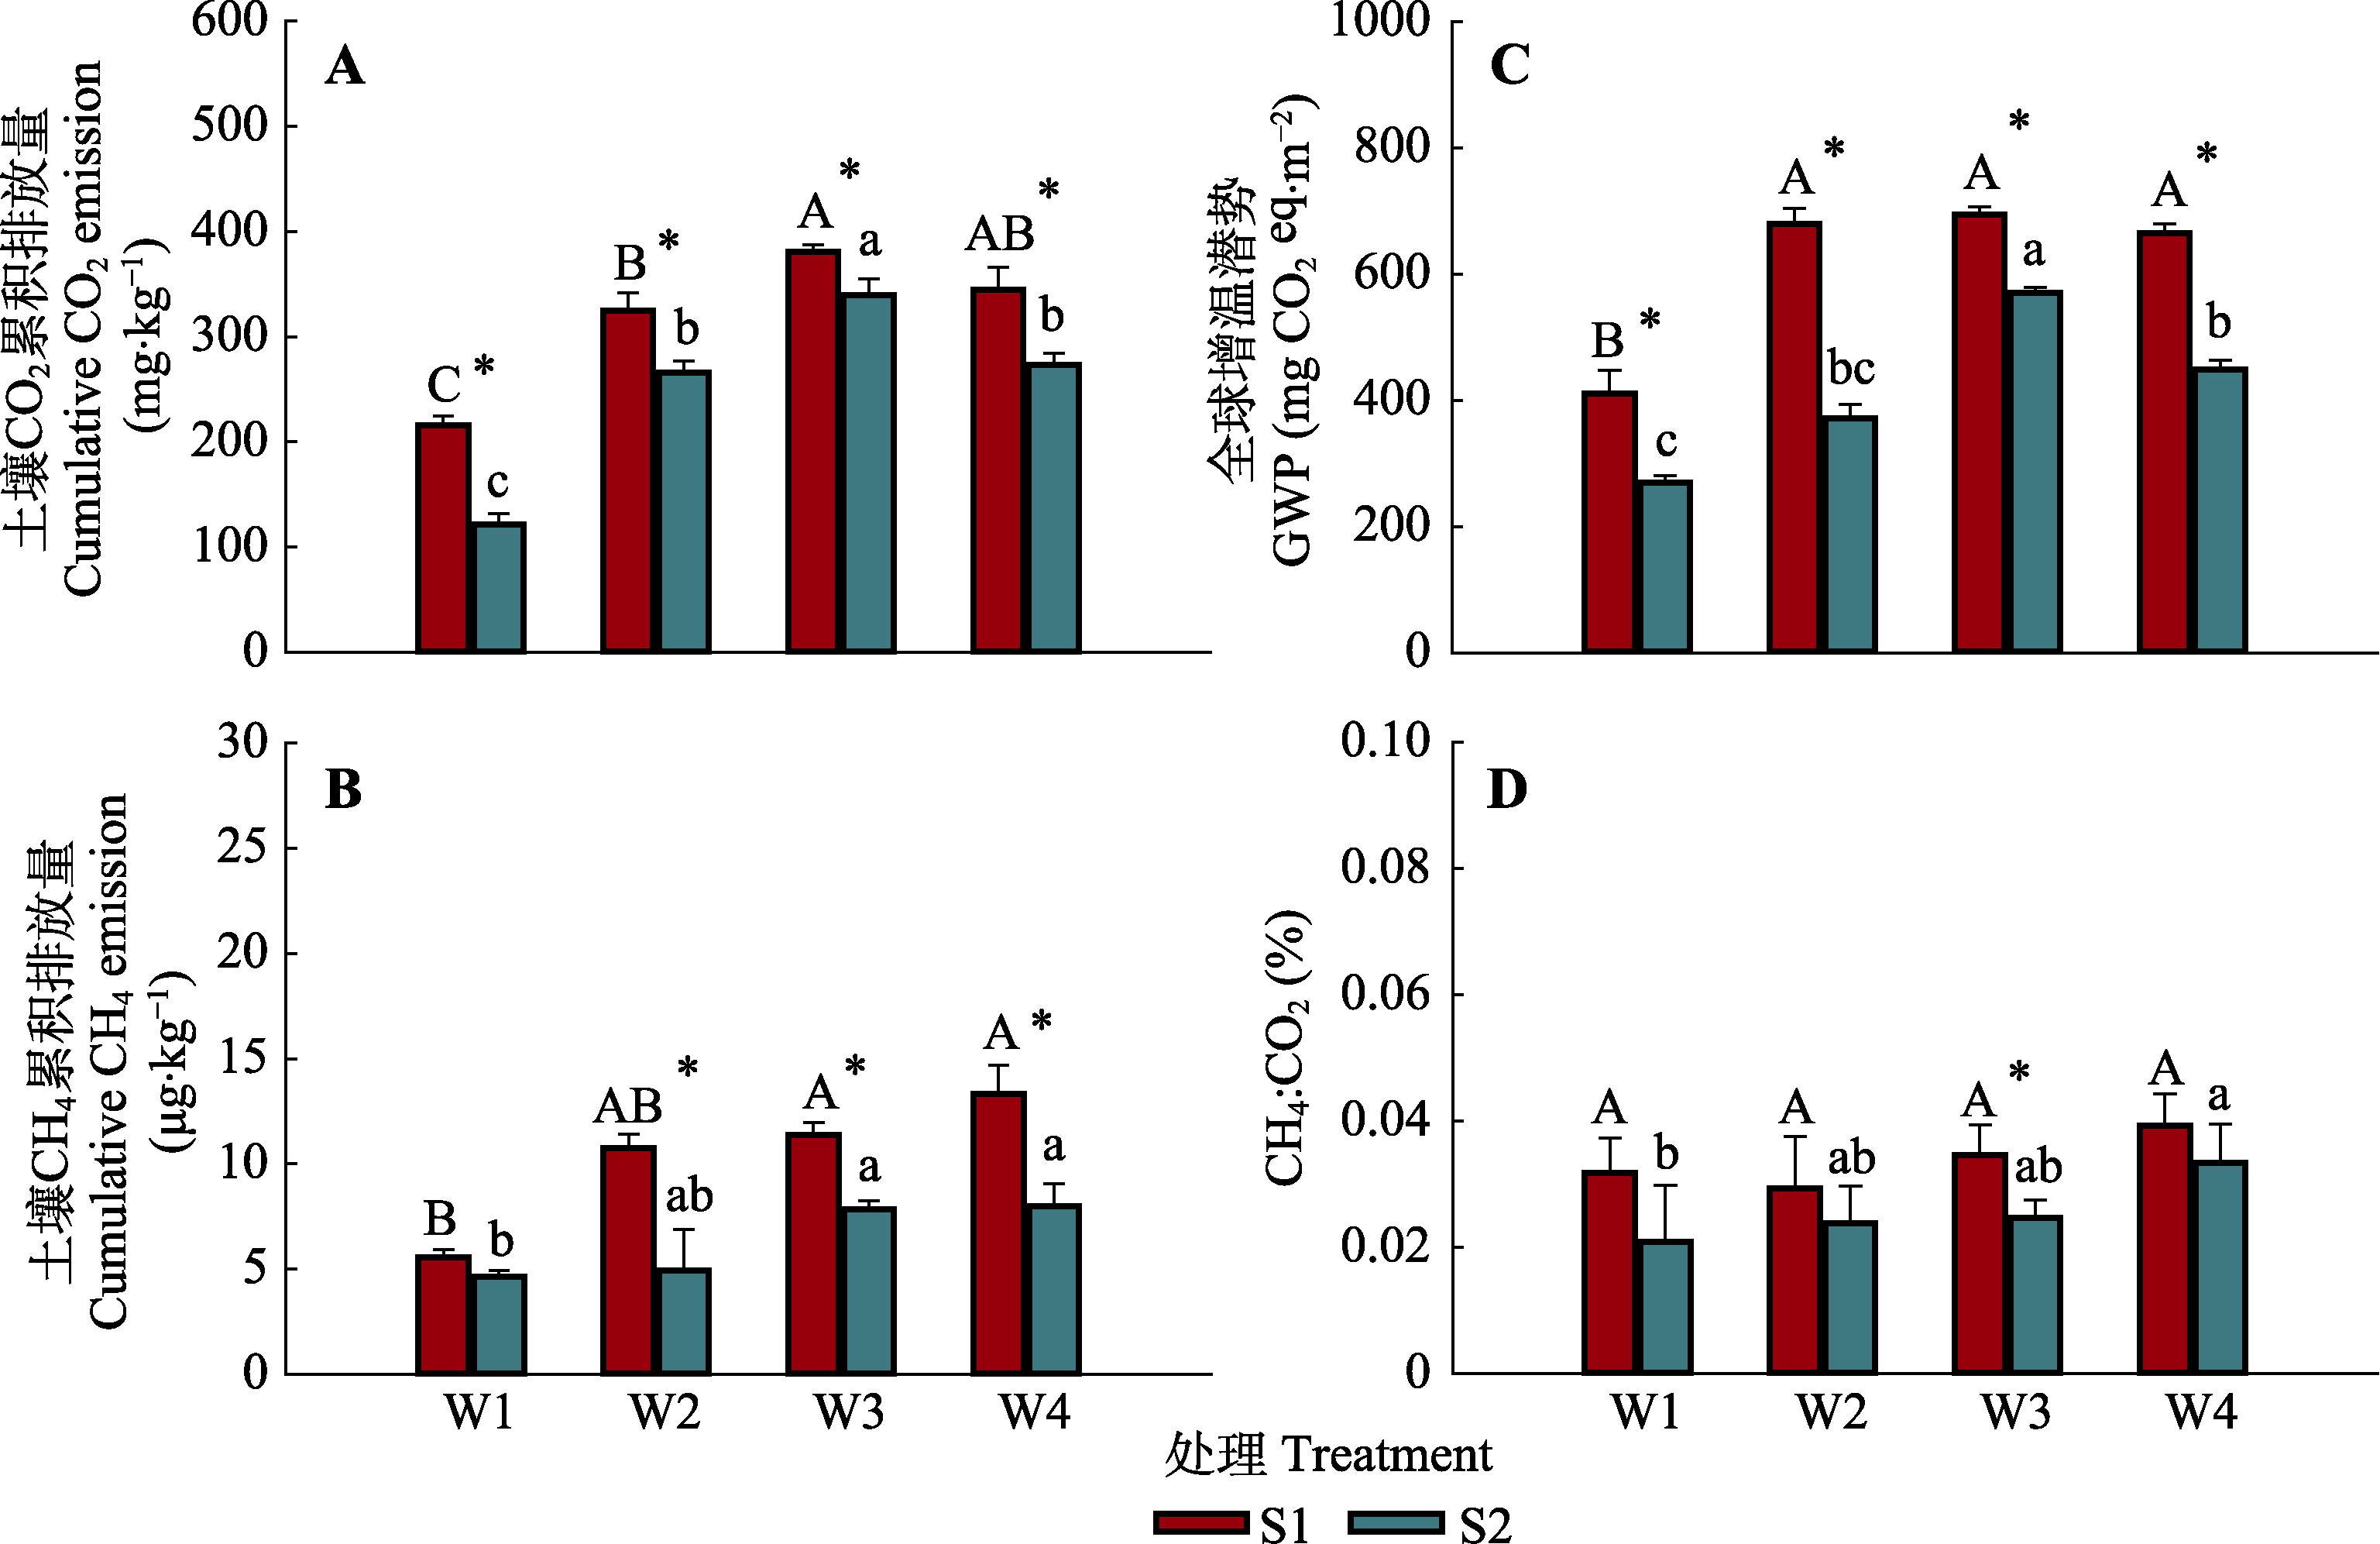
图4 不同水盐处理下土壤CO2累积排放量(A)、CH4累积排放量(B)、全球增温潜势(GWP) (C)及CH4:CO2通量比率(D)的变化(平均值±标准误)。不同大写字母表示在低盐分(S1)下水分处理间的差异显著(p < 0.05), 不同小写字母表示在高盐分(S2)下水分处理间的差异显著(p < 0.05), *表示相同水分下盐分处理间的差异显著(p < 0.05)。S1, 9 g·kg-1的土壤盐分; S2, 18 g·kg-1的土壤盐分; W1, 25%的土壤饱和含水量; W2, 50%的土壤饱和含水量; W3, 75%的土壤饱和含水量; W4, 100%的土壤饱和含水量。eq, 当量。
Fig. 4 Effects of soil moisture and salinity on values of soil cumulative CO2 emission (A) and soil cumulative CH4 emission (B), global warming potential (GWP) (C) and CH4:CO2 (D) (mean ± SE). Different uppercase letters indicate significant difference between soil moisture treatments under low salinity level (S1) (p < 0.05), different lowercase letters indicate significant difference between soil moisture treatments under high salinity level (S2) (p < 0.05), and * indicates significant difference between salinity treatments under the same moisture condition (p < 0.05). S1, 9 g·kg-1 soil salinity; S2, 18 g·kg-1 soil salinity; W1, 25% soil saturation moisture content; W2, 50% soil saturation moisture content; W3, 75% soil saturation moisture content; W4, 100% soil saturation moisture content. eq, equivalent.
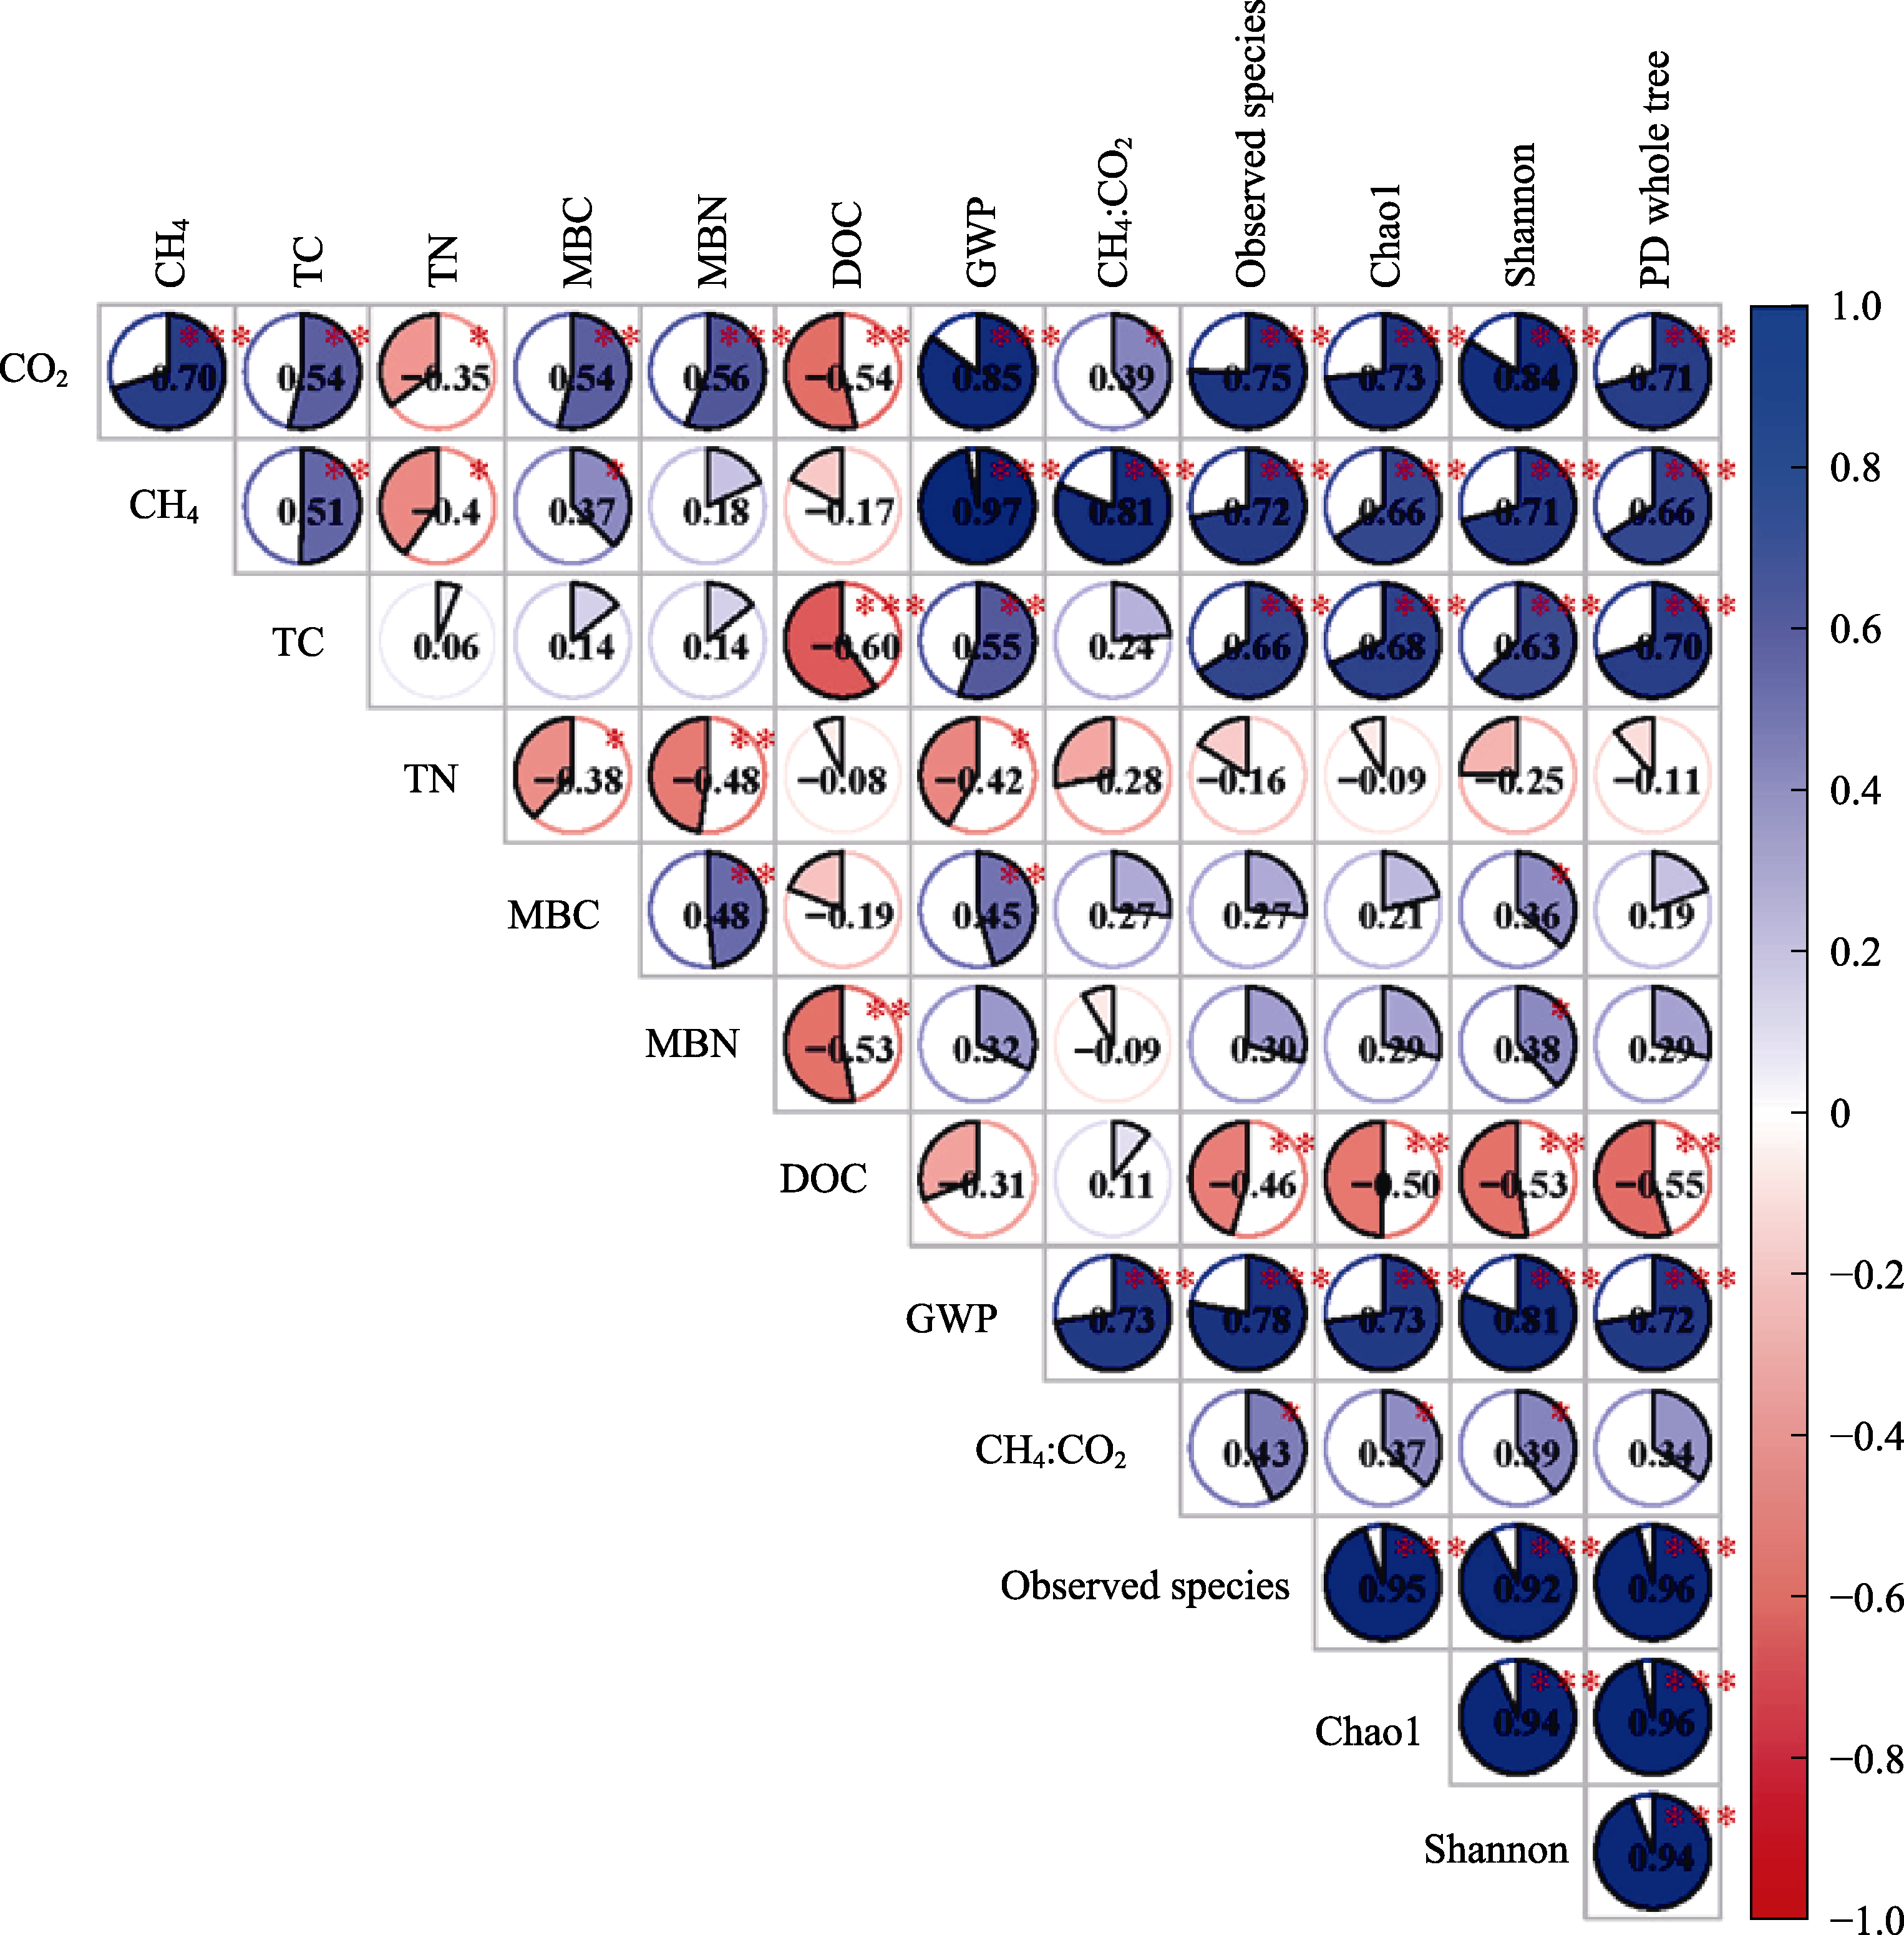
图5 土壤碳矿化速率与土壤理化性质、微生物特征之间的Pearson相关关系。*, p < 0.05; **, p < 0.01; ***, p < 0.001。CH4, 土壤CH4排放量; CH4:CO2, 土壤CH4与CO2通量比率; Chao1, Chao1指数; CO2, 土壤CO2排放量; DOC, 土壤可溶性有机碳含量; GWP, 全球增温潜势; MBC, 土壤微生物生物量碳含量; MBN, 土壤微生物生物量氮含量; Observed species, 物种数量; PD whole tree, PD whole tree指数; Shannon, Shannon-Wiener多样性指数; TC, 土壤总碳含量; TN, 土壤总氮含量。
Fig. 5 Pearson?s correlation between soil carbon mineralization rate and physical and chemical properties as well as microbial characteristics. *, p < 0.05; **, p < 0.01; ***, p < 0.001. CH4, soil CH4 emission; CH4:CO2, soil CH4 to CO2 ratio; Chao1, Chao1 index; CO2, soil CO2 emission; DOC, soil dissolved organic carbon content; GWP, global warming potential; MBC, soil microbial biomass carbon content; MBN, soil microbial biomass nitrogen content; PD whole tree, PD whole tree index; Shannon, Shannon-Wiener diversity index; TC, soil total carbon content; TN, soil total nitrogen content.
| [1] |
Bai JH, Zhang GL, Zhao QQ, Lu QQ, Jia J, Cui BS, Liu XH (2016). Depth-distribution patterns and control of soil organic carbon in coastal salt marshes with different plant covers. Scientific Reports, 6, 34835. DOI: 10.1038/srep34835.
DOI |
| [2] |
Baldwin DS, Rees GN, Mitchell AM, Watson G, Williams J (2006). The short-term effects of salinization on anaerobic nutrient cycling and microbial community structure in sediment from a freshwater wetland. Wetlands, 26, 455-464.
DOI URL |
| [3] |
Brockett BFT, Prescott CE, Grayston SJ (2012). Soil moisture is the major factor influencing microbial community structure and enzyme activities across seven biogeoclimatic zones in western Canada. Soil Biology & Biochemistry, 44, 9-20.
DOI URL |
| [4] |
Chi ZF, Hou LN, Li H, Li JL, Wu HT, Yan BX (2021). Elucidating the archaeal community and functional potential in two typical coastal wetlands with different stress patterns. Journal of Cleaner Production, 285, 124894. DOI: 10.1016/j.jclepro.2020.124894.
DOI |
| [5] |
Christiansen JR, Levy-Booth D, Prescott CE, Grayston SJ (2016). Microbial and environmental controls of methane fluxes along a soil moisture gradient in a Pacific coastal temperate rainforest. Ecosystems, 19, 1255-1270.
DOI URL |
| [6] |
Das S, Richards BK, Hanley KL, Krounbi L, Walter MF, Walter MT, Steenhuis TS, Lehmann J (2019). Lower mineralizability of soil carbon with higher legacy soil moisture. Soil Biology & Biochemistry, 130, 94-104.
DOI URL |
| [7] |
Davidson EA, Janssens IA (2006). Temperature sensitivity of soil carbon decomposition and feedbacks to climate change. Nature, 440, 165-173.
DOI |
| [8] |
Dinter T, Geihser S, Gube M, Daniel R, Kuzyakov Y (2019). Impact of sea level change on coastal soil organic matter, priming effects and prokaryotic community assembly. FEMS Microbiology Ecology, 95, fiz129. DOI: 10.1093/femsec/fiz129.
DOI |
| [9] |
Empadinhas N, da Costa MS (2008). Osmoadaptation mechanisms in prokaryotes: distribution of compatible solutes. International Microbiology, 11, 151-161.
PMID |
| [10] | Fang JY, Zhu JL, Wang SP, Yue C, Shen HH (2011). Global warming, carbon emissions and uncertainty. Scientia Sinica (Terrae), 41, 1385-1395. |
| [方精云, 朱江玲, 王少鹏, 岳超, 沈海花 (2011). 全球变暖、碳排放及不确定性. 中国科学: 地球科学, 41, 1385-1395.] | |
| [11] |
Fontaine S, Mariotti A, Abbadie L (2003). The priming effect of organic matter: a question of microbial competition? Soil Biology & Biochemistry, 35, 837-843.
DOI URL |
| [12] | Han GX, Sun BY, Chu XJ, Xing QH, Song WM, Xia JY (2018). Precipitation events reduce soil respiration in a coastal wetland based on four-year continuous field measurements. Agricultural and Forest Meteorology, 256- 257, 292-303. |
| [13] | He Q, Cui BS, Zhao XS, Fu HL, Liao XL (2009). Relationships between salt marsh vegetation distribution/diversity and soil chemical factors in the Yellow River Estuary, China. Acta Ecologica Sinica, 29, 676-687. |
| [贺强, 崔保山, 赵欣胜, 付华龄, 廖晓琳 (2009). 黄河河口盐沼植被分布、多样性与土壤化学因子的相关关系. 生态学报, 29, 676-687.] | |
| [14] |
Hoover DJ, Odigie KO, Swarzenski PW, Barnard P (2017). Sea-level rise and coastal groundwater inundation and shoaling at select sites in California, USA. Journal of Hydrology: Regional Studies, 11, 234-249.
DOI URL |
| [15] |
Ilstedt U, Nordgren A, Malmer A (2000). Optimum soil water for soil respiration before and after amendment with glucose in humid tropical acrisols and a boreal mor layer. Soil Biology & Biochemistry, 32, 1591-1599.
DOI URL |
| [16] | IPCC Intergovernmental Panel on Climate Change (2013). Climate Change 2013: the Physical Science Basis. Contributions of Working Group I to the Fifth Assessment Report of the Intergovernmental Panel on Climate Change. Cambridge University Press, Cambridge, UK. |
| [17] |
Joergensen RG (1996). The fumigation-extraction method to estimate soil microbial biomass: calibration of the kEC value. Soil Biology & Biochemistry, 28, 25-31.
DOI URL |
| [18] |
Jones CP, Grossl PR, Amacher MC, Boettinger JL, Jacobson AR, Lawley JR (2017). Selenium and salt mobilization in wetland and arid upland soils of Pariette Draw, Utah (USA). Geoderma, 305, 363-373.
DOI URL |
| [19] |
Kramer MG, Chadwick OA (2018). Climate-driven thresholds in reactive mineral retention of soil carbon at the global scale. Nature Climate Change, 8, 1104-1108.
DOI |
| [20] |
Le Mer J, Roger P (2001). Production, oxidation, emission and consumption of methane by soils: a review. European Journal of Soil Biology, 37, 25-50.
DOI URL |
| [21] | Lewis DB, Brown JA, Jimenez KL (2014). Effects of flooding and warming on soil organic matter mineralization in Avicennia germinans mangrove forests and Juncus roemerianus salt marshes. Estuarine, Coastal and Shelf Science, 139, 11-19. |
| [22] |
Li J, Cui L, Delgado-Baquerizo M, Wang J, Zhu Y, Wang R, Li W, Lei Y, Zhai X, Zhao X, Singh BK (2022). Fungi drive soil multifunctionality in the coastal salt marsh ecosystem. Science of the Total Environment, 818, 151673. DOI: 10.1016/j.scitotenv.2021.151673.
DOI |
| [23] | Li XG, Han GX, Zhu LQ, Sun BY, Jiang M, Song WM, Lu F (2019). Effects of changes in precipitation on soil respiration in coastal wetlands of the Yellow River Delta. Acta Ecologica Sinica, 39, 4806-4820. |
| [李新鸽, 韩广轩, 朱连奇, 孙宝玉, 姜铭, 宋维民, 路峰 (2019). 降雨量改变对黄河三角洲滨海湿地土壤呼吸的影响. 生态学报, 39, 4806-4820.] | |
| [24] |
Mavi MS, Marschner P, Chittleborough DJ, Cox JW, Sanderman J (2012). Salinity and sodicity affect soil respiration and dissolved organic matter dynamics differentially in soils varying in texture. Soil Biology & Biochemistry, 45, 8-13.
DOI URL |
| [25] |
McDaniel MD, Grandy AS, Tiemann LK, Weintraub MN (2014). Crop rotation complexity regulates the decomposition of high and low quality residues. Soil Biology & Biochemistry, 78, 243-254.
DOI URL |
| [26] |
McLeod E, Chmura GL, Bouillon S, Salm R, Björk M, Duarte CM, Lovelock CE, Schlesinger WH, Silliman BR (2011). A blueprint for blue carbon: toward an improved understanding of the role of vegetated coastal habitats in sequestering CO2. Frontiers in Ecology and the Environment, 9, 552-560.
DOI URL |
| [27] |
Poffenbarger HJ, Needelman BA, Megonigal JP (2011). Salinity influence on methane emissions from tidal marshes. Wetlands, 31, 831-842.
DOI URL |
| [28] |
Rath KM, Maheshwari A, Bengtson P, Rousk J (2016). Comparative toxicities of salts on microbial processes in soil. Applied and Environmental Microbiology, 82, 2012-2020.
DOI PMID |
| [29] |
Rath KM, Rousk J (2015). Salt effects on the soil microbial decomposer community and their role in organic carbon cycling: a review. Soil Biology & Biochemistry, 81, 108-123.
DOI URL |
| [30] |
Schjønning P, Thomsen IK, Moldrup P, Christensen BT (2003). Linking soil microbial activity to water- and air-phase contents and diffusivities. Soil Science Society of America Journal, 67, 156-165.
DOI URL |
| [31] |
Setia R, Marschner P, Baldock J, Chittleborough D, Smith P, Smith J (2011). Salinity effects on carbon mineralization in soils of varying texture. Soil Biology & Biochemistry, 43, 1908-1916.
DOI URL |
| [32] |
Tollefson J (2022). Scientists raise alarm over “dangerously fast” growth in atmospheric methane. Nature. DOI: 10.1038/d41586-022-00312-2.
DOI |
| [33] |
Ury EA, Wright JP, Ardón M, Bernhardt ES (2022). Saltwater intrusion in context: soil factors regulate impacts of salinity on soil carbon cycling. Biogeochemistry, 157, 215-226.
DOI |
| [34] |
Vizza C, West WE, Jones SE, Hart JA, Lamberti GA (2017). Regulators of coastal wetland methane production and responses to simulated global change. Biogeosciences, 14, 431-446.
DOI URL |
| [35] |
Wagner D (2017). Effect of varying soil water potentials on methanogenesis in aerated marshland soils. Scientific Reports, 7, 14706. DOI: 10.1038/s41598-017-14980-y.
DOI |
| [36] | Wang J, Yuan JJ, Liu DY, Xiang J, Ding WX, Jiang XJ (2016). Research progresses on methanogenesis pathway and methanogens in coastal wetlands. Chinese Journal of Applied Ecology, 27, 993-1001. |
|
[王洁, 袁俊吉, 刘德燕, 项剑, 丁维新, 蒋先军 (2016). 滨海湿地甲烷产生途径和产甲烷菌研究进展. 应用生态学报, 27, 993-1001.]
DOI |
|
| [37] | Wang ZY, Xin YZ, Li FM, Gao DM (2009). Microbial community characteristics in a degraded wetland of the Yellow River Delta. Periodical of Ocean University of China, 39, 1005-1012. |
| [王震宇, 辛远征, 李锋民, 高冬梅 (2009). 黄河三角洲退化湿地微生物特性的研究. 中国海洋大学学报(自然科学版), 39, 1005-1012.] | |
| [38] |
Wong VNL, Greene RSB, Dalal RC, Murphy BW (2010). Soil carbon dynamics in saline and sodic soils: a review. Soil Use and Management, 26, 2-11.
DOI URL |
| [39] |
Xi XF, Wang L, Hu JJ, Tang YS, Hu Y, Fu XH, Sun Y, Tsang YF, Zhang YN, Chen JH (2014). Salinity influence on soil microbial respiration rate of wetland in the Yangtze River estuary through changing microbial community. Journal of Environmental Sciences, 26, 2562-2570.
DOI URL |
| [40] | Yu JB, Wang YL, Dong HF, Wang XH, Li YZ, Zhou D, Gao YJ (2013). Estimation of soil organic carbon storage in coastal wetlands of modern Yellow River Delta based on landscape pattern. Wetland Science, 11, 1-6. |
| [于君宝, 王永丽, 董洪芳, 王雪宏, 栗云召, 周迪, 高永军 (2013). 基于景观格局的现代黄河三角洲滨海湿地土壤有机碳储量估算. 湿地科学, 11, 1-6.] | |
| [41] |
Zhang LH, Song LP, Wang BC, Shao HB, Zhang LW, Qin XC (2018). Co-effects of salinity and moisture on CO2and N2O emissions of laboratory-incubated salt-affected soils from different vegetation types. Geoderma, 332, 109-120.
DOI URL |
| [42] | Zhang ZC, Yang P, Tong C (2015). Effects of seawater and NaCl solution pulses on methane production potential from laboratory-incubated tidal freshwater and brackish marsh soil. Acta Ecologica Sinica, 35, 8075-8084. |
| [张子川, 杨平, 仝川 (2015). 盐分对河口淡水、微咸水沼泽湿地土壤甲烷产生潜力的影响. 生态学报, 35, 8075-8084.] | |
| [43] |
Zhao QQ, Bai JH, Zhang GL, Jia J, Wang W, Wang X (2018). Effects of water and salinity regulation measures on soil carbon sequestration in coastal wetlands of the Yellow River Delta. Geoderma, 319, 219-229.
DOI URL |
| [1] | 沈健, 何宗明, 董强, 郜士垒, 林宇. 轻度火烧对滨海沙地人工林土壤呼吸速率和非生物因子的影响[J]. 植物生态学报, 2023, 47(7): 1032-1042. |
| [2] | 李冠军, 陈珑, 余雯静, 苏亲桂, 吴承祯, 苏军, 李键. 固体培养内生真菌对土壤盐胁迫下木麻黄幼苗渗透调节和抗氧化系统的影响[J]. 植物生态学报, 2023, 47(6): 804-821. |
| [3] | 韩广轩, 王法明, 马俊, 肖雷雷, 初小静, 赵明亮. 滨海盐沼湿地蓝色碳汇功能、形成机制及其增汇潜力[J]. 植物生态学报, 2022, 46(4): 373-382. |
| [4] | 韩广轩, 李隽永, 屈文笛. 氮输入对滨海盐沼湿地碳循环关键过程的影响及机制[J]. 植物生态学报, 2021, 45(4): 321-333. |
| [5] | 李建军, 刘恋, 陈迪马, 许丰伟, 程军回, 白永飞. 底座入土深度和面积对典型草原土壤呼吸测定结果的影响[J]. 植物生态学报, 2019, 43(2): 152-164. |
| [6] | 王祥, 朱亚琼, 郑伟, 关正翾, 盛建东. 昭苏山地草甸4种典型土地利用方式下的土壤呼吸特征[J]. 植物生态学报, 2018, 42(3): 382-396. |
| [7] | 柴曦, 李英年, 段呈, 张涛, 宗宁, 石培礼, 何永涛, 张宪洲. 青藏高原高寒灌丛草甸和草原化草甸CO2通量动态及其限制因子[J]. 植物生态学报, 2018, 42(1): 6-19. |
| [8] | 朱志成, 黄银, 许丰伟, 邢稳, 郑淑霞, 白永飞. 降雨强度和时间频次对内蒙古典型草原土壤氮矿化的影响[J]. 植物生态学报, 2017, 41(9): 938-952. |
| [9] | 葛晓改, 周本智, 肖文发, 王小明, 曹永慧, 叶明. 生物质炭添加对毛竹林土壤呼吸动态和温度敏感性的影响[J]. 植物生态学报, 2017, 41(11): 1177-1189. |
| [10] | 张蔷, 李家湘, 谢宗强. 氮添加对亚热带山地杜鹃灌丛土壤呼吸的影响[J]. 植物生态学报, 2017, 41(1): 95-104. |
| [11] | 孔庆仙, 夏江宝, 赵自国, 屈凡柱. 不同地下水矿化度对柽柳光合特征及树干液流的影响[J]. 植物生态学报, 2016, 40(12): 1298-1309. |
| [12] | 孙宝玉, 韩广轩, 陈亮, 初小静, 邢庆会, 吴立新, 朱书玉. 模拟增温对黄河三角洲滨海湿地非生长季土壤呼吸的影响[J]. 植物生态学报, 2016, 40(11): 1111-1123. |
| [13] | 许洺山, 黄海侠, 史青茹, 杨晓东, 周刘丽, 赵延涛, 张晴晴, 阎恩荣. 浙东常绿阔叶林植物功能性状对土壤含水量变化的响应[J]. 植物生态学报, 2015, 39(9): 857-866. |
| [14] | 丁文慧, 姜俊彦, 李秀珍, 黄星, 李希之, 周云轩, 汤臣栋. 崇明东滩南部盐沼植被空间分布及影响因素分析[J]. 植物生态学报, 2015, 39(7): 704-716. |
| [15] | 陈清, 王义东, 郭长城, 王中良. 天津沼泽湿地芦苇叶片的碳稳定同位素比值分布特征及其环境影响因素[J]. 植物生态学报, 2015, 39(11): 1044-1052. |
| 阅读次数 | ||||||
|
全文 |
|
|||||
|
摘要 |
|
|||||
Copyright © 2026 版权所有 《植物生态学报》编辑部
地址: 北京香山南辛村20号, 邮编: 100093
Tel.: 010-62836134, 62836138; Fax: 010-82599431; E-mail: apes@ibcas.ac.cn, cjpe@ibcas.ac.cn
备案号: 京ICP备16067583号-19
![]()