
Chin J Plant Ecol ›› 2010, Vol. 34 ›› Issue (3): 316-329.DOI: 10.3773/j.issn.1005-264x.2010.03.009
• Research Articles • Previous Articles Next Articles
YU Zhen1, SUN Peng-Sen1,*( ), LIU Shi-Rong2
Received:2009-07-14
Accepted:2009-09-12
Online:2010-07-14
Published:2010-03-01
Contact:
SUN Peng-Sen
YU Zhen, SUN Peng-Sen, LIU Shi-Rong. Phenological change of main vegetation types along a North-South Transect of Eastern China[J]. Chin J Plant Ecol, 2010, 34(3): 316-329.
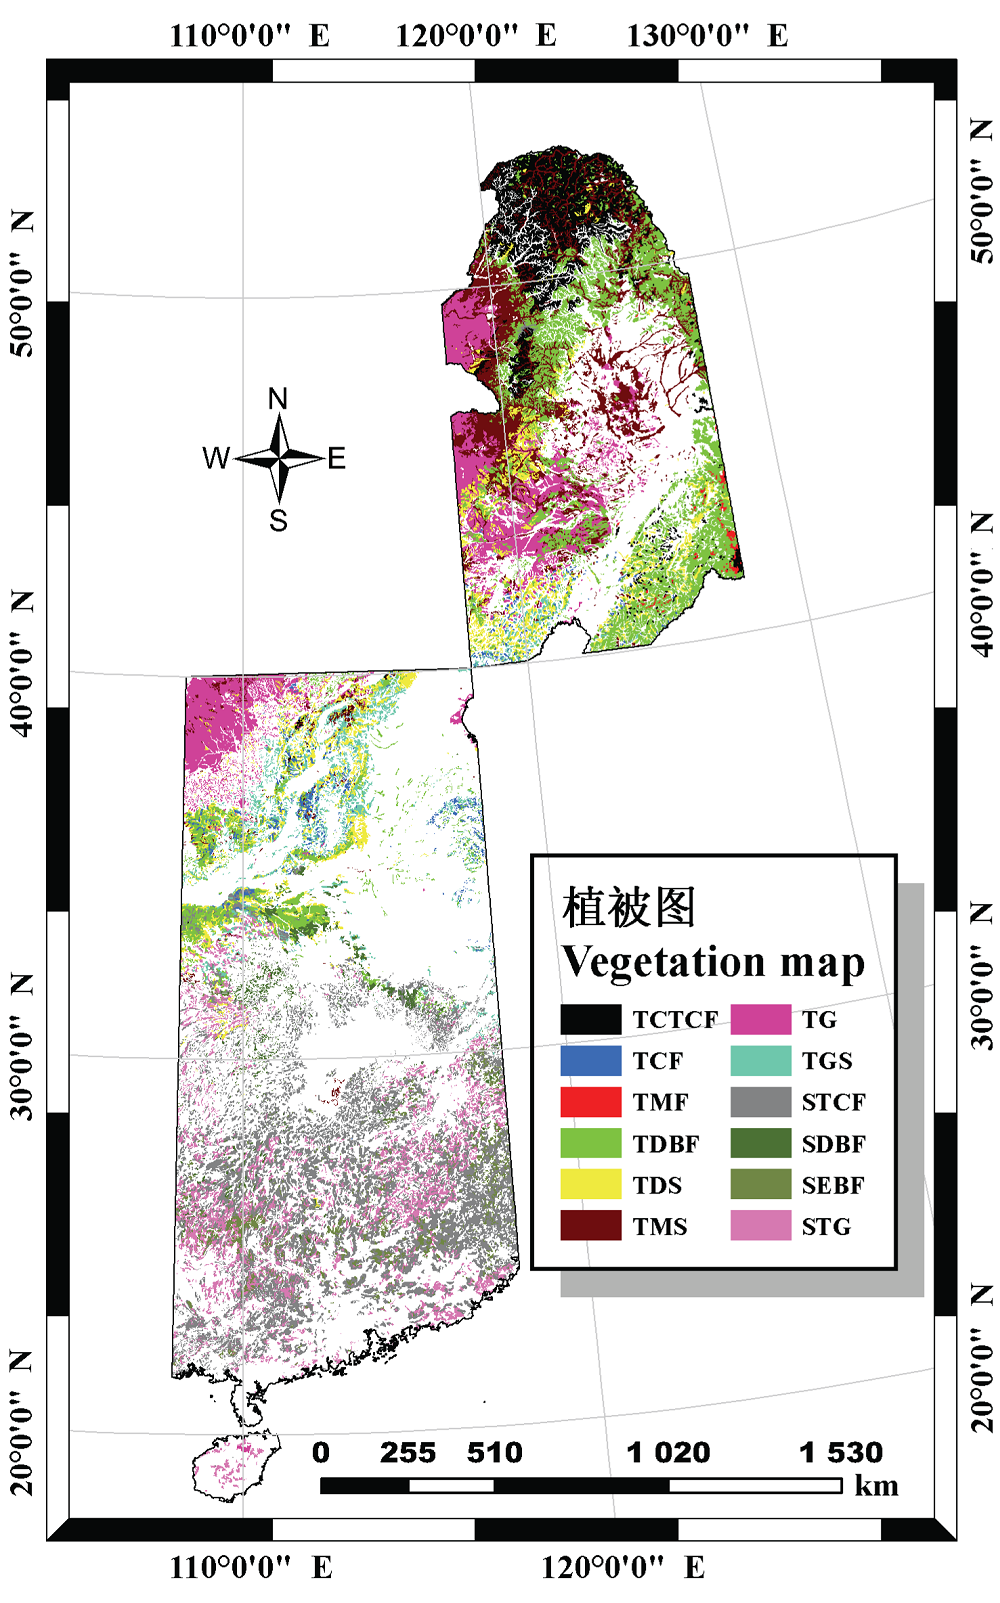
Fig. 1 Vegetation types and distribution in North-South Transect of Eastern China (NSTEC). TCTCF, temperate and cold temperate coniferous forest; TCF, temperate coniferous forest; TMF, temperate mixed forest; TDBF, temperate deciduous-broadleaved forest; TDS, temperate deciduous shrubland; TMS, temperate meadow steppe; TG, temperate grassland; TGS, temperate grass steppe; STCF, subtropical and tropical coniferous forest; SDBF, subtropical deciduous-broadleaved forest; SEBF, subtropical evergreen-broadleaved forest; STG, subtropical and tropical grassland.
| 月 Month | 植被类型 Vegetation type | |||||||||||
|---|---|---|---|---|---|---|---|---|---|---|---|---|
| TCTCF | TCF | TMF | TDBF | TDS | TMS | TGS | TG | STCF | STG | SDBF | SEBF | |
| 1 | 0.3 | 1.0 | 1.4 | 1.3 | 1.1 | 0.7 | 0.8 | 1.9 | 1.4 | 1.3 | 0.3 | 1.3 |
| 2 | 1.5 | 3.5** | 2.2* | 2.0* | 2.8** | 1.8 | 2.7** | 3.6** | 3.0** | 2.1* | 2.9** | 2.0* |
| 3 | 1.1 | 3.7** | 1.3 | 1.0 | 2.0* | 0.8 | 1.7 | 3.3** | 3.4** | 2.8** | 3.4** | 2.0* |
| 4 | 0.4 | 2.2* | 1.3 | 0.9 | 1.5 | 1.5 | 1.8 | 2.2* | 1.9 | 2.6** | 2.2* | 2.7** |
| 5 | 0.5 | 1.6 | 1.3 | 1.3 | 2.0* | 1.4 | 2.0* | 2.0* | 0.8 | 0.9 | 1.0 | 1.5 |
| 6 | 0.4 | 3.1** | 3.0** | 1.7 | 2.4* | 1.5 | 2.5** | 3.1** | 3.3** | 2.0* | 3.3** | 0.8 |
| 7 | 2.5** | 3.1** | 3.1** | 2.1* | 2.8** | 2.9 | 3.6** | 3.0** | 3.5** | 1.7 | 2.4* | 0.1 |
| 8 | 1.3 | 1.7 | -0.3 | -0.7 | 0.7 | 1.8 | 2.2* | 1.5** | 0.4 | 0.6 | -0.2 | 0.1 |
| 9 | 1.4 | 1.7 | 3.2** | 3.1** | 3.1** | 3.3 | 3.5** | 2.6** | 1.7 | 1.8 | 1.5 | 0.8 |
| 10 | 1.1 | 0.4 | 1.5 | 1.0 | 1.1 | 1.5 | 0.9 | 1.2 | 0.4 | 0.5 | 0.7 | 0.6 |
| 11 | -0.6 | 1.8 | 1.1 | 0.7 | 0.8 | -0.3 | 0.5 | 1.9 | 1.4 | 1.6 | 0.7 | 2.0* |
| 12 | -0.6 | 1.3 | -0.3 | -0.4 | -0.2 | -1.5 | -0.2 | 1.5 | 0.9 | 0.9 | 0.6 | 0.8 |
| 年 Annual | 1.1 | 4.0** | 2.7** | 4.2** | 4.1** | 3.7** | 2.6** | 3.5** | 3.5** | 3.7** | 4.1** | 3.7** |
Table 1 Mann-Kendall Tests of data series of temperature in different types of vegetation from 1982 to 2006
| 月 Month | 植被类型 Vegetation type | |||||||||||
|---|---|---|---|---|---|---|---|---|---|---|---|---|
| TCTCF | TCF | TMF | TDBF | TDS | TMS | TGS | TG | STCF | STG | SDBF | SEBF | |
| 1 | 0.3 | 1.0 | 1.4 | 1.3 | 1.1 | 0.7 | 0.8 | 1.9 | 1.4 | 1.3 | 0.3 | 1.3 |
| 2 | 1.5 | 3.5** | 2.2* | 2.0* | 2.8** | 1.8 | 2.7** | 3.6** | 3.0** | 2.1* | 2.9** | 2.0* |
| 3 | 1.1 | 3.7** | 1.3 | 1.0 | 2.0* | 0.8 | 1.7 | 3.3** | 3.4** | 2.8** | 3.4** | 2.0* |
| 4 | 0.4 | 2.2* | 1.3 | 0.9 | 1.5 | 1.5 | 1.8 | 2.2* | 1.9 | 2.6** | 2.2* | 2.7** |
| 5 | 0.5 | 1.6 | 1.3 | 1.3 | 2.0* | 1.4 | 2.0* | 2.0* | 0.8 | 0.9 | 1.0 | 1.5 |
| 6 | 0.4 | 3.1** | 3.0** | 1.7 | 2.4* | 1.5 | 2.5** | 3.1** | 3.3** | 2.0* | 3.3** | 0.8 |
| 7 | 2.5** | 3.1** | 3.1** | 2.1* | 2.8** | 2.9 | 3.6** | 3.0** | 3.5** | 1.7 | 2.4* | 0.1 |
| 8 | 1.3 | 1.7 | -0.3 | -0.7 | 0.7 | 1.8 | 2.2* | 1.5** | 0.4 | 0.6 | -0.2 | 0.1 |
| 9 | 1.4 | 1.7 | 3.2** | 3.1** | 3.1** | 3.3 | 3.5** | 2.6** | 1.7 | 1.8 | 1.5 | 0.8 |
| 10 | 1.1 | 0.4 | 1.5 | 1.0 | 1.1 | 1.5 | 0.9 | 1.2 | 0.4 | 0.5 | 0.7 | 0.6 |
| 11 | -0.6 | 1.8 | 1.1 | 0.7 | 0.8 | -0.3 | 0.5 | 1.9 | 1.4 | 1.6 | 0.7 | 2.0* |
| 12 | -0.6 | 1.3 | -0.3 | -0.4 | -0.2 | -1.5 | -0.2 | 1.5 | 0.9 | 0.9 | 0.6 | 0.8 |
| 年 Annual | 1.1 | 4.0** | 2.7** | 4.2** | 4.1** | 3.7** | 2.6** | 3.5** | 3.5** | 3.7** | 4.1** | 3.7** |
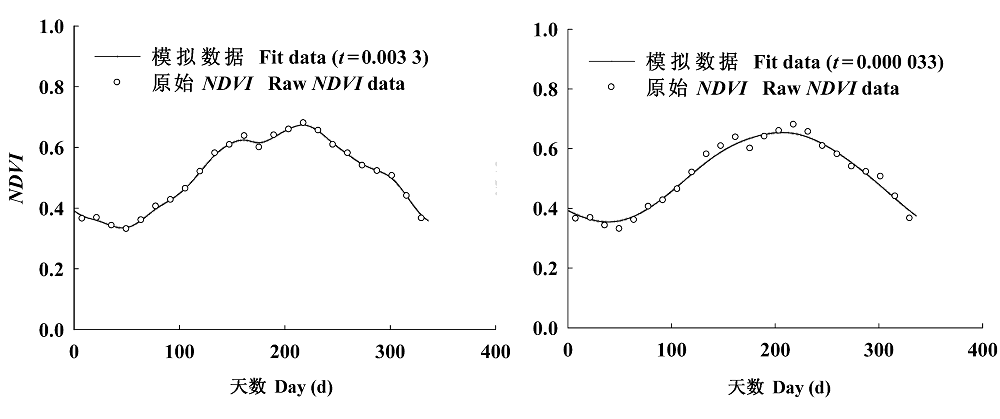
Fig. 2 Simulation of phonological curve by smooth spline. NDVI, Normalized Difference Vegetation Index.
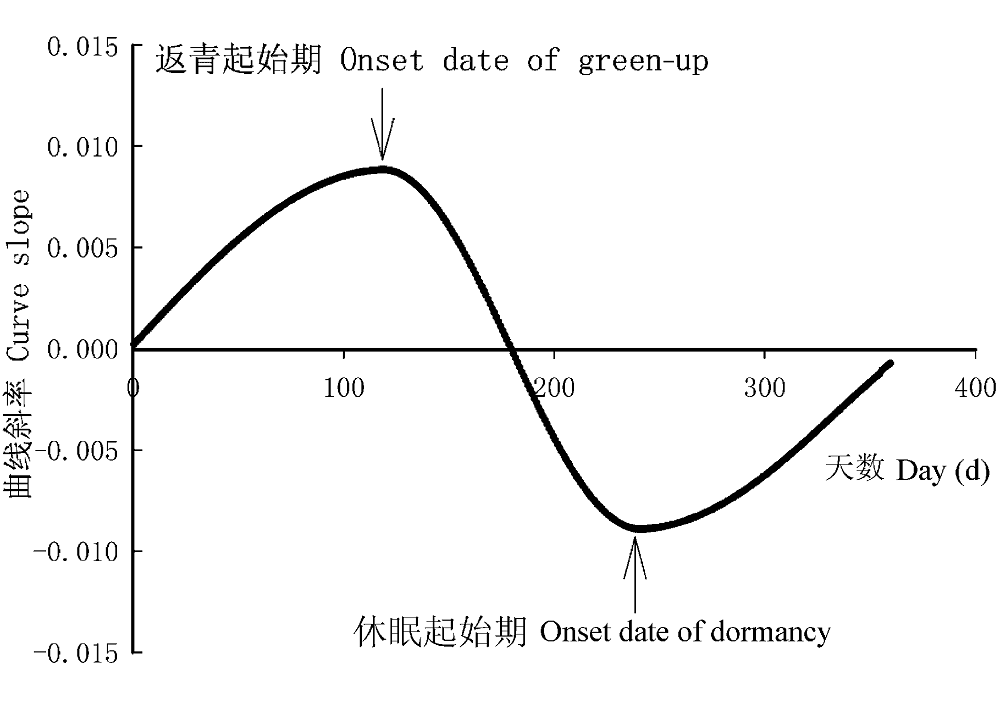
Fig. 3 Identifying the onset dates of vegetation green-up and dormancy by the greatest change slope method.
| 月 Month | 植被类型 Vegetation type | |||||||||||
|---|---|---|---|---|---|---|---|---|---|---|---|---|
| TCTCF | TCF | TMF | TDBF | TDS | TMS | TGS | TG | STCF | STG | SDBF | SEBF | |
| 1 | -0.3 | 0.8 | 0.0 | 0.4 | 0.0 | 1.0 | 0.9 | 0.7 | 0.0 | 1.0 | 0.5 | 0.4 |
| 2 | 0.1 | 0.8 | -0.8 | -1.3 | -0.3 | -0.5 | -0.1 | 0.1 | 0.8 | -1.9 | 0.7 | -1.3 |
| 3 | 0.2 | -2.5** | 0.0 | 1.1 | -1.5 | 0.8 | -0.9 | -2.2* | -2.2* | 0.3 | -1.2 | -1.3 |
| 4 | -0.2 | 0.1 | -0.8 | -0.7 | -0.4 | 0.4 | 0.2 | 0.1 | -0.7 | -0.5 | 0.6 | 0.0 |
| 5 | 0.5 | -1.7 | 0.0 | -0.5 | -1.4 | -0.6 | -0.4 | -1.1 | -0.6 | 1.4 | -0.9 | 0.4 |
| 6 | -0.5 | 0.5 | -0.7 | -0.3 | 0.6 | -0.9 | -0.7 | 0.7 | -0.6 | 1.4 | 0.5 | 1.8 |
| 7 | -1.0 | -0.3 | -0.7 | -0.2 | -0.5 | -1.0 | -1.4 | -0.7 | -1.0 | 0.7 | 0.7 | 2.1* |
| 8 | -2.7** | -0.4 | -1.4 | -0.9 | -1.6 | -1.8 | -1.9 | -0.7 | -0.8 | 0.5 | -0.2 | 1.1 |
| 9 | -1.5 | 0.1 | -2.4* | -2.6** | -2.8** | -2.6** | -1.7 | -0.8 | -1.0 | -2.0* | -0.4 | -2.3* |
| 10 | 0.3 | -0.6 | 0.9 | 1.3 | 0.6 | 0.5 | -0.1 | -0.2 | 0.1 | -0.4 | -0.6 | -1.3 |
| 11 | 0.4 | -0.6 | -0.7 | -0.3 | -0.4 | 0.0 | 0.1 | -0.2 | -1.4 | -1.3 | -0.3 | 0.5 |
| 12 | 0.5 | 0.5 | -0.2 | 0.3 | 0.6 | 0.8 | 1.1 | 0.3 | 0.1 | 1.1 | 0.6 | -0.3 |
| 年 Annual | -2.2* | -1.7 | -2.1* | -1.3 | -2.2* | -2.2* | -1.1 | -2.4* | 0.9 | 0.2 | -2.1* | -0.8 |
Table 2 Mann-Kendall Tests of data series of precipitation in different types of vegetation from 1982 to 2006
| 月 Month | 植被类型 Vegetation type | |||||||||||
|---|---|---|---|---|---|---|---|---|---|---|---|---|
| TCTCF | TCF | TMF | TDBF | TDS | TMS | TGS | TG | STCF | STG | SDBF | SEBF | |
| 1 | -0.3 | 0.8 | 0.0 | 0.4 | 0.0 | 1.0 | 0.9 | 0.7 | 0.0 | 1.0 | 0.5 | 0.4 |
| 2 | 0.1 | 0.8 | -0.8 | -1.3 | -0.3 | -0.5 | -0.1 | 0.1 | 0.8 | -1.9 | 0.7 | -1.3 |
| 3 | 0.2 | -2.5** | 0.0 | 1.1 | -1.5 | 0.8 | -0.9 | -2.2* | -2.2* | 0.3 | -1.2 | -1.3 |
| 4 | -0.2 | 0.1 | -0.8 | -0.7 | -0.4 | 0.4 | 0.2 | 0.1 | -0.7 | -0.5 | 0.6 | 0.0 |
| 5 | 0.5 | -1.7 | 0.0 | -0.5 | -1.4 | -0.6 | -0.4 | -1.1 | -0.6 | 1.4 | -0.9 | 0.4 |
| 6 | -0.5 | 0.5 | -0.7 | -0.3 | 0.6 | -0.9 | -0.7 | 0.7 | -0.6 | 1.4 | 0.5 | 1.8 |
| 7 | -1.0 | -0.3 | -0.7 | -0.2 | -0.5 | -1.0 | -1.4 | -0.7 | -1.0 | 0.7 | 0.7 | 2.1* |
| 8 | -2.7** | -0.4 | -1.4 | -0.9 | -1.6 | -1.8 | -1.9 | -0.7 | -0.8 | 0.5 | -0.2 | 1.1 |
| 9 | -1.5 | 0.1 | -2.4* | -2.6** | -2.8** | -2.6** | -1.7 | -0.8 | -1.0 | -2.0* | -0.4 | -2.3* |
| 10 | 0.3 | -0.6 | 0.9 | 1.3 | 0.6 | 0.5 | -0.1 | -0.2 | 0.1 | -0.4 | -0.6 | -1.3 |
| 11 | 0.4 | -0.6 | -0.7 | -0.3 | -0.4 | 0.0 | 0.1 | -0.2 | -1.4 | -1.3 | -0.3 | 0.5 |
| 12 | 0.5 | 0.5 | -0.2 | 0.3 | 0.6 | 0.8 | 1.1 | 0.3 | 0.1 | 1.1 | 0.6 | -0.3 |
| 年 Annual | -2.2* | -1.7 | -2.1* | -1.3 | -2.2* | -2.2* | -1.1 | -2.4* | 0.9 | 0.2 | -2.1* | -0.8 |
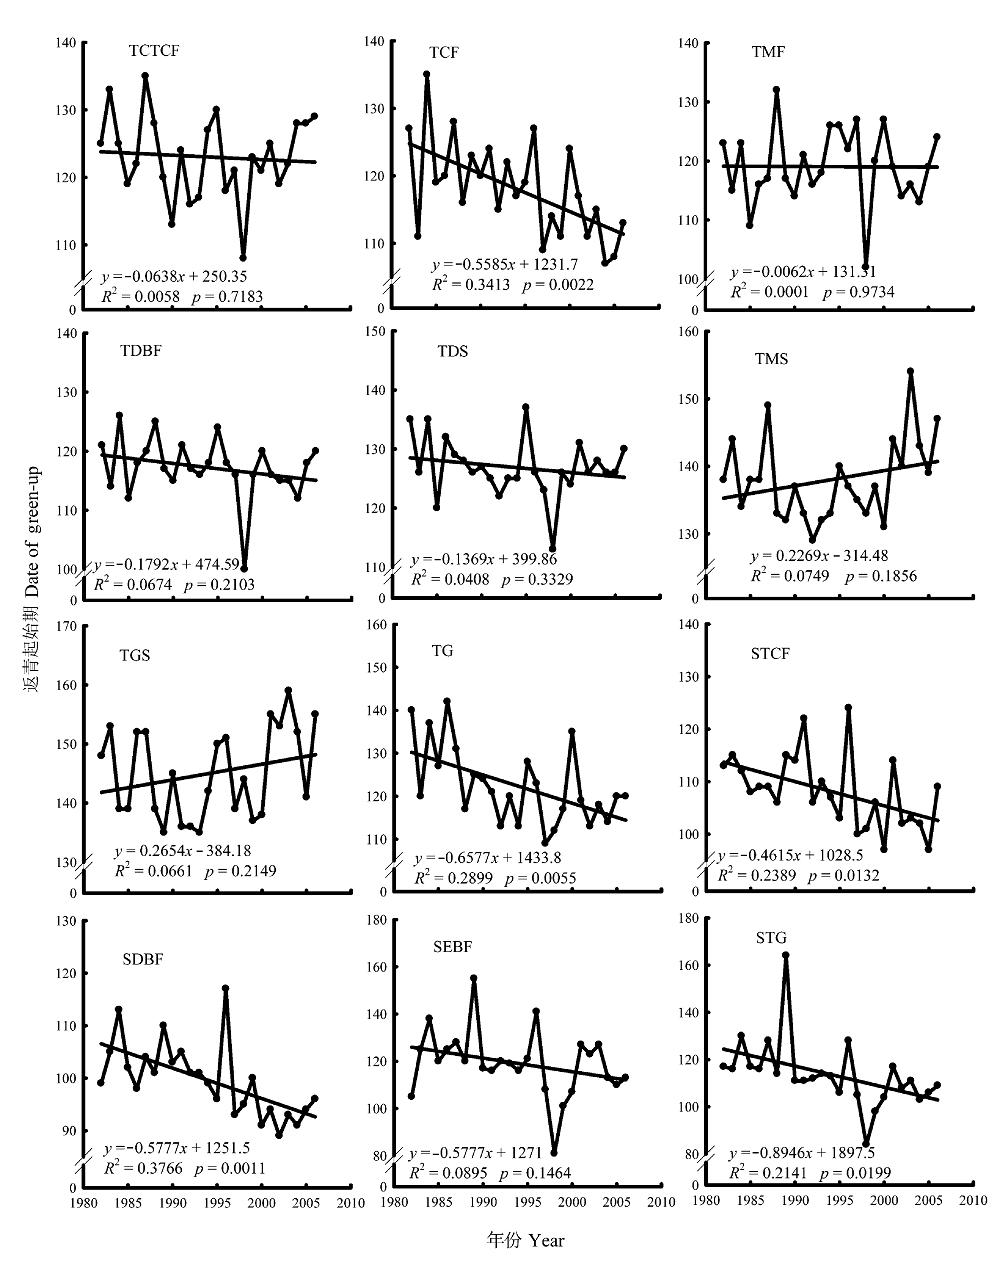
Fig. 4 Trend of onset dates of different vegetation green-up. Notes see Fig.1.
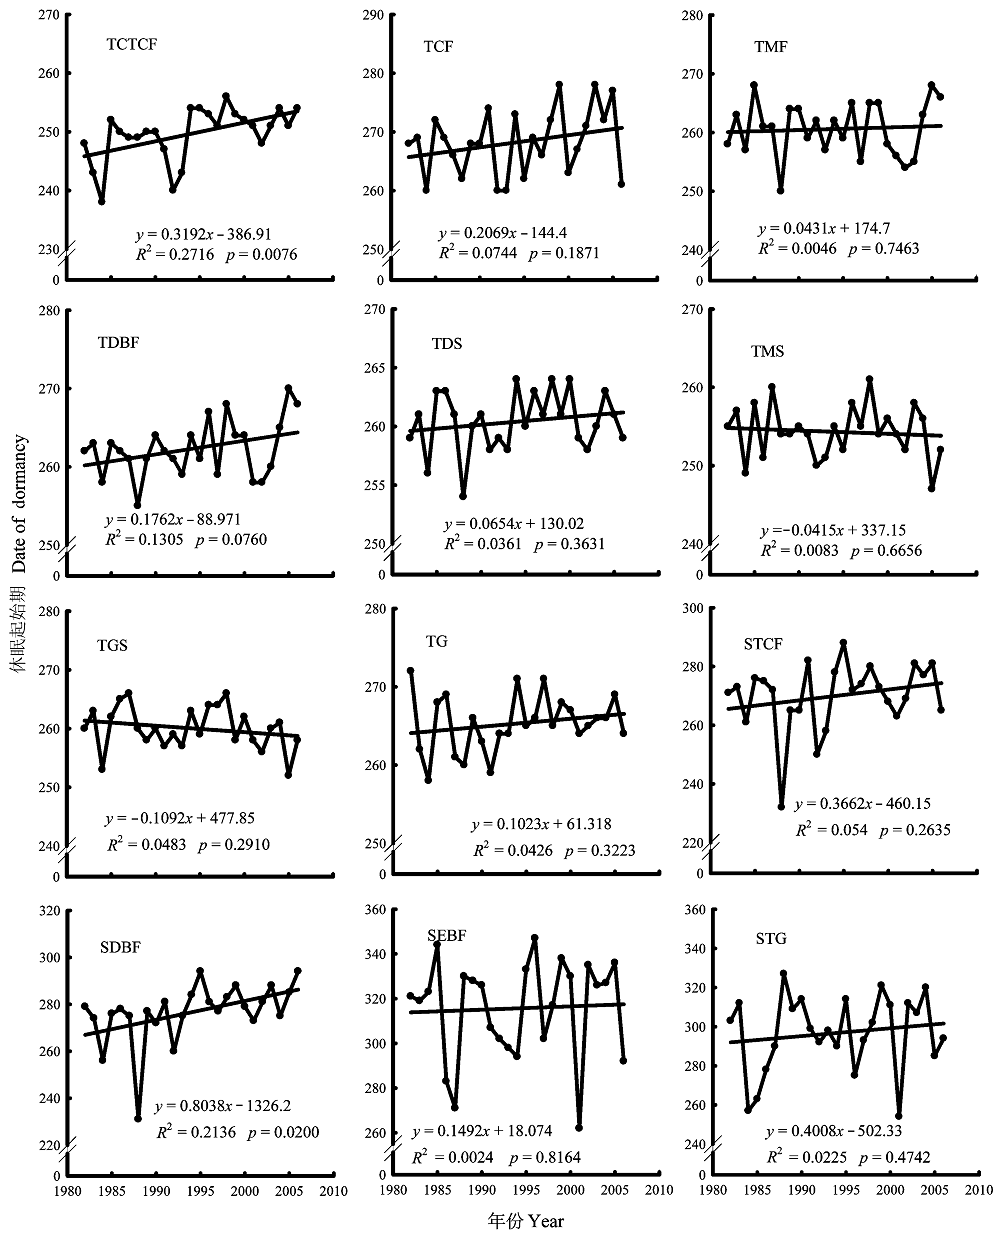
Fig. 5 Trend of onset dates of different vegetation dormancy. Notes see Fig.1.
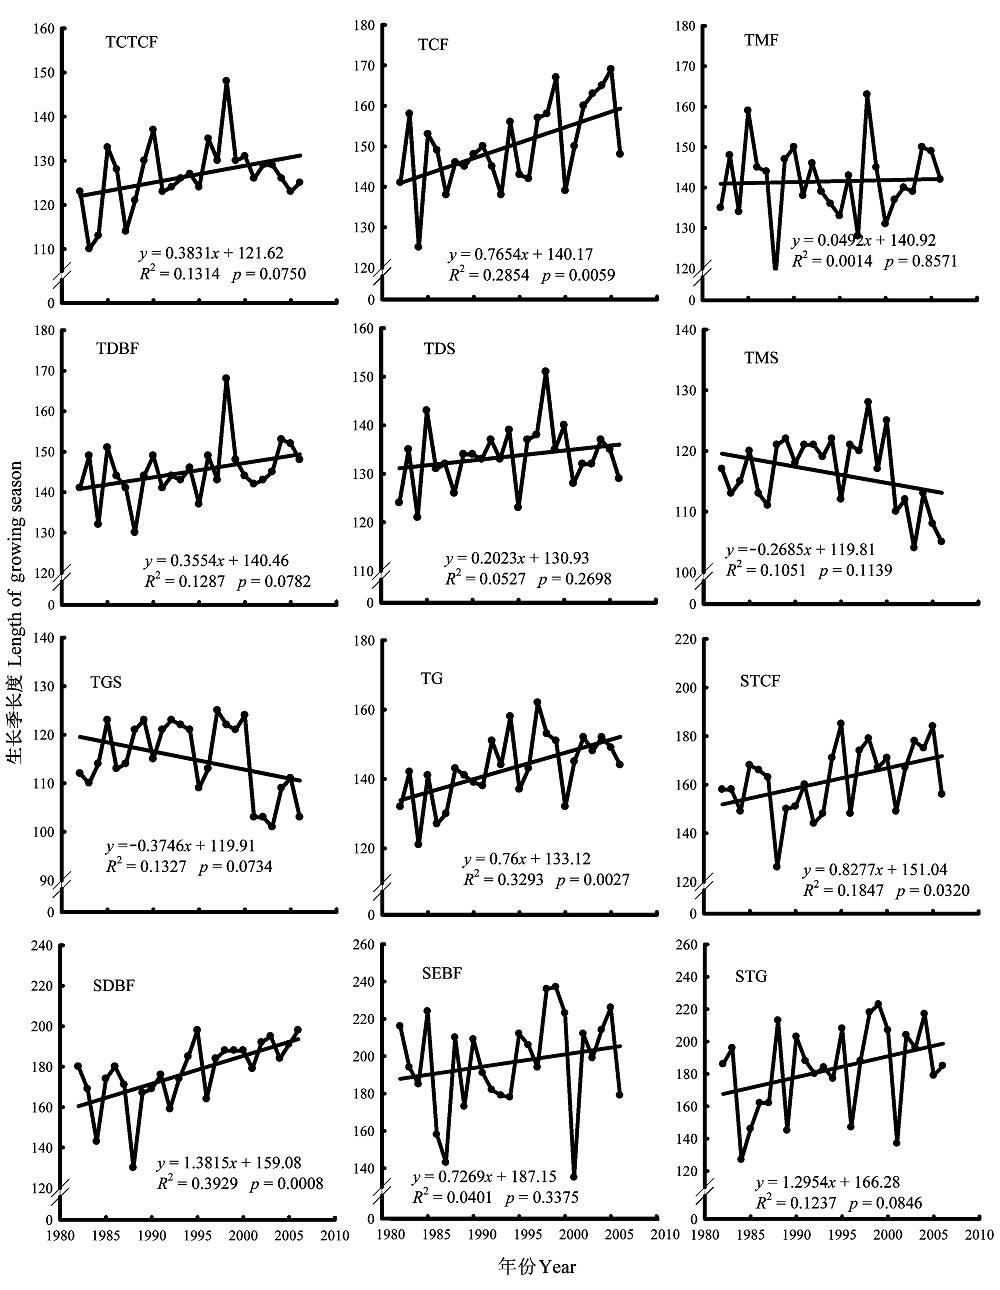
Fig. 6 Trend of growing season length of different vegetation. Notes see Fig.1.
| 植被类型 Vegetation type | 返青起始期 Green-up | 休眠起始期 Dormancy | 生长季长度 Length of growing season | |||
|---|---|---|---|---|---|---|
| 温度 Temperature | 降水 Precipitation | 温度 Temperature | 降水 Precipitation | 温度 Temperature | 降水 Precipitation | |
| TCTCF | -0.64** | 0.08 | 0.08 | -0.14 | 0.47* | 0.02 |
| TCF | -0.52** | -0.11 | 0.49* | 0.17 | 0.64* | -0.11 |
| TMF | -0.48* | 0.22 | 0.19 | 0.19 | 0.14 | 0.23 |
| TDBF | -0.71* | -0.02 | 0.38 | -0.01 | 0.43* | 0.20 |
| TDS | -0.50* | -0.41* | 0.19 | 0.03 | 0.39 | 0.29 |
| TMS | -0.08 | -0.28 | -0.07 | 0.14 | 0.10 | 0.38 |
| TG | -0.40* | -0.16 | -0.12 | -0.04 | -0.10 | -0.02 |
| TGS | 0.16 | -0.28 | -0.09 | 0.12 | 0.50 | -0.01 |
| STCF | -0.47* | 0.31 | 0.13 | 0.18 | 0.53** | -0.06 |
| SDBF | -0.52** | 0.01 | 0.30 | -0.29 | 0.52** | -0.01 |
| SEBF | -0.36 | 0.28 | 0.11 | -0.20 | 0.34 | -0.01 |
| STG | -0.38 | -0.06 | 0.03 | -0.06 | 0.38 | 0.06 |
Table 3 Correlation coefficients among phenological events, temperature and precipitation
| 植被类型 Vegetation type | 返青起始期 Green-up | 休眠起始期 Dormancy | 生长季长度 Length of growing season | |||
|---|---|---|---|---|---|---|
| 温度 Temperature | 降水 Precipitation | 温度 Temperature | 降水 Precipitation | 温度 Temperature | 降水 Precipitation | |
| TCTCF | -0.64** | 0.08 | 0.08 | -0.14 | 0.47* | 0.02 |
| TCF | -0.52** | -0.11 | 0.49* | 0.17 | 0.64* | -0.11 |
| TMF | -0.48* | 0.22 | 0.19 | 0.19 | 0.14 | 0.23 |
| TDBF | -0.71* | -0.02 | 0.38 | -0.01 | 0.43* | 0.20 |
| TDS | -0.50* | -0.41* | 0.19 | 0.03 | 0.39 | 0.29 |
| TMS | -0.08 | -0.28 | -0.07 | 0.14 | 0.10 | 0.38 |
| TG | -0.40* | -0.16 | -0.12 | -0.04 | -0.10 | -0.02 |
| TGS | 0.16 | -0.28 | -0.09 | 0.12 | 0.50 | -0.01 |
| STCF | -0.47* | 0.31 | 0.13 | 0.18 | 0.53** | -0.06 |
| SDBF | -0.52** | 0.01 | 0.30 | -0.29 | 0.52** | -0.01 |
| SEBF | -0.36 | 0.28 | 0.11 | -0.20 | 0.34 | -0.01 |
| STG | -0.38 | -0.06 | 0.03 | -0.06 | 0.38 | 0.06 |
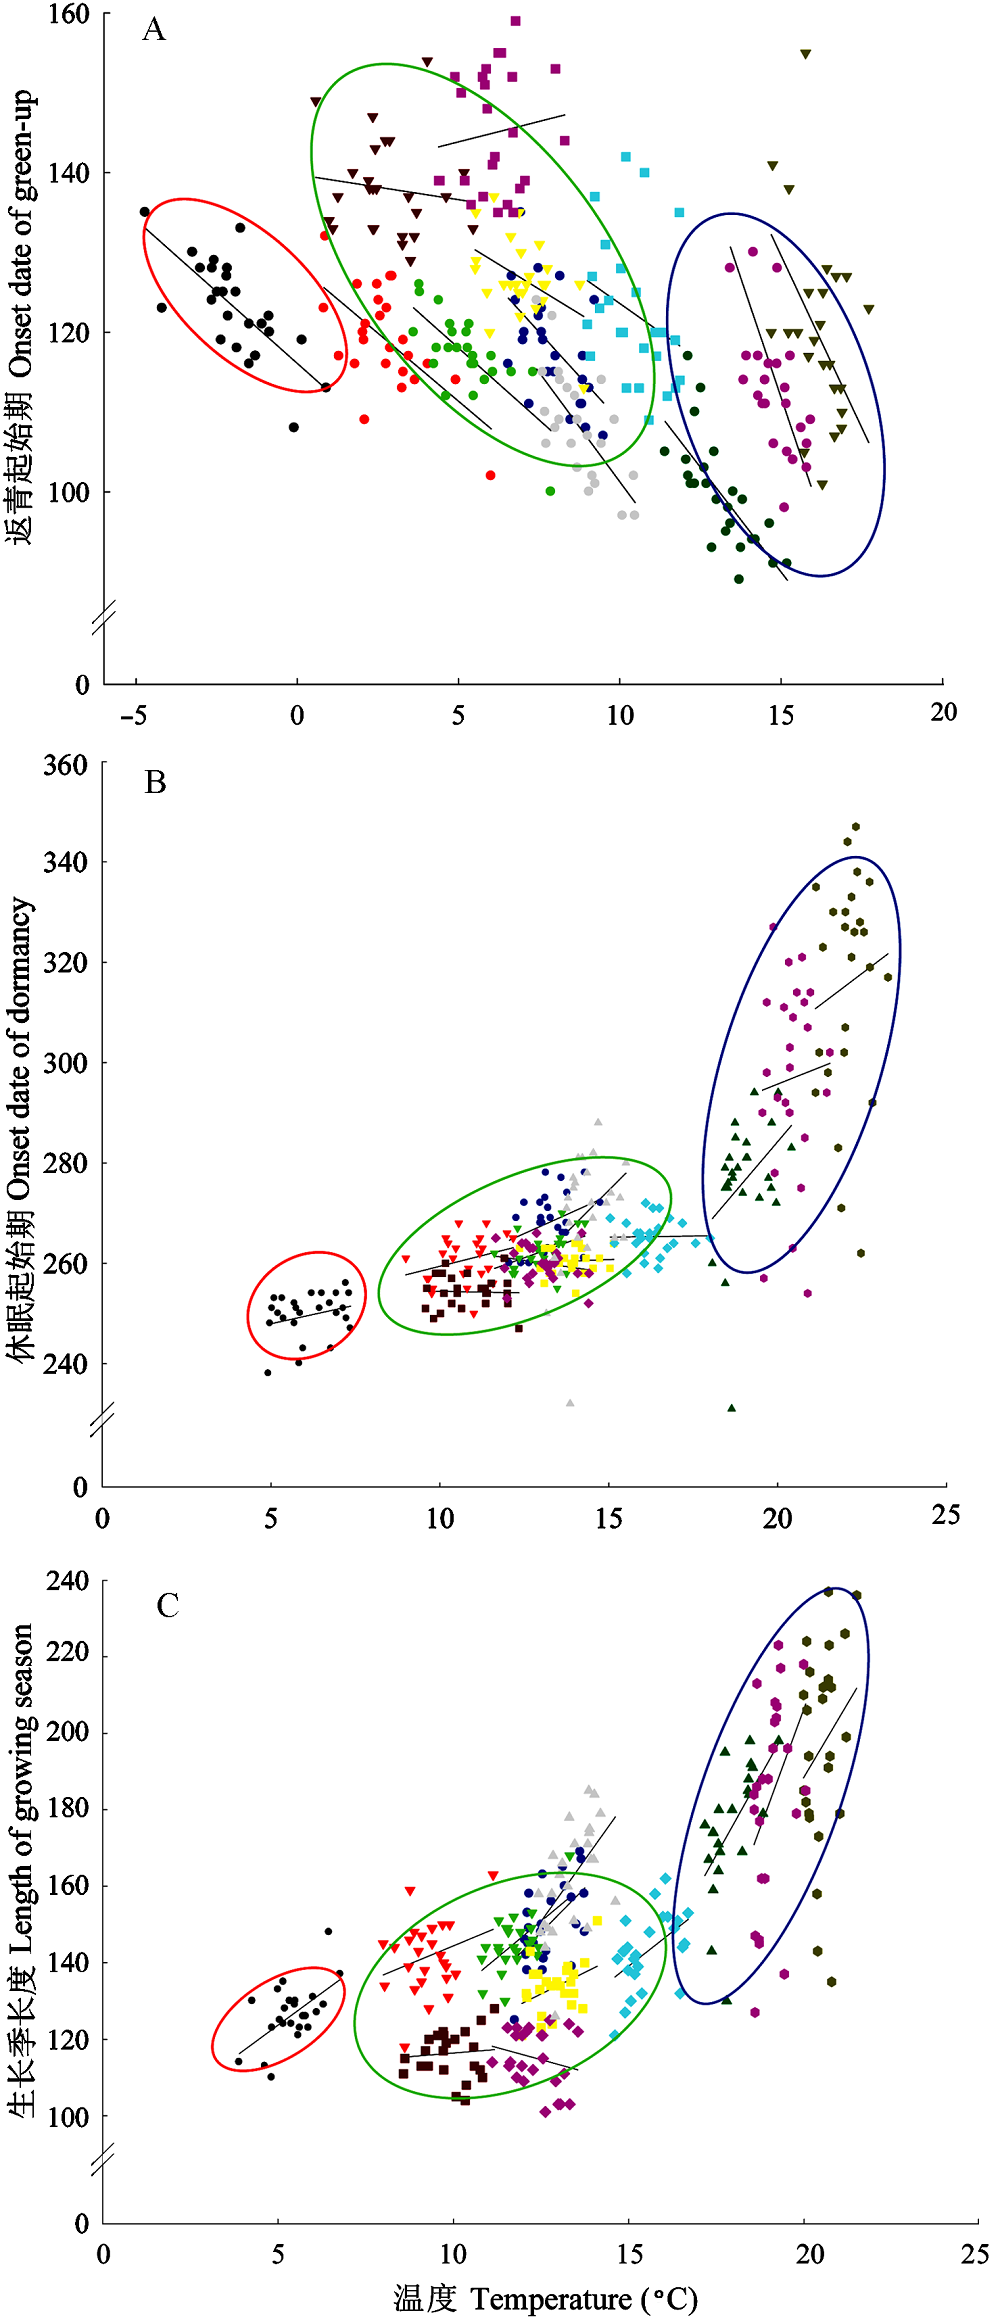
Fig. 7 Correlation between phonological events and temperature. Colors of scatter dots indicate different types of vegetation. A, Temperature and onset date of green-up. B, Temperature and onset date of dormancy. C, Temperature of growing season and length of growing season. Red ellipse indicates the vegetation of cold temperate zone; Green ellipse indicates the vegetation of temperate zone; Blue ellipse indicates the vegetation of tropical and subtropical zone.
| 植被类型 Vegetation type | 返青起始期 Green-up | 休眠起始期 Dormancy | 生长季长度 Length of growing season | ||||||
|---|---|---|---|---|---|---|---|---|---|
| 每年变化天数 Day of change per year (d·a-1) | 儒略日 Julian day | 标准误差 Standard error | 每年变化天数 Day of change per year (d·a-1) | 儒略日 Julian day | 标准误差 Standard error | 每年变化天数 Day of change per year (d·a-1) | 儒略日 Julian day | 标准误差 Standard error | |
| TCTCF | -0.36* | 123 | 6.2 | 0.15 | 250 | 4.5 | 0.67* | 127 | 7.8 |
| TCF | -0.45* | 118 | 7.0 | 0.30* | 268 | 5.6 | 0.93* | 150 | 10.5 |
| TMF | -0.34* | 119 | 6.4 | 0.17 | 260 | 4.7 | 0.38 | 142 | 9.5 |
| TDBF | -0.36* | 117 | 5.1 | 0.24* | 262 | 3.6 | 0.76* | 145 | 7.3 |
| TDS | -0.25* | 127 | 5.0 | 0.03 | 260 | 2.5 | 0.45* | 134 | 6.5 |
| TMS | -0.06 | 138 | 6.1 | -0.01 | 254 | 3.4 | 0.08 | 116 | 6.1 |
| TGS | 0.10 | 145 | 7.6 | -0.10 | 260 | 3.7 | -0.25 | 115 | 7.6 |
| TG | -0.29 | 122 | 9.0 | 0.01 | 265 | 3.6 | 0.72* | 143 | 9.7 |
| STCF | -0.55* | 108 | 7.0 | 0.67* | 270 | 11.6 | 1.3* | 162 | 14.2 |
| SDBF | -0.53* | 100 | 6.9 | 0.79* | 277 | 12.8 | 1.6* | 177 | 26.2 |
| SEBF | -0.86* | 119 | 14.2 | 0.51 | 316 | 22.5 | 1.6 | 197 | 26.7 |
| STG | -1.2* | 114 | 14.2 | 0.27 | 297 | 19.7 | 2.5* | 183 | 27.1 |
Table 4 Changes of phenological events in different vegetation types during 1982 to 2006 along North-South Transect of Eastern China (NSTEC) (d·a-1)
| 植被类型 Vegetation type | 返青起始期 Green-up | 休眠起始期 Dormancy | 生长季长度 Length of growing season | ||||||
|---|---|---|---|---|---|---|---|---|---|
| 每年变化天数 Day of change per year (d·a-1) | 儒略日 Julian day | 标准误差 Standard error | 每年变化天数 Day of change per year (d·a-1) | 儒略日 Julian day | 标准误差 Standard error | 每年变化天数 Day of change per year (d·a-1) | 儒略日 Julian day | 标准误差 Standard error | |
| TCTCF | -0.36* | 123 | 6.2 | 0.15 | 250 | 4.5 | 0.67* | 127 | 7.8 |
| TCF | -0.45* | 118 | 7.0 | 0.30* | 268 | 5.6 | 0.93* | 150 | 10.5 |
| TMF | -0.34* | 119 | 6.4 | 0.17 | 260 | 4.7 | 0.38 | 142 | 9.5 |
| TDBF | -0.36* | 117 | 5.1 | 0.24* | 262 | 3.6 | 0.76* | 145 | 7.3 |
| TDS | -0.25* | 127 | 5.0 | 0.03 | 260 | 2.5 | 0.45* | 134 | 6.5 |
| TMS | -0.06 | 138 | 6.1 | -0.01 | 254 | 3.4 | 0.08 | 116 | 6.1 |
| TGS | 0.10 | 145 | 7.6 | -0.10 | 260 | 3.7 | -0.25 | 115 | 7.6 |
| TG | -0.29 | 122 | 9.0 | 0.01 | 265 | 3.6 | 0.72* | 143 | 9.7 |
| STCF | -0.55* | 108 | 7.0 | 0.67* | 270 | 11.6 | 1.3* | 162 | 14.2 |
| SDBF | -0.53* | 100 | 6.9 | 0.79* | 277 | 12.8 | 1.6* | 177 | 26.2 |
| SEBF | -0.86* | 119 | 14.2 | 0.51 | 316 | 22.5 | 1.6 | 197 | 26.7 |
| STG | -1.2* | 114 | 14.2 | 0.27 | 297 | 19.7 | 2.5* | 183 | 27.1 |
| [1] |
Beaubien EG, Freeland HJ (2000). Spring phenology trends in Alberta, Canada: links to ocean temperature. International Journal of Biometeorology, 44, 53-59.
DOI URL PMID |
| [2] |
Beurs KM, Henebry GM (2004). Trend analysis of the pathfinder AVHRR Land (PAL) NDVI data for the deserts of central Asia. IEEE Geoscience and Remote Sensing Letters, 1, 282-286.
DOI URL |
| [3] |
Beurs KM, Henebry GM (2005). A statistical framework for the analysis of long image time series. International Journal of Remote Sensing, 26, 1551-1573.
DOI URL |
| [4] |
Chmielewski FM, Müller A, Bruns E (2004). Climate changes and trends in phenology of fruit trees and field crops in Germany, 1961-2000. Agricultural and Forest Meteorology, 121, 69-78.
DOI URL |
| [5] |
Chmielewski FM, Rötzer T (2001). Response of tree phenology to climate change across Europe. Agricultural and Forest Meteorology, 108, 101-112.
DOI URL |
| [6] | Compiling Committee of Vegetation Maps of 1:1,000,000 in China (中国科学院中国1:100万植被图编辑委员会) (2001) Atlas of Vegetation Maps of 1:1,000,000 in China (中国植被图集1: 100万). Science Press, Beijing. |
| [7] |
Defila C, Clot B (2001). Phytophenological trends in Switzerland. International Journal of Biometeorology, 45, 203-207.
URL PMID |
| [8] | Gao Q, Li XB, Yang XS (2003). Responses of vegetation and primary production in North-South Transect of Eastern China to global change under land use constraint. Acta Botanica Sinica, 45, 1274-1284. |
| [9] |
Heumann BW, Seaquist JW, Eklundh L, Jönsson P (2007). AVHRR derived phenological change in the Sahel and Soudan, Africa, 1982-2005. Remote Sensing of Environment, 108, 385-392.
DOI URL |
| [10] |
Hirsch RM, Slack JR, Smith RA (1982). Techniques of trend analysis for monthly water quality data. Water Resources Research, 18, 107-121.
DOI URL |
| [11] |
Karlsen SR, Solheim I, Beck PSA, Høgda1 KA, Wielgolaski FE, Tømmervik H (2007). Variability of the start of the growing season in Fennoscandia, 1982-2002. International Journal of Biometeorology, 51, 513-524.
DOI URL PMID |
| [12] | Kendall MG (1975). Rank Correlation Methods. Charles Griffin, London. |
| [13] |
Lettenmaier DP (1988). Multivariate nonparametric tests for trend in water quality. Water Resources Bulletin, 24, 505-512.
DOI URL |
| [14] |
Libiseller C, Grimvall A (2002). Performance of partial MannKendall test for trend detection in the presence of covariates. Environmetrics, 13, 71-84.
DOI URL |
| [15] |
Lucht W, Prentice IC, Myneni RB, Sitch S, Friedlingstein P, Cramer W, Bousquet P, Buermann W, Smith B (2002). Climatic control of the high-latitude vegetation greening trend and Pinatubo effect. Science, 296, 1687-1689.
DOI URL PMID |
| [16] |
Mann HB (1945). Nonparametric tests against trend. Econometrica, 13, 245-259.
DOI URL |
| [17] |
McVicar TR, Bierwirth PN (2001). Rapidly assessing the 1997 drought in Papua New Guinea using composite AVHRR imagery. International Journal of Remote Sensing, 22, 2109-2128.
DOI URL |
| [18] |
McVicar TR, Van Niel TG, Li LT, Hutchinson MF, Mu XM, Liu ZH (2007). Spatially distributing monthly reference evapotranspiration and pan evaporation considering topographic influences. Journal of Hydrology, 338, 196-220.
DOI URL |
| [19] |
Menzel A (2000). Trends in phenological phases in Europe between 1951 and 1996. International Journal of Biometeorology, 44, 76-81.
URL PMID |
| [20] |
Myneni RB, Keeling CD, Tucker CJ, Asrar G, Nemani RR (1997). Increased plant growth in the northern high latitudes from 1981 to 1991. Nature, 386, 698-702.
DOI URL |
| [21] |
Parmesan C (2007). Influences of species, latitudes and methodologies on estimates of phenological response to global warming. Global Change Biology, 13, 1860-1872.
DOI URL |
| [22] | Peng SL (彭少麟), Zhao P (赵平), Ren H (任海), Zheng FY (郑凤英) (2002). The possible heat-driven pattern variation of zonal vegetation and agricultural ecosystems along the North-South Transect of China under the global change. Earth Science Frontiers (地学前缘), 9, 217-226. (in Chinese with English abstract) |
| [23] |
Piao SL, Fang JY, Zhou LM, Ciais P, Zhu B (2006). Variations in satellite-derived phenology in China’s temperate vegetation. Global Change Biology, 12, 672-685.
DOI URL |
| [24] |
Reed BC, Brown JF, VanderZee D, Loveland TR, Merchant JW, Ohlen DO (1994). Measuring phenological variability from satellite imagery. Journal of Vegetation Science, 5, 703-714.
DOI URL |
| [25] | Schwarz MD, Reiter BE (2000). Changes in north American spring. International Journal of Biometeorology, 20, 929-932. |
| [26] |
Stockli R, Vidale PL (2004). European plant phenology and climate as seen in a 20-year AVHRR land-surface parameter dataset. International Journal of Remote Sensing, 25, 3303-3330.
DOI URL |
| [27] | Sun PS, Liu SR, Jiang H, Liu YL, Liu JT, Lin Y, Liu XL (2008). Hydrologic effects of NDVI time series in a context of climatic variability in an upstream catchment of the Minjiang River. Journal of the American Water Resources Association, 44, 1132-1143. |
| [28] | Teng L (滕菱), Ren H (任海), Peng SL (彭少麟) (2000). The natural situation of North South Transect of Eastern China. Ecologic Science (生态科学), 19(4), 1-10. (in Chinese with English abstract) |
| [29] |
Tucker CJ, Pinzon JE, Brown ME, Slayback D, Pak E, Mahoney R, Vermote E, Saleous N (2005). An extended AVHRR 8-km NDVI data set compatible with MODIS and SPOT vegetation NDVI data. International Journal of Remote Sensing, 26, 4485-4498.
DOI URL |
| [30] | Wu YF (武永峰), He CY (何春阳), Ma Y (马瑛), Li J (李京), Zhang YL (张业利) (2005). The comparison of the current remote sensing-based vegetation greenup detection methods with the computer simulation. Advances in Earth Research (地球科学进展) 20, 724-731. (in Chinese with English abstract) |
| [31] |
Xiao XM, Hagen S, Zhang QY, Keller M, Moore B (2006). Detecting leaf phenology of seasonally moist tropical forests in South America with multi-temporal MODIS images. Remote Sensing of Environment, 103, 465-473.
DOI URL |
| [32] |
Xiao XM, Zhang QY, Saleska S, Hutyra L, de Camargo P, Wofsy S, Frolking S, Boles S, Keller M, Moore B (2005). Satellite-based modeling of gross primary production in a seasonally moist tropical evergreen forest. Remote Sensing of Environment, 94, 105-122.
DOI URL |
| [33] | Yan H (阎洪) (2004). Modeling spatial distribution of climate in China using thin plate smoothing spline interpolation. Scientia Geographica Sinica (地理科学), 24, 163-169. (in Chinese with English abstract) |
| [34] |
Zhou L, Tucker CJ, Kaufmann RK, Slayback D, Shabanov NV, Myneni RB (2001). Variations in northern vegetation activity inferred from satellite data of vegetation index during 1981-1999. Journal of Geophysics Research, 106, 20069-20083.
DOI URL |
| [1] | REN Pei-Xin, LI Peng, PENG Chang-Hui, ZHOU Xiao-Lu, YANG Ming-Xia. Temporal and spatial variation of vegetation photosynthetic phenology in Dongting Lake basin and its response to climate change [J]. Chin J Plant Ecol, 2023, 47(3): 319-330. |
| [2] | XIA Jing-Yu, ZHANG Yang-Jian, ZHENG Zhou-Tao, ZHAO Guang, ZHAO Ran, ZHU Yi-Xuan, GAO Jie, SHEN Ruo-Nan, LI Wen-Yu, ZHENG Jia-He, ZHANG Yu-Xue, ZHU Jun-Tao, SUN Osbert Jianxin. Asynchronous response of plant phenology to warming in a Kobresia pygmaea meadow in Nagqu, Qingzang Plateau [J]. Chin J Plant Ecol, 2023, 47(2): 183-194. |
| [3] | CHEN Xin-Yi, WU Chen, HUANG Jin-Xue, XIONG De-Cheng. Effects of warming on fine root phenology of forests: a review [J]. Chin J Plant Ecol, 2023, 47(11): 1471-1482. |
| [4] | WEI Yao, MA Zhi-Yuan, ZHOU Jia-Ying, ZHANG Zhen-Hua. Experimental warming changed reproductive phenology and height of alpine plants on the Qingzang Plateau [J]. Chin J Plant Ecol, 2022, 46(9): 995-1004. |
| [5] | CHEN Yi-Zhu, LANG Wei-Guang, CHEN Xiao-Qiu. Process-based simulation of autumn phenology of trees and the regional differentiation attribution in northern China [J]. Chin J Plant Ecol, 2022, 46(7): 753-765. |
| [6] | ZHANG Di, DU Ye-Qin, WANG Lei, CHEN Xin, YAN Xing-Fu, TANG Zhan-Hui. Differences in flowering and pollination characteristics of two gender phenotypes of Lilium concolor var. megalanthum between two habitats [J]. Chin J Plant Ecol, 2022, 46(5): 580-592. |
| [7] | TIAN Lei, ZHU Yi, LI Xin, HAN Guo-Dong, REN Hai-Yan. Responses of plant phenology to warming and nitrogen addition under different precipitation conditions in a desert steppe of Nei Mongol, China [J]. Chin J Plant Ecol, 2022, 46(3): 290-299. |
| [8] | CONG Nan, ZHANG Yang-Jian, ZHU Jun-Tao. Temperature sensitivity of vegetation phenology in spring in mid- to high-latitude regions of Northern Hemisphere during the recent three decades [J]. Chin J Plant Ecol, 2022, 46(2): 125-135. |
| [9] | YU Hai-Ying, YANG Li-Lin, FU Su-Jing, ZHANG Zhi-Min, YAO Qi-Fu. Response of leaf-unfolding dates of woody species to variation of chilling and heat accumulation in warm temperate forests [J]. Chin J Plant Ecol, 2022, 46(12): 1573-1584. |
| [10] | WU Lin-Sheng, ZHANG Yong-Guang, ZHANG Zhao-Ying, ZHANG Xiao-Kang, WU Yun-Fei. Remote sensing of solar-induced chlorophyll fluorescence and its applications in terrestrial ecosystem monitoring [J]. Chin J Plant Ecol, 2022, 46(10): 1167-1199. |
| [11] | Ning LIU, Shou-Zhang PENG, Yun-Ming CHEN. Temporal effects of climate factors on vegetation growth on the Qingzang Plateau, China [J]. Chin J Plant Ecol, 2022, 46(1): 18-26. |
| [12] | DU Jun, WANG Wen, HE Zhi-Bin, CHEN Long-Fei, LIN Peng-Fei, ZHU Xi, TIAN Quan-Yan. Spatial variability of phenological phenotype of Picea crassifolia in Qilian Mountains and its internal mechanism [J]. Chin J Plant Ecol, 2021, 45(8): 834-843. |
| [13] | CHEN Zhe, WANG Hao, WANG Jin-Zhou, SHI Hui-Jin, LIU Hui-Ying, HE Jin-Sheng. Estimation on seasonal dynamics of alpine grassland aboveground biomass using phenology camera-derived NDVI [J]. Chin J Plant Ecol, 2021, 45(5): 487-495. |
| [14] | ZHOU Wen, CHI Yong-Gang, ZHOU Lei. Vegetation phenology in the Northern Hemisphere based on the solar-induced chlorophyll fluorescence [J]. Chin J Plant Ecol, 2021, 45(4): 345-354. |
| [15] | ZHOU Ming-Xing, LI Deng-Qiu, ZOU Jian-Jun. Vegetation change of giant panda habitats in Qionglai Mountains through dense Landsat Data [J]. Chin J Plant Ecol, 2021, 45(4): 355-369. |
| Viewed | ||||||
|
Full text |
|
|||||
|
Abstract |
|
|||||
Copyright © 2022 Chinese Journal of Plant Ecology
Tel: 010-62836134, 62836138, E-mail: apes@ibcas.ac.cn, cjpe@ibcas.ac.cn