
Chin J Plant Ecol ›› 2005, Vol. 29 ›› Issue (2): 197-201.DOI: 10.17521/cjpe.2005.0025
Previous Articles Next Articles
ZHANG Mi1,2, XIONG Gao-Ming1, CHEN Zhi-Gang1, FAN Da-Yong1, XIE Zong-Qiang1,*( )
)
Received:2004-02-22
Accepted:2004-06-21
Online:2005-02-22
Published:2005-03-10
Contact:
XIE Zong-Qiang
ZHANG Mi, XIONG Gao-Ming, CHEN Zhi-Gang, FAN Da-Yong, XIE Zong-Qiang. THE APPLICATION OF DIGITAL ELEVATION MODELS IN COMMUNITY BIODIVERSITY RESEARCH WITH AN EXAMPLE FROM A FAGUS ENGLERIANA-CYCLOBALANOPSIS OXYODON COMMUNITY IN SHENNONGJIA AREA[J]. Chin J Plant Ecol, 2005, 29(2): 197-201.
Add to citation manager EndNote|Ris|BibTeX
URL: https://www.plant-ecology.com/EN/10.17521/cjpe.2005.0025
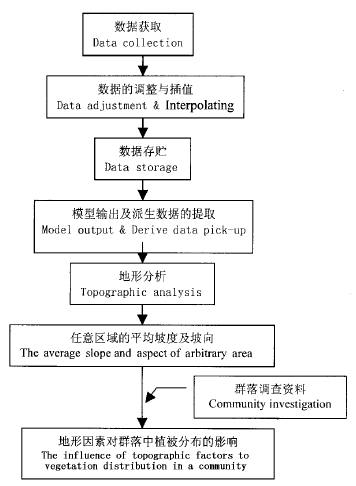
Fig.1 Sketch map of building DEM
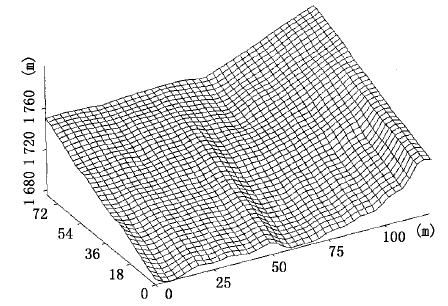
Fig.2 3D map of the 0.96 hm2 permanent plot
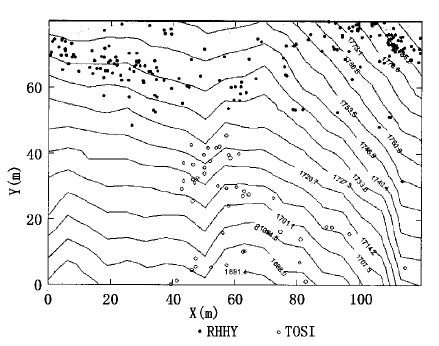
Fig.3 Contour map of the 0.96 hm2 permanent plot
| 植物名 Species | 相关系数 Correlation coefficients | ||
|---|---|---|---|
| 坡度 Slope | 坡向 Aspect | 坡位 Position | |
| 曼青冈 (1) | -0.535 | 0.913 | -0.771 |
| 米心水青冈 (2) | 0.994 | 0.004 | -0.327 |
| 粉白杜鹃 (3) | -0.887 | -0.977 | -0.870 |
| 石栎 (4) | -0.800 | 0.895 | 0.655 |
| 四照花 (5) | -0.001 | 0.270 | -0.993 |
| 香椿 (6) | 0.797 | 0.975 | 0.721 |
| 小叶青皮槭 (7) | 0.871 | -0.031 | 0.415 |
| 鄂椴 (8) | 0.846 | -0.416 | 0.993 |
| 血皮槭 (9) | -0.152 | -0.523 | -0.240 |
| 三桠乌药 (10) | -0.954 | -0.609 | -0.866 |
| 水榆花楸 (11) | -0.970 | 0.731 | -0.866 |
| 山白树 (12) | -0.909 | -0.123 | -0.327 |
| 木来木 (13) | -0.078 | 0.961 | 0.655 |
| 稠李 (14) | -0.401 | 0.429 | 0.397 |
| 华榛 (15) | -0.014 | 0.247 | 0.866 |
| 巴东栎 (16) | 0.841 | 0.814 | 0.866 |
| 领春木 (17) | 0.592 | 0.263 | 0.952 |
| 锥栗 (18) | -0.943 | -0.813 | -0.866 |
| 化香 (19) | 0.179 | 0.993 | 0.866 |
| 灯台 (20) | -0.815 | 0.786 | 0.866 |
| 紫茎 (21) | 0.027 | -0.969 | -1.000 |
| 石灰花楸 (22) | -0.901 | 0.000 | -0.933 |
| 鸡爪槭 (23) | 0.757 | 0.731 | -0.277 |
| 扇叶槭 (24) | 0.981 | -0.555 | 0.866 |
Table 1 The correlation coefficients between the species distribution in the community and the topographic factors
| 植物名 Species | 相关系数 Correlation coefficients | ||
|---|---|---|---|
| 坡度 Slope | 坡向 Aspect | 坡位 Position | |
| 曼青冈 (1) | -0.535 | 0.913 | -0.771 |
| 米心水青冈 (2) | 0.994 | 0.004 | -0.327 |
| 粉白杜鹃 (3) | -0.887 | -0.977 | -0.870 |
| 石栎 (4) | -0.800 | 0.895 | 0.655 |
| 四照花 (5) | -0.001 | 0.270 | -0.993 |
| 香椿 (6) | 0.797 | 0.975 | 0.721 |
| 小叶青皮槭 (7) | 0.871 | -0.031 | 0.415 |
| 鄂椴 (8) | 0.846 | -0.416 | 0.993 |
| 血皮槭 (9) | -0.152 | -0.523 | -0.240 |
| 三桠乌药 (10) | -0.954 | -0.609 | -0.866 |
| 水榆花楸 (11) | -0.970 | 0.731 | -0.866 |
| 山白树 (12) | -0.909 | -0.123 | -0.327 |
| 木来木 (13) | -0.078 | 0.961 | 0.655 |
| 稠李 (14) | -0.401 | 0.429 | 0.397 |
| 华榛 (15) | -0.014 | 0.247 | 0.866 |
| 巴东栎 (16) | 0.841 | 0.814 | 0.866 |
| 领春木 (17) | 0.592 | 0.263 | 0.952 |
| 锥栗 (18) | -0.943 | -0.813 | -0.866 |
| 化香 (19) | 0.179 | 0.993 | 0.866 |
| 灯台 (20) | -0.815 | 0.786 | 0.866 |
| 紫茎 (21) | 0.027 | -0.969 | -1.000 |
| 石灰花楸 (22) | -0.901 | 0.000 | -0.933 |
| 鸡爪槭 (23) | 0.757 | 0.731 | -0.277 |
| 扇叶槭 (24) | 0.981 | -0.555 | 0.866 |
| [1] | Chen LZ (陈灵芝), Wang ZW (王祖望) (1999). TheImpactofHumanAlternationonEcosystemDiversity (人类活动对生态系统多样性的影响). ZhejiangScienceandTechnologyPress, Hangzhou,139-197. (inChinese). |
| [2] | DeMers MN TranslatedbyWu FD (武法东), Fu ZT (付宗堂), Wang XN (王小牛) (2001). FundamentalsofGeo graphicInformationSystems (inEnglish). ElectronicIndus tryPress, Beijing,22-196. |
| [3] | DozierJ, StrahlerAH (1983). Groundinvestigationsinsup portofremotesensing.In:ColwellRHed.ManualofRe moteSensing. CambridgeUniversityPress, Cambridge, 1232. |
| [4] | Editorial Group for Country Studies on Biodiversity in China (中国生物多样性国情研究报告编写组) (1998). The Nation Report of China Biodiversity Status (中国生物多样性国情研究报告). China Environment Science Press, Beijing, 1-10. (inChinese). |
| [5] | Fang JY (方精云), Guo QH (郭庆华), Liu GH (刘国华) (1999). DistributionpatternsofChineseBeech (FagusL.)speciesinrelationtotopography. ActaBotanicaSinica (植物学报), 41,766-774. (inChinesewithEnglishab stract). |
| [6] | Guo ZH (郭志华), Peng SL (彭少麟), Wang BS (王伯荪), Zhang Z (张征) (1999). EstimationofradiationabsorptionbyGuangdongvegetationusingGISandRS. ActaEcologicaSinica (生态学报), 19,441-446. (inChinesewithEng lishabstract). |
| [7] | Horn BP (1981). Hillshadingandthereflectancemap. Pro ceedingsoftheInstituteofElectrical&ElectronicEngi neers, 69,14. |
| [8] | Li X (李新), Cheng GD (程国栋), Lu L (卢玲) (2000). Comparisonofspatialinterpolationmethods. AdvanceinEarthSciences (地球科学进展), 15,260-265. (inChi nesewithEnglishabstract). |
| [9] | Li ZL (李志林) (2000). DigitalElevationModel (数字高程模型). ScienceandTechnologyTopographyUniversityPress, Wuhan, 125-158. (inChinese). |
| [10] | Shen ZH (沈泽昊), Fang JY (方精云) (2001). Nichecom parisonoftwoFagusspeciesbasedonthetopographicpat ternsoftheirpopulations. ActaPhyhtoecologicaSinica (植物生态学报), 25,392-398. (inChinesewithEnglishab stract). |
| [11] | Shen ZH (沈泽昊), Zhang XS (张新时) (2000). ThespatialpatternandtopographicinterpretationoftheforestvegetationatDalaolingregioninthethreeGorges. ActaBotanicaSini ca (植物学报), 42,1089-1095. (inChinesewithEnglishabstract). |
| [12] | Song YC (宋永昌) (2001). Vegetation Ecology (植被生态学). EastChinaNormalUniversityPress, Shanghai,173-176. (inChinese). |
| [13] | Zhang M (张谧), Xiong GM (熊高明), Chen ZG (陈志刚), Fan DY (樊大勇), Xie ZQ (谢宗强) (2004). Thetopogra phyheterogeneityofFagusengleriana_Cyclobalanopsisoxyo doncommunityinShennongjiaregion. ActaEcologicaSinica (生态学报), 24,2686-2692. (in Chinese with English abstract) |
| [1] | Kangwei Jiang Qing-Qing QINGZHANG Wang Yafei Li Hong Ding Yu Yang Yongqiang Tuerxunnayi Reyimu. Characteristics of plant functional groups and the relationships with soil environmental factors in the middle part of the northern slope of Tianshan Mountain under different grazing intensities [J]. Chin J Plant Ecol, 2024, 48(预发表): 0-0. |
| [2] | Shan-Shan LI xueqin liu. Analysis of functional traits of wetland plants in floodplains in the middle reaches of the Yangtze River [J]. Chin J Plant Ecol, 2024, 48(5): 601-611. |
| [3] | TANG Lu-Yao, FANG Jing, QIAN Hai-Rong, ZHANG Bo-Na, SHANGGUAN Fang-Jing, YE Lin-Feng, LI Shu-Wen, TONG Jin-Lian, XIE Jiang-Bo. Variation and coordination in functional traits along the tree height of Taxodium distichum and Taxodium distichum var. imbricatum [J]. Chin J Plant Ecol, 2023, 47(11): 1561-1575. |
| [4] | HE Lu-Lu, ZHANG Xuan, ZHANG Yu-Wen, WANG Xiao-Xia, LIU Ya-Dong, LIU Yan, FAN Zi-Ying, HE Yuan-Yang, XI Ben-Ye, DUAN Jie. Crown characteristics and its relationship with tree growth on different slope aspects for Larix olgensis var. changbaiensis plantation in eastern Liaoning mountainous area, China [J]. Chin J Plant Ecol, 2023, 47(11): 1523-1539. |
| [5] | ZANG Yong-Xin, MA Jian-Ying, ZHOU Xiao-Bing, TAO Ye, YIN Ben-Feng, Shayaguli JIGEER, ZHANG Yuan-Ming. Effects of extreme drought and extreme precipitation on aboveground productivity of ephemeral plants across different slope positions along sand dunes [J]. Chin J Plant Ecol, 2022, 46(12): 1537-1550. |
| [6] | ZHANG Wen-Qiang, LUO Ge-Ping, ZHENG Hong-Wei, WANG Hao, HAMDI Rafiq, HE Hui-Li, CAI Peng, CHEN Chun-Bo. Analysis of vegetation index changes and driving forces in inland arid areas based on random forest model: a case study of the middle part of northern slope of the north Tianshan Mountains [J]. Chin J Plant Ecol, 2020, 44(11): 1113-1126. |
| [7] | ZHANG Xue-Jiao, GAO Xian-Ming, JI Cheng-Jun, KANG Mu-Yi, WANG Ren-Qing, YUE Ming, ZHANG Feng, TANG Zhi-Yao. Response of abundance distribution of five species of Quercus to climate change in northern China [J]. Chin J Plant Ecol, 2019, 43(9): 774-782. |
| [8] | LI Quan-Di, LIU Min-Xia, XIA Su-Juan, NAN Xiao-Ning, JIANG Xiao-Xuan. Changes in species-abundance relationships of plant communities with slopes in alpine meadows of Gannan, China [J]. Chin J Plant Ecol, 2019, 43(5): 418-426. |
| [9] | LIU Xiao-Tong, YUAN Quan, NI Jian. Research advances in modelling plant species distribution in China [J]. Chin J Plant Ecol, 2019, 43(4): 273-283. |
| [10] | NING Yao, LEI Jin-Rui, SONG Xi-Qiang, HAN Shu-Mei, ZHONG Yun-Fang. Modeling the potential suitable habitat of Impatiens hainanensis, a limestone-endemic plant [J]. Chin J Plant Ecol, 2018, 42(9): 946-954. |
| [11] | Ze-Bin LIU, Yan-Hui WANG, Yu LIU, Ao TIAN, Ya-Rui WANG, Hai-Jun ZUO. Spatiotemporal variation and scale effect of canopy leaf area index of larch plantation on a slope of the semi-humid Liupan Mountains, Ningxia, China [J]. Chin J Plant Ecol, 2017, 41(7): 749-760. |
| [12] | Ying-Di CHE, Min-Xia LIU, Li-Rong LI, Jiao JIAO, Wei XIAO. Exploring the community assembly of subalpine meadow communities based on functional traits and community phylogeny [J]. Chin J Plan Ecolo, 2017, 41(11): 1157-1167. |
| [13] | Jia-Zhi FAN, Dan WANG, Ya-Lin HU, Pan-Pan JING, Peng-Peng WANG, Jiquan CHEN. Optimal stomatal behavior theory for simulating stomatal conductance [J]. Chin J Plan Ecolo, 2016, 40(6): 631-642. |
| [14] | Jing DU, Cheng-Zhang ZHAO, Qing-Hua SONG, Yuan-Chun SHI, Ji-Wei WANG, Jing CHEN. Plant size differences with twig and leaf traits of Zygophyllum xanthoxylum in the northern slope of Qilian Mountains, China [J]. Chin J Plan Ecolo, 2016, 40(3): 212-220. |
| [15] | Bei-Bei DUAN, Cheng-Zhang ZHAO, Ting XU, Hui-Ling ZHENG, Wei FENG, Ling HAN. Correlation analysis between vein density and stomatal traits of Robinia pseudoacacia in different aspects of Beishan Mountain in Lanzhou [J]. Chin J Plant Ecol, 2016, 40(12): 1289-1297. |
| Viewed | ||||||
|
Full text |
|
|||||
|
Abstract |
|
|||||
Copyright © 2026 Chinese Journal of Plant Ecology
Tel: 010-62836134, 62836138, E-mail: apes@ibcas.ac.cn, cjpe@ibcas.ac.cn
![]()