
植物生态学报 ›› 2007, Vol. 31 ›› Issue (1): 93-101.DOI: 10.17521/cjpe.2007.0012
李轩然1,2,3, 刘琪璟1,*( ), 蔡哲4, 马泽清1,3
收稿日期:2006-02-17
接受日期:2006-06-27
出版日期:2007-02-17
发布日期:2007-01-30
通讯作者:
刘琪璟
作者简介:* E-mail: liuqj@igsnrr.ac.cn基金资助:
LI Xuan-Ran1,2,3, LIU Qi-Jing1,*(), CAI Zhe4, MA Ze-Qing1,3
Received:2006-02-17
Accepted:2006-06-27
Online:2007-02-17
Published:2007-01-30
Contact:
LIU Qi-Jing
摘要:
根据实测数据计算了湿地松(Pinus elliotii)、马尾松(P. massoniana) 和杉木(Cunninghamia lanceolata)不同年龄、不同类型叶片的生物量和比叶面积,并结合样地调查数据和相对生长方程计算了中国科学院千烟洲试验站20年生湿地松林、马尾松林、杉木林和针叶混交林的叶面积指数。根据拟合结果,选择如下方程计算3个树种的叶生物量:湿地松W=12.074 1D2.151 5、马尾松W=6.972 7D2.197 3和杉木W=5.261 9D2.302 7。湿地松林的叶生物量(0.822 kg·m-2)最大,其次为针叶混交林(0.679 kg·m-2),马尾松林和杉木林相差不大(分别为林0.528和0.572 kg·m-2)。不同树种、不同年龄、不同类型叶片的比叶面积比较发现,新叶的比叶面积大于老叶,三针一束叶的比叶面积略大于两针一束叶,马尾松的平均半比表面积(8.62 m2·kg-1)大于湿地松(6.04 m2·kg-1)和杉木(7.91 m2·kg-1)。胸径与单木叶片半表面积之间的经验方程为:湿地松LA=0.073D2.151 5、马尾松LA=0.060D2.197 3和杉木LA=0.042D2.302 7。据此计算湿地松林的叶面积指数为5.03,马尾松林和杉木林为4.31,针叶混交林为4.77,该结果比利用CI-110植被冠层数字图像仪测得的结果偏大。
李轩然, 刘琪璟, 蔡哲, 马泽清. 千烟洲针叶林的比叶面积及叶面积指数. 植物生态学报, 2007, 31(1): 93-101. DOI: 10.17521/cjpe.2007.0012
LI Xuan-Ran, LIU Qi-Jing, CAI Zhe, MA Ze-Qing. SPECIFIC LEAF AREA AND LEAF AREA INDEX OF CONIFER PLANTATIONS IN QIANYANZHOU STATION OF SUBTROPICAL CHINA. Chinese Journal of Plant Ecology, 2007, 31(1): 93-101. DOI: 10.17521/cjpe.2007.0012
图1 湿地松叶横切面示意图
Fig.1 Sketch map of slash pine leaves
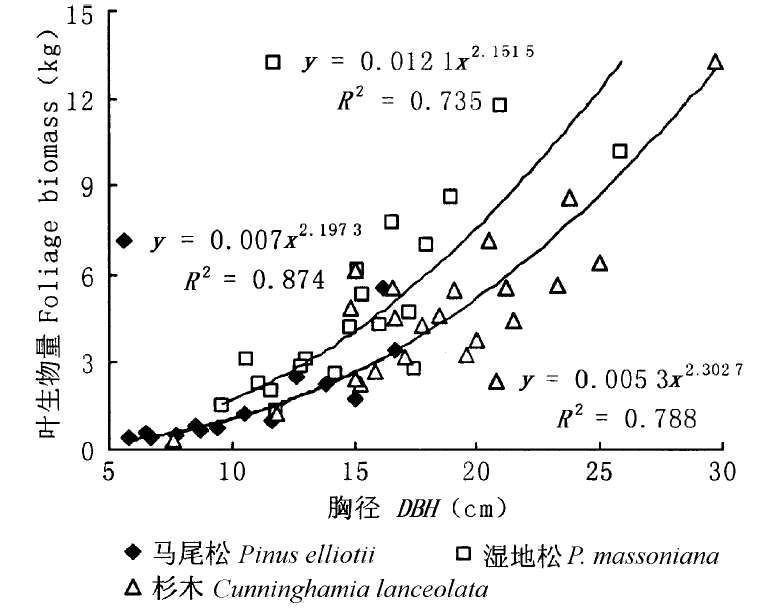
图2 湿地松、马尾松和杉木的叶生物量方程
Fig.2 Foliage biomass equations of slash pine, masson pine and Chinese fir
| 群落类型 Forest type | 样地编号 Plot No. | 样地面积 Area (m2) | 密度(株·hm-2) Density (plant·hm-2) | 叶生物量 Foliage biomass (kg·m-2) | ||||||||||||||||||||||
|---|---|---|---|---|---|---|---|---|---|---|---|---|---|---|---|---|---|---|---|---|---|---|---|---|---|---|
| 湿地松 Slash pine | 马尾松 Masson pine | 杉木 Chinese fir | ||||||||||||||||||||||||
| 湿地松林SPP | 802A | 400 | 1 675 | 0.842 | 0 | 0 | ||||||||||||||||||||
| 802B | 400 | 1 450 | 0.756 | 0.046 | 0 | |||||||||||||||||||||
| 马尾松林MPP | 731A | 400 | 2 100 | 0.118 | 0.409 | 0 | ||||||||||||||||||||
| 801A | 400 | 2 175 | 0.063 | 0.466 | 0 | |||||||||||||||||||||
| 杉木林CFP | 803A | 400 | 3 475 | 0.218 | 0 | 0.313 | ||||||||||||||||||||
| 804A | 100 | 4 600 | 0.010 | 0 | 0.603 | |||||||||||||||||||||
| 针叶混交林CMP | 807B | 100 | 1 900 | 0.660 | 0.128 | 0 | ||||||||||||||||||||
| 810B | 100 | 3 000 | 0 | 0.531 | 0.049 | |||||||||||||||||||||
| 811A | 100 | 2 100 | 0 | 0.353 | 0 | |||||||||||||||||||||
| 811B | 100 | 2 200 | 0.993 | 0 | 0 | |||||||||||||||||||||
表1 湿地松、马尾松和杉木的叶生物量
Table 1 Foliage biomass of slash pine, masson pine and Chinese fir
| 群落类型 Forest type | 样地编号 Plot No. | 样地面积 Area (m2) | 密度(株·hm-2) Density (plant·hm-2) | 叶生物量 Foliage biomass (kg·m-2) | ||||||||||||||||||||||
|---|---|---|---|---|---|---|---|---|---|---|---|---|---|---|---|---|---|---|---|---|---|---|---|---|---|---|
| 湿地松 Slash pine | 马尾松 Masson pine | 杉木 Chinese fir | ||||||||||||||||||||||||
| 湿地松林SPP | 802A | 400 | 1 675 | 0.842 | 0 | 0 | ||||||||||||||||||||
| 802B | 400 | 1 450 | 0.756 | 0.046 | 0 | |||||||||||||||||||||
| 马尾松林MPP | 731A | 400 | 2 100 | 0.118 | 0.409 | 0 | ||||||||||||||||||||
| 801A | 400 | 2 175 | 0.063 | 0.466 | 0 | |||||||||||||||||||||
| 杉木林CFP | 803A | 400 | 3 475 | 0.218 | 0 | 0.313 | ||||||||||||||||||||
| 804A | 100 | 4 600 | 0.010 | 0 | 0.603 | |||||||||||||||||||||
| 针叶混交林CMP | 807B | 100 | 1 900 | 0.660 | 0.128 | 0 | ||||||||||||||||||||
| 810B | 100 | 3 000 | 0 | 0.531 | 0.049 | |||||||||||||||||||||
| 811A | 100 | 2 100 | 0 | 0.353 | 0 | |||||||||||||||||||||
| 811B | 100 | 2 200 | 0.993 | 0 | 0 | |||||||||||||||||||||
| 群落类型 Forest type | 湿地松 Slash pine | 马尾松Masson pine | 杉木Chinese fir | ||
|---|---|---|---|---|---|
| 老叶 Old leaf (kg·m-2) | 新叶 New leaf (kg·m-2) | 老叶 Old leaf (kg·m-2) | 新叶 New leaf (kg·m-2) | 总叶 Leaf (kg·m-2) | |
| 湿地松林SPP | 0.372 | 0.427 | 0.010 | 0.013 | 0 |
| 马尾松林MPP | 0.042 | 0.048 | 0.192 | 0.245 | 0 |
| 杉木林CFP | 0.053 | 0.061 | 0 | 0 | 0.458 |
| 针叶混交林CMP | 0.192 | 0.221 | 0.111 | 0.142 | 0.012 |
表2 各树种老叶和新叶生物量
Table 2 Biomass of old foliage and new foliage
| 群落类型 Forest type | 湿地松 Slash pine | 马尾松Masson pine | 杉木Chinese fir | ||
|---|---|---|---|---|---|
| 老叶 Old leaf (kg·m-2) | 新叶 New leaf (kg·m-2) | 老叶 Old leaf (kg·m-2) | 新叶 New leaf (kg·m-2) | 总叶 Leaf (kg·m-2) | |
| 湿地松林SPP | 0.372 | 0.427 | 0.010 | 0.013 | 0 |
| 马尾松林MPP | 0.042 | 0.048 | 0.192 | 0.245 | 0 |
| 杉木林CFP | 0.053 | 0.061 | 0 | 0 | 0.458 |
| 针叶混交林CMP | 0.192 | 0.221 | 0.111 | 0.142 | 0.012 |
| 树种 Species | 叶形 Shape | 叶龄 Age | 半比表面积 SHA (m2·kg-1) | 叶长 Length (cm) | 直径 Diameter (mm) | 干重 Weight (g) | 样本量 Sample size |
|---|---|---|---|---|---|---|---|
| 湿地松 Pinus elliotii | 两针 Two-needle | 老叶Old leaf | 5.39 | 20.7 | 1.49 | 0.15 | 8 |
| 新叶New leaf | 6.17 | 20.0 | 1.50 | 0.12 | 9 | ||
| 三针 Three-needle | 老叶Old leaf | 5.73 | 22.9 | 1.71 | 0.21 | 12 | |
| 新叶New leaf | 6.67 | 19.8 | 1.68 | 0.15 | 11 | ||
| 马尾松 P. massoniana | 两针 Two-needle | 老叶Old leaf | 6.40 | 15.9 | 0.85 | 0.06 | 20 |
| 新叶*New leaf | 10.35 | 12.1 | 0.90 | 0.03 | 9 | ||
| 杉木 Cunninghamia lanceolata | 披针叶 Lanceolate | 混合叶 Mixed leaf | 7.91 | — | — | — | 10 |
表3 各树种的叶片参数
Table 3 Leaf parameters of three species
| 树种 Species | 叶形 Shape | 叶龄 Age | 半比表面积 SHA (m2·kg-1) | 叶长 Length (cm) | 直径 Diameter (mm) | 干重 Weight (g) | 样本量 Sample size |
|---|---|---|---|---|---|---|---|
| 湿地松 Pinus elliotii | 两针 Two-needle | 老叶Old leaf | 5.39 | 20.7 | 1.49 | 0.15 | 8 |
| 新叶New leaf | 6.17 | 20.0 | 1.50 | 0.12 | 9 | ||
| 三针 Three-needle | 老叶Old leaf | 5.73 | 22.9 | 1.71 | 0.21 | 12 | |
| 新叶New leaf | 6.67 | 19.8 | 1.68 | 0.15 | 11 | ||
| 马尾松 P. massoniana | 两针 Two-needle | 老叶Old leaf | 6.40 | 15.9 | 0.85 | 0.06 | 20 |
| 新叶*New leaf | 10.35 | 12.1 | 0.90 | 0.03 | 9 | ||
| 杉木 Cunninghamia lanceolata | 披针叶 Lanceolate | 混合叶 Mixed leaf | 7.91 | — | — | — | 10 |
| 群落类型 Forest type | 湿地松 Slash pine | 马尾松 Masson pine | 杉木 Chinese fir | 总计 Total | ||
|---|---|---|---|---|---|---|
| 老叶 Old leaf | 新叶 New leaf | 老叶 Old leaf | 新叶 New leaf | 总叶 All leaf | ||
| 湿地松林SPP | 2.08 | 2.75 | 0.06 | 0.14 | 0 | 5.03 |
| 马尾松林MPP | 0.23 | 0.31 | 1.23 | 2.54 | 0 | 4.31 |
| 杉木林CFP | 0.30 | 0.39 | 0 | 0 | 3.62 | 4.31 |
| 针叶混交林CMP | 1.07 | 1.42 | 0.71 | 1.47 | 0.09 | 4.77 |
表4 4种林分中各组分的叶面积指数
Table 4 Leaf area index of each component in four forests
| 群落类型 Forest type | 湿地松 Slash pine | 马尾松 Masson pine | 杉木 Chinese fir | 总计 Total | ||
|---|---|---|---|---|---|---|
| 老叶 Old leaf | 新叶 New leaf | 老叶 Old leaf | 新叶 New leaf | 总叶 All leaf | ||
| 湿地松林SPP | 2.08 | 2.75 | 0.06 | 0.14 | 0 | 5.03 |
| 马尾松林MPP | 0.23 | 0.31 | 1.23 | 2.54 | 0 | 4.31 |
| 杉木林CFP | 0.30 | 0.39 | 0 | 0 | 3.62 | 4.31 |
| 针叶混交林CMP | 1.07 | 1.42 | 0.71 | 1.47 | 0.09 | 4.77 |
| [1] |
Battaglia M, Cherry ML, Beadle CL, Sands PJ, Hingston A (1998). Prediction of leaf area index in eucalypt plantations: effects of water stress and temperature. Tree Physiology, 18,521-528.
DOI URL PMID |
| [2] | Bonan GB (1993). Importance of leaf area index and forest type when estimating photosynthesis in boreal forests. Remote Sensing of Environment, 43,303-314. |
| [3] | Bruce WN, Rita M, Jorge LGP, Silas GAS, Getulio TB, Luciana BC (1999). Allometric regressions for improved estimate of secondary forest biomass in the central Amazon. Forest Ecology and Management, 117,149-167. |
| [4] | Chen JM, Black TA (1992). Defining leaf area index for non-flat leaves. Plant, Cell and Environment, 15,421-429. |
| [5] | Cheng T (程彤), Li JY (李家永) (1998). Studies on ecosystem restoration and sustainable development of agriculture in red earth hilly area. Resources Science(资源科学), 20,1-9. (in Chinese with English abstract) |
| [6] | Clough BF, Scott K (1989). Allometric relationships for estimating above-ground biomass in six mangrove species. Forest Ecology and Management, 27,117-127. |
| [7] | Cornelissen JHC, Diez PC, Hunt R (1996). Seedling growth, allocation and leaf attributes in a wide range of woody plant species and types. Journal of Ecology, 84,755-765. |
| [8] |
Dufrêne E, Bréda N (1995). Estimation of deciduous forest leaf-area index using direct and indirect methods. Oecologia, 104,156-162.
DOI URL PMID |
| [9] |
Ellsworth DS, Reich PB (1993). Canopy structure and vertical patterns of photosynthesis and related leaf traits in a deciduous forest. Oecologia, 96,169-178.
DOI URL PMID |
| [10] | Gower ST, Kucharik CJ, Norman JM (1999). Direct and indirect estimation of leaf area index, fAPAR, and net primary production of terrestrial ecosystems. Remote Sensing of Environment, 70,29-51. |
| [11] | Grier CC, Waring RH (1974). Conifer foliage mass related to sapwood area. Forest Science, 20,205-206. |
| [12] | Jonckheere I, Fleck S, Nackaerts K, Muys B, Coppin P, Weiss M (2004). Review of methods for in situ leaf area index determination. Part I. Theories, sensors and hemispherical photography. |
| [13] | Li XR (李轩然), Liu QJ (刘琪璟), Cai Z (蔡哲), Ma ZQ (马泽清) (2006). Leaf area index measurement of Pinus elliotii plantation. Acta Ecologica Sinica (生态学报). (in press) |
| [14] | Agricultural and Forest Meteorology, 121,19-35. |
| [15] |
Kørner C (1989). The nutritional status of plants from high altitudes. Oecologia, 81,379-391.
URL PMID |
| [16] | Kussner R, Mosandl R (2000). Comparison of direct and indirect estimation of leaf area index in mature Norway spruce stands of eastern Germany. Canadian Journal of Forest Research, 30,440-447. |
| [17] | Landsberg JJ, Gower ST (1997). Applications of Physiological Ecology to Forest Management. Academic, San Diego, 354. |
| [18] | Liu QJ (刘琪璟), Hu LL (胡理乐), Li XR (李轩然) (2005). Plant diversity in Qianyanzhou after 20 years of small watershed treatment. Acta Phytoecologica Sinica (植物生态学报), 29,766-774. (in Chinese with English abstract) |
| [19] | Luo ZM (洛知萌), Tian QJ (田庆久), Hui FM (惠凤鸣) (2005). Retrieving leaf area indexes for coniferous forest in Xingguo County, Jiangxi Province, in use of landsat ETM + images. Journal of Nanjing University (南京大学学报), 41,253-258. (in Chinese with English abstract) |
| [20] | McShane MC, Carlile DW, Hinds WT (1993). The effect of collector size on forest litter-fall collection and analysis. Canadian Journal of Forest Research, 13,1037-1042. |
| [21] |
Mooney HA, Field C, Gulmon SL, Bazzaz FA (1981). Photosynthetic capacity in relation to leaf position in desert versus old-field annuals. Oecologia, 50,109-112.
DOI URL PMID |
| [22] | Neter J, Wasserman W (1974). Applied Linear Statistical Models. Irwin Inc, Homewood, Illinois, USA, 357. |
| [23] | Pyankov V, Kondratchuk A, Shipley B (1999). Leaf structure and specific leaf mass: the alpine desert plants of the eastern Pamirs (Tadjikistan). New Phytologist, 143,131-142. |
| [24] | Reich PB, Koike T, Gower ST, Schoettle AW (1995). Causes and consequences of variation in conifer leaf life-span. In: Smith WK, Hinckley TM eds. Ecophysiology of Conifers. Academic, San Diego,225-254. |
| [25] |
Reich PB, Uhl C, Walters MB, Ellsworth DS (1991). Leaf lifespan as a determinant of leaf structure and function among 23 amazonian tree species. Oecologia, 86,16-24.
DOI URL PMID |
| [26] | Reich PB, Walters MB, Ellsworth DS (1997). From tropics to tundra: global convergence in plant functioning. Proceedings of the National Academy of Science, 94,13730-13734. |
| [27] | Ren H (任海), Peng SL (彭少麟) (1997). Comparison of methods of estimation leaf area index in Dinghushan forests. Acta Ecologica Sinica (生态学报), 17,220-223. (in Chinese with English abstract) |
| [28] | Schulze ED, Kelliher FM, Kørner C, Lloyd J, Leuning R (1994). Relationship among maximum stomatal conductance, ecosystem surface conductance, carbon assimilation rate, and plant nitrogen nutrition: a global ecology scaling exercise. Annual Review of Ecology and Systematics, 25,629-660. |
| [29] | Scientific Investigation Team of the Chinese Academy of Sciences for Southern Mountainous Areas (中国科学院南方山区综合科学考察队)(1989). Management and Development of Red Hilly Area — Experimental Study in Qianyanzhou(红壤丘陵开发和治理—千烟洲综合开发治理试验研究). Science Press, Beijing, 1-23. (in Chinese) |
| [30] | Shinozaki K, Yoda K, Hozumi K (1964). A quantitative analysis of plant form: the pipe model theory. Japanese Journal of Ecology, 14,97-105. |
| [31] | Shipley B, Almeida-Cortez J (2003). Interspecific consistency and intraspecific variability of specific leaf area with respect to irradiance and nutrient availability. Écoscience, 10,74-79. |
| [32] | Shipley B, Lechowicz MJ (2000). The functional coordination of leaf morphology, nitrogen concentration, and gas exchange in 40 wetland plant species. Écoscience, 7,183-194. |
| [33] | Watson DJ (1947). Comparative physiological studies in the growth of field crops. I. Variation in net assimilation rate and leaf area between species and varieties, and within and between years. Annales Botanici Fennici, 11,41-76. |
| [34] | Westoby M (1998). A leaf-height-seed (LHS) plant ecology strategy scheme. Plant and Soil, 199,213-227. |
| [35] | Whittaker RH, Marks PL (1975). Methods for assessing terrestrial productivity. In: Lieth H, Whittaker RH eds. Primary Productivity of the Biosphere. Springer, New York,55-118. |
| [36] |
Wright IJ, Wearoby M (2000). Cross-species relationship between seedling relative growth rate, nitrogen productivity and root vs. leaf function in 28 Australian woody species. Functional Ecology, 14,97-107.
DOI URL |
| [37] | Wu HG (武红敢), Qiao YY (乔彦友), Yan XJ (严小君), Chen LH (陈林洪), Chen Y (陈雁) (1995). Green biomass and leaf area index of young Masson pine forest in western Zhejiang mountains. Journal of Zhejiang Forestry College (浙江林学院学报), 12,253-257. (in Chinese with English abstract) |
| [38] | Xi JC (席建超), Zhang HQ (张红旗), Zhang ZQ(张志强) (2004). Retrieving effective leaf area index of conifer forests using Landsat TM images. Journal of Beijing Forestry University (北京林业大学学报), 26(6),36-39. (in Chinese with English abstract) |
| [39] | Zhang HQ (张红旗), Chen YR (陈永瑞), Niu D (牛栋) (2004). Retrieving effective leaf area index of conifer forests using Landsat TM images in red soil hilly region. Acta Agriculturae Universitatis Jiangxiensis (江西农业大学学报), 26,159-163. (in Chinese with English abstract) |
| [40] | Zhang L (张林), Luo TX (罗天祥) (2004). Advances in ecological studies on leaf lifespan and associated leaf traits. Acta Phytoecologica Sinica (植物生态学报), 28,844-852. (in Chinese with English abstract) |
| [41] | Zhou YY (周宇宇), Tang SH (唐世浩), Zhu QJ (朱启疆), Li JT (李江涛), Sun R (孙睿), Liu SH (刘素红) (2003). Measurement of LAI in Changbai Mountains Nature Reserve and its result. Resources Science (资源科学), 25(6),38-42. (in Chinese with English abstract) |
| [42] | Zou CJ (邹春静), Bu J (卜军), Xu WD (徐文铎) (1995). Characters of needles and their variation in Pinus sylvestriformis population. Chinese Journal of Ecology (生态学杂志), 14(2),18-22. (in Chinese with English abstract) |
| [1] | 王袼, 胡姝娅, 李阳, 陈晓鹏, 李红玉, 董宽虎, 何念鹏, 王常慧. 不同类型草原土壤净氮矿化速率的温度敏感性[J]. 植物生态学报, 2024, 48(4): 523-533. |
| [2] | 梁逸娴, 王传宽, 臧妙涵, 上官虹玉, 刘逸潇, 全先奎. 落叶松径向生长和生物量分配对气候变暖的响应[J]. 植物生态学报, 2024, 48(4): 459-468. |
| [3] | 黄玲, 王榛, 马泽, 杨发林, 李岚, SEREKPAYEV Nurlan, NOGAYEV Adilbek, 侯扶江. 长期放牧和氮添加对黄土高原典型草原长芒草种群生长的影响[J]. 植物生态学报, 2024, 48(3): 317-330. |
| [4] | 耿雪琪, 唐亚坤, 王丽娜, 邓旭, 张泽凌, 周莹. 氮添加增加中国陆生植物生物量并降低其氮利用效率[J]. 植物生态学报, 2024, 48(2): 147-157. |
| [5] | 李娜, 唐士明, 郭建英, 田茹, 王姗, 胡冰, 罗永红, 徐柱文. 放牧对内蒙古草地植物群落特征影响的meta分析[J]. 植物生态学报, 2023, 47(9): 1256-1269. |
| [6] | 赵艳超, 陈立同. 土壤养分对青藏高原高寒草地生物量响应增温的调节作用[J]. 植物生态学报, 2023, 47(8): 1071-1081. |
| [7] | 苏炜, 陈平, 吴婷, 刘岳, 宋雨婷, 刘旭军, 刘菊秀. 氮添加与干季延长对降香黄檀幼苗非结构性碳水化合物、养分与生物量的影响[J]. 植物生态学报, 2023, 47(8): 1094-1104. |
| [8] | 李冠军, 陈珑, 余雯静, 苏亲桂, 吴承祯, 苏军, 李键. 固体培养内生真菌对土壤盐胁迫下木麻黄幼苗渗透调节和抗氧化系统的影响[J]. 植物生态学报, 2023, 47(6): 804-821. |
| [9] | 吴帆, 吴晨, 张宇辉, 余恒, 魏智华, 郑蔚, 刘小飞, 陈仕东, 杨智杰, 熊德成. 增温对成熟杉木人工林不同季节细根生长、形态及生理代谢特征的影响[J]. 植物生态学报, 2023, 47(6): 856-866. |
| [10] | 罗娜娜, 盛茂银, 王霖娇, 石庆龙, 何宇. 长期植被恢复对中国西南喀斯特石漠化土壤活性有机碳组分含量和酶活性的影响[J]. 植物生态学报, 2023, 47(6): 867-881. |
| [11] | 郑炀, 孙学广, 熊洋阳, 袁贵云, 丁贵杰. 叶际微生物对马尾松凋落针叶分解的影响[J]. 植物生态学报, 2023, 47(5): 687-698. |
| [12] | 杜英东, 袁相洋, 冯兆忠. 不同形态氮对杨树光合特性及生长的影响[J]. 植物生态学报, 2023, 47(3): 348-360. |
| [13] | 和璐璐, 张萱, 章毓文, 王晓霞, 刘亚栋, 刘岩, 范子莹, 何远洋, 席本野, 段劼. 辽东山区不同坡向长白落叶松人工林树冠特征与林木生长关系[J]. 植物生态学报, 2023, 47(11): 1523-1539. |
| [14] | 刘艳杰, 刘玉龙, 王传宽, 王兴昌. 东北温带森林5个羽状复叶树种叶成本-效益关系比较[J]. 植物生态学报, 2023, 47(11): 1540-1550. |
| [15] | 郝晴, 黄昌. 森林地上生物量遥感估算研究综述[J]. 植物生态学报, 2023, 47(10): 1356-1374. |
| 阅读次数 | ||||||
|
全文 |
|
|||||
|
摘要 |
|
|||||
Copyright © 2022 版权所有 《植物生态学报》编辑部
地址: 北京香山南辛村20号, 邮编: 100093
Tel.: 010-62836134, 62836138; Fax: 010-82599431; E-mail: apes@ibcas.ac.cn, cjpe@ibcas.ac.cn
备案号: 京ICP备16067583号-19