
植物生态学报 ›› 2009, Vol. 33 ›› Issue (4): 791-801.DOI: 10.3773/j.issn.1005-264x.2009.04.018
田永超, 杨杰, 姚霞, 朱艳, 曹卫星*( )
)
收稿日期:2008-12-04
修回日期:2009-03-15
出版日期:2009-12-04
发布日期:2009-07-30
通讯作者:
曹卫星
作者简介:*(caow@njau.edu.cn)基金资助:
TIAN Yong-Chao, YANG Jie, YAO Xia, ZHU Yan, CAO Wei-Xing*()
Received:2008-12-04
Revised:2009-03-15
Online:2009-12-04
Published:2009-07-30
Contact:
CAO Wei-Xing
摘要:
研究红边面积参数与叶层氮素状况的定量关系, 有助于水稻(Oryza sativa)生长信息的实时无损获取及精确追氮管理。该研究基于多年不同施氮水平和不同水稻品种的冠层高光谱数据, 系统分析了水稻的红边区域光谱、面积形状特征及其与叶层氮浓度的定量关系。结果表明, 水稻冠层红边区域微分光谱随不同氮素水平变化出现“三峰”现象, 峰值分别出现在700、720和730 nm附近, 且3个波段的峰值高低发生交替变化; 同时, 以3个峰值波段为中心与x坐标轴组成的微分光谱面积和形状相应发生变化。发现基于两两峰值波段划分所得红边子面积所构成的比值(双峰对称度)、归一化差值(归一化对称度)参数与叶层氮浓度具有密切的定量关系, 可作为估测水稻叶层氮浓度的红边面积形状参数。经曲线拟合和模型检验的结果显示, 双峰对称度DPS (A675-700, A675-755), 即由675~700 nm区域面积与675~755 nm区域面积的比值, 和DPS (A730-755,A675-700) (由730~755 nm区域面积和675~700 nm区域面积的比值)对水稻叶层氮浓度的估测效果最好, 可用于不同水稻品种和生长条件下的叶层氮浓度估测。
田永超, 杨杰, 姚霞, 朱艳, 曹卫星. 利用红边面积形状参数估测水稻叶层氮浓度. 植物生态学报, 2009, 33(4): 791-801. DOI: 10.3773/j.issn.1005-264x.2009.04.018
TIAN Yong-Chao, YANG Jie, YAO Xia, ZHU Yan, CAO Wei-Xing. ESTIMATION OF LEAF CANOPY NITROGEN CONCENTRATION WITH RED EDGE AREA SHAPE PARAMETER IN RICE. Chinese Journal of Plant Ecology, 2009, 33(4): 791-801. DOI: 10.3773/j.issn.1005-264x.2009.04.018
| 试验和年份 Experiment & year | 品种 Cultivar | 施氮水平 Nitrogen rate (kg N·hm-2) | 小区面积 Plot area | 采样日期 Sampling date (month / day) | 数据用途 Data using | |
|---|---|---|---|---|---|---|
| 试验1 Exp.1 | 2004 | ‘武香粳9号’ WXJ 9 | 0, 105, 210, 315 | 18 m2 (4 m×4.5 m) | 9/2, 9/12, 9/23, 9/30,10/12 | 模型检验 Model validation |
| ‘华粳2号’ HJ 2 | 8/27, 9/2, 9/11, 9/23, 9/30 | |||||
| ‘日本晴’ NPB | 8/27, 9/2, 9/11, 9/23 | |||||
| 试验2 Exp.2 | 2005 | ‘武香粳14号’ WXJ 14 | 0, 90, 270, 420 | 31.5 m2 (3.5 m×9 m) | 7/15, 8/9, 8/16, 9/5, 9/13, 9/29, 10/10,10/23 | 建模 Model calibration |
| 27123 | ||||||
| 试验3 Exp.3 | 2006 | ‘武香粳14号’ WXJ 14 | 0, 90, 270, 405 | 25 m2 (5.0 m×5.0 m) | 7/28, 8/9, 8/18, 9/7, 9/17, 9/25, 10/5 | 建模 Model calibration |
| ‘27123’ | ||||||
| 试验4 Exp.4 | 2006 | ‘盐粳9967’ YJ 9967 | 0, 105, 210, 315, 420 | 8 100 m2 (90 m×90 m) | 7/29, 9/10 | 模型检验 Model validation |
| 试验5 Exp.5 | 2007 | ‘扬辐粳8号’ YFJ 8 | 0, 210, 420 | 8 100 m2 (90 m×90 m) | 9/8, 10/9 | 模型检验 Model validation |
表1 田间试验基本情况及采样时间
Table 1 Seasons, cultivars, nitrogen rates and sampling dates in five field experiments
| 试验和年份 Experiment & year | 品种 Cultivar | 施氮水平 Nitrogen rate (kg N·hm-2) | 小区面积 Plot area | 采样日期 Sampling date (month / day) | 数据用途 Data using | |
|---|---|---|---|---|---|---|
| 试验1 Exp.1 | 2004 | ‘武香粳9号’ WXJ 9 | 0, 105, 210, 315 | 18 m2 (4 m×4.5 m) | 9/2, 9/12, 9/23, 9/30,10/12 | 模型检验 Model validation |
| ‘华粳2号’ HJ 2 | 8/27, 9/2, 9/11, 9/23, 9/30 | |||||
| ‘日本晴’ NPB | 8/27, 9/2, 9/11, 9/23 | |||||
| 试验2 Exp.2 | 2005 | ‘武香粳14号’ WXJ 14 | 0, 90, 270, 420 | 31.5 m2 (3.5 m×9 m) | 7/15, 8/9, 8/16, 9/5, 9/13, 9/29, 10/10,10/23 | 建模 Model calibration |
| 27123 | ||||||
| 试验3 Exp.3 | 2006 | ‘武香粳14号’ WXJ 14 | 0, 90, 270, 405 | 25 m2 (5.0 m×5.0 m) | 7/28, 8/9, 8/18, 9/7, 9/17, 9/25, 10/5 | 建模 Model calibration |
| ‘27123’ | ||||||
| 试验4 Exp.4 | 2006 | ‘盐粳9967’ YJ 9967 | 0, 105, 210, 315, 420 | 8 100 m2 (90 m×90 m) | 7/29, 9/10 | 模型检验 Model validation |
| 试验5 Exp.5 | 2007 | ‘扬辐粳8号’ YFJ 8 | 0, 210, 420 | 8 100 m2 (90 m×90 m) | 9/8, 10/9 | 模型检验 Model validation |
| 红边面积参数 Red edge area index | 算法 Algorithm | 文献出处 Reference |
|---|---|---|
| 625~795 nm 波段范围一阶导数光谱面积 Sum of FD between 625 and 795 nm | R795-R625 | Elvidge & Chen, 1995 |
| 680~780 nm 波段范围一阶导数光谱面积 Sum of FD between 680 and 780 nm | R780-R680 | Filella & Pennelas, 1994 |
| 红边与红谷面积比值 Ratio of red edge to red vale | Ared edge/Ared vale | Maccioni et al. 2001 |
| 双差指数 DD | (R(a+Δ) -Ra)- (R(b+Δ)-Rb) | Maire et al. 2004 |
| 归一化双峰指数 NDPS (Aa-b, Ac-d) | $\frac{\left(R_{a}-R_{b}\right)-\left(R_{c}-R_{d}\right)}{\left(R_{a}-R_{b}\right)+\left(R_{c}-R_{d}\right)}$ | The present study |
| 双峰对称度 DPS (Aa-b, Ac-d) | (Ra-Rb) / (Rc-Rd) | The present study |
表2 红边面积参数及出处
Table 2 Algorithm and references of different spectral area indices
| 红边面积参数 Red edge area index | 算法 Algorithm | 文献出处 Reference |
|---|---|---|
| 625~795 nm 波段范围一阶导数光谱面积 Sum of FD between 625 and 795 nm | R795-R625 | Elvidge & Chen, 1995 |
| 680~780 nm 波段范围一阶导数光谱面积 Sum of FD between 680 and 780 nm | R780-R680 | Filella & Pennelas, 1994 |
| 红边与红谷面积比值 Ratio of red edge to red vale | Ared edge/Ared vale | Maccioni et al. 2001 |
| 双差指数 DD | (R(a+Δ) -Ra)- (R(b+Δ)-Rb) | Maire et al. 2004 |
| 归一化双峰指数 NDPS (Aa-b, Ac-d) | $\frac{\left(R_{a}-R_{b}\right)-\left(R_{c}-R_{d}\right)}{\left(R_{a}-R_{b}\right)+\left(R_{c}-R_{d}\right)}$ | The present study |
| 双峰对称度 DPS (Aa-b, Ac-d) | (Ra-Rb) / (Rc-Rd) | The present study |
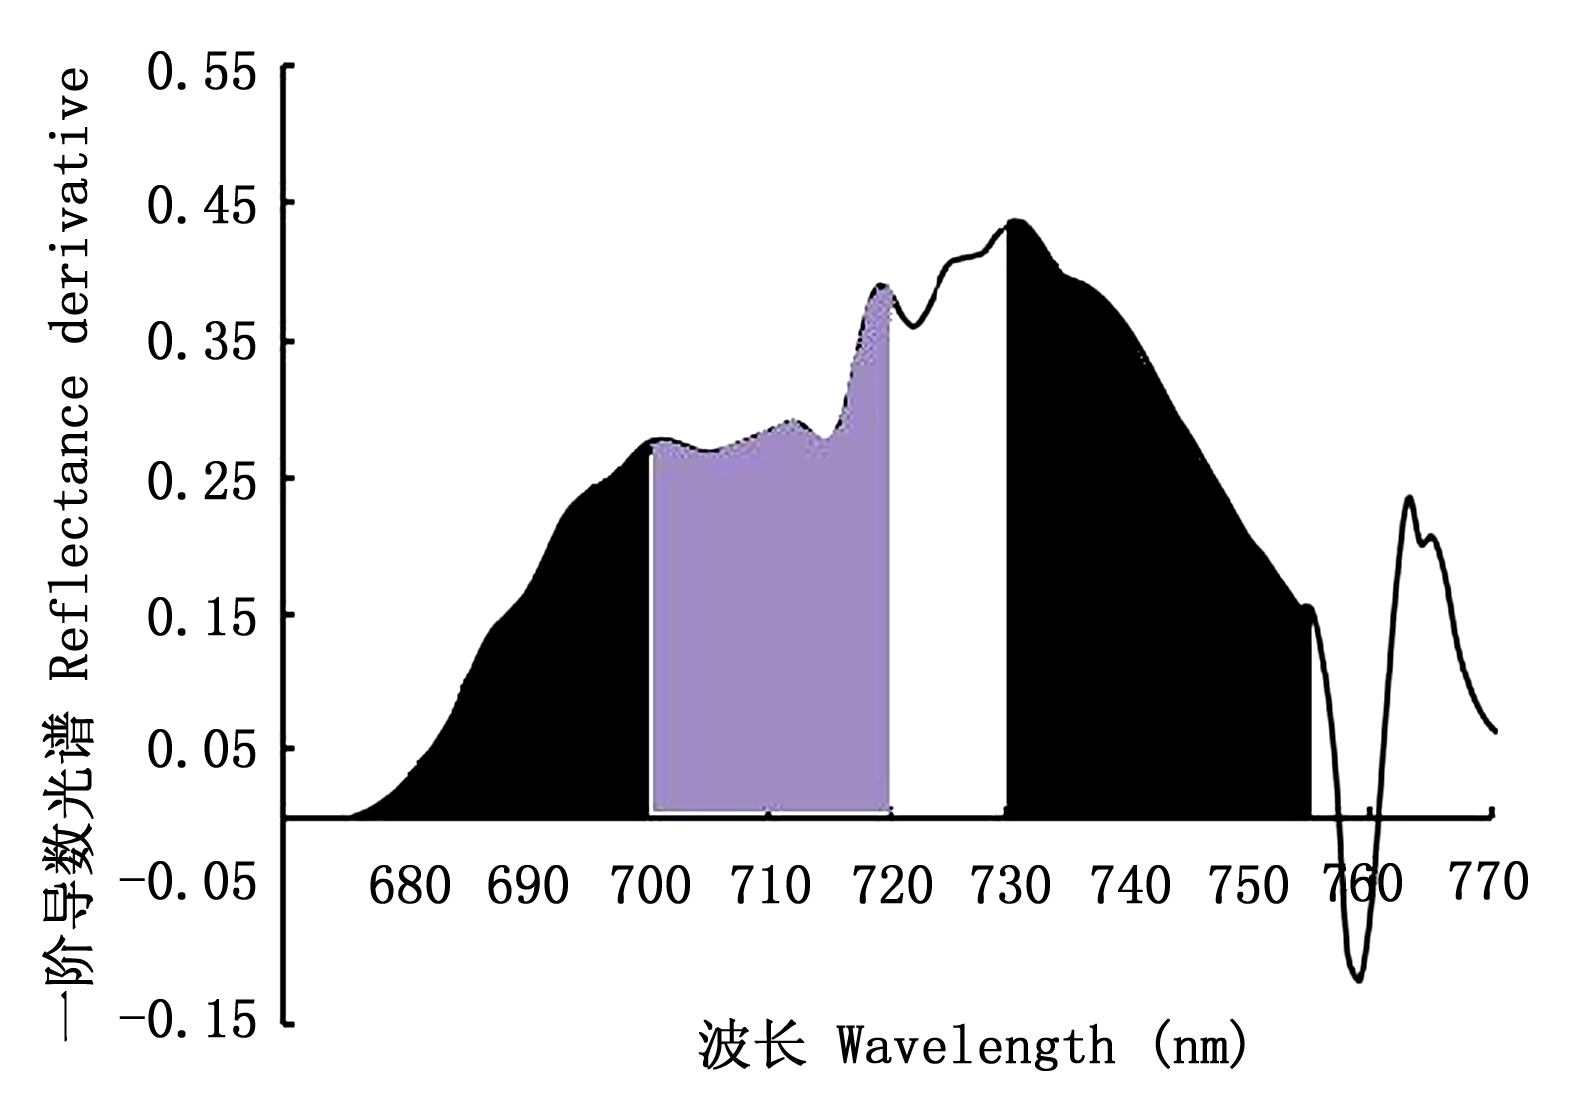
图1 基于峰值波段划分红边子面积示意图
Fig. 1 Schematic representation of red edge sub-areas divided by peak bands
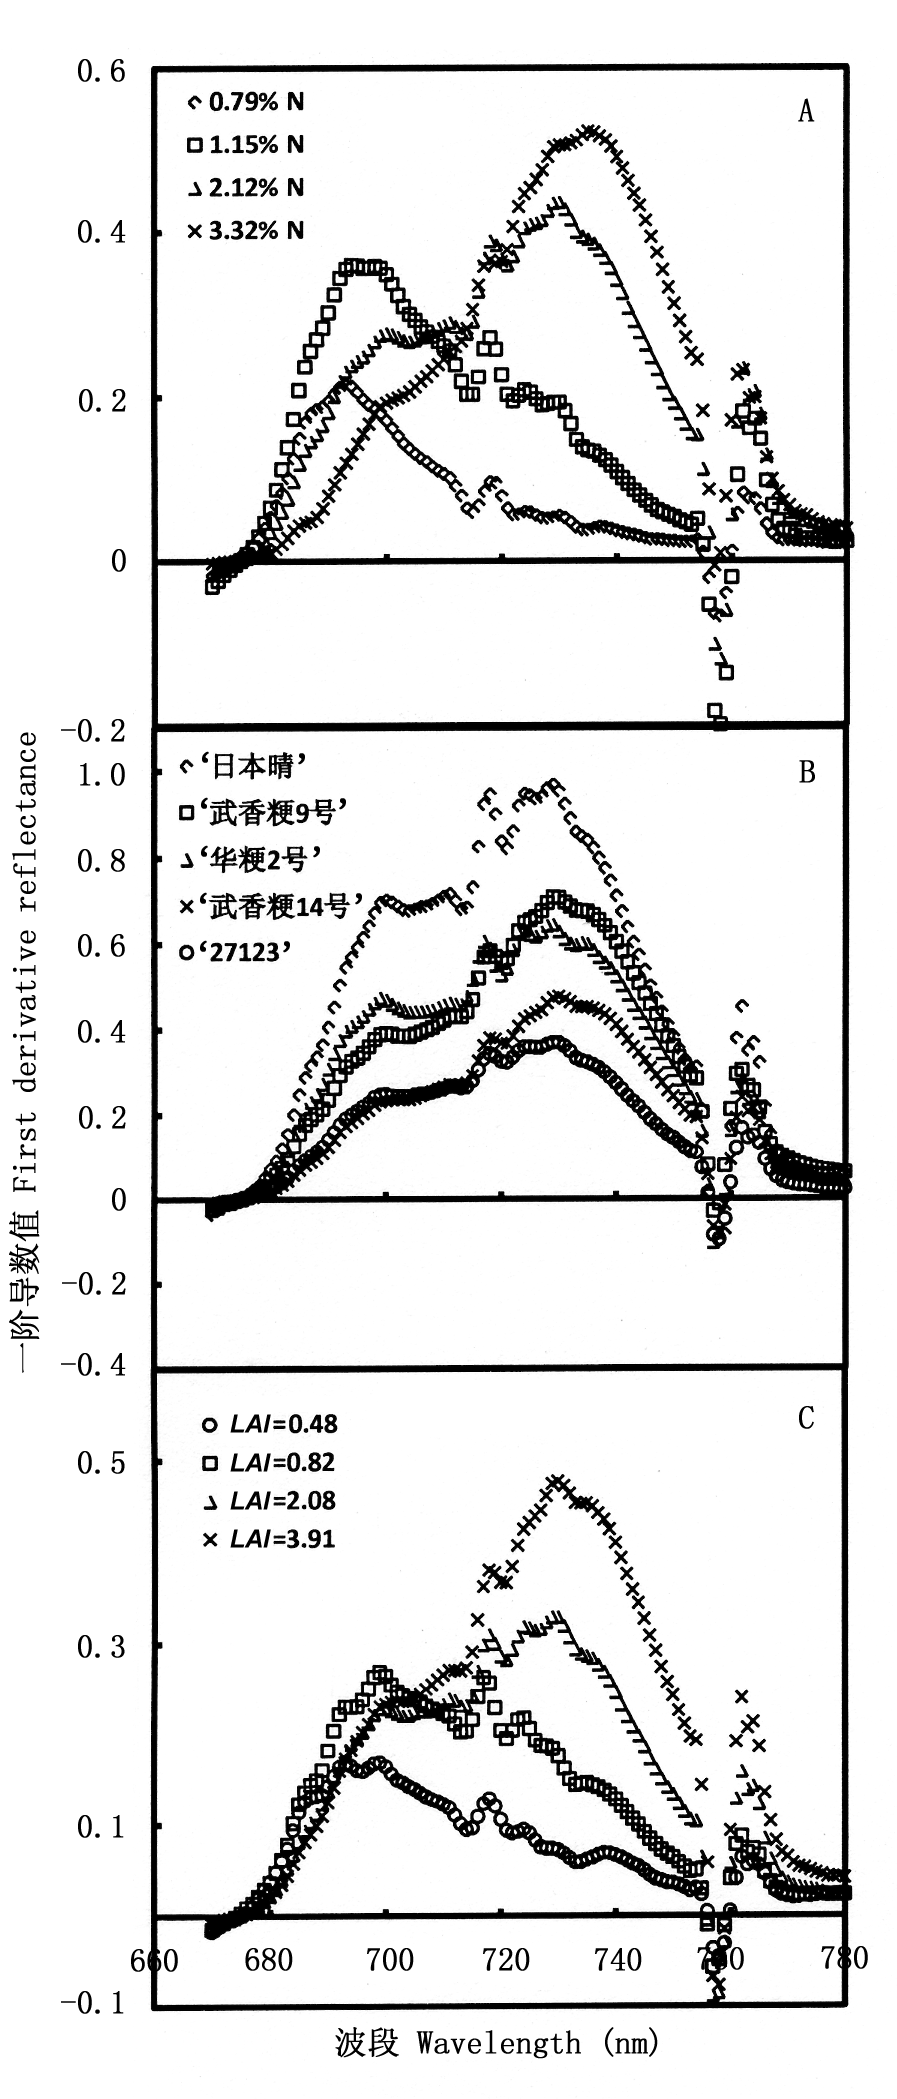
图2 不同氮素水平(A)、水稻品种(B)和叶面积指数(C)的红边区域导数光谱特征
Fig. 2 Characteristics of first-derivative spectra in red edge area under different nitrogen levels (A) and rice varieties (B) and leaf area indices (LAI) (C)
| 参数 Parameter | 模型形式 Model type | R2 | 根均方差 RMSE (%) | 平均相对误差 RE |
|---|---|---|---|---|
| DPS (A730-755, A675-700) | 直线 Linear | 0.76 | 14.00 | 0.11 |
| 曲线 Curve | 0.81 | 10.11 | 0.09 | |
| DD (A730-755, A675-700) | 直线 Linear | 0.72 | 19.82 | 0.15 |
| NDPS (A730-755, A675-700) | 直线 Linear | 0.80 | 10.00 | 0.09 |
| DPS (A675-700, A700-755) | 直线 Linear | 0.78 | 12.10 | 0.11 |
| 曲线 Curve | 0.82 | 10.26 | 0.09 | |
| DD (A675-700, A700-755) | 直线 Linear | 0.58 | 23.63 | 0.19 |
| NDPS (A675-700, A700-755) | 直线 Linear | 0.80 | 10.51 | 0.09 |
| 曲线 Curve | 0.81 | 9.95 | 0.09 | |
| DPS (A675-730, A730-755) | 曲线 Curve | 0.77 | 10.40 | 0.09 |
| DD (A675-730, A730-755) | 直线 Linear | 0.59 | 22.08 | 0.16 |
| NDPS (A675-730, A730-755) | 直线 Linear | 0.77 | 11.13 | 0.10 |
| DPS (A675-720, A720-755) | 曲线 Curve | 0.79 | 10.78 | 0.14 |
| DD (A675-720, A720-755) | 直线 Linear | 0.74 | 18.10 | 0.09 |
| NDPS (A675-720, A720-755) | 直线 Linear | 0.79 | 10.23 | 0.09 |
| DPS (A720-730, A700-720) | 直线 Linear | 0.77 | 11.24 | 0.10 |
| DPS1 (A700-720, A700-730) | 直线 Linear | 0.77 | 10.60 | 0.09 |
| DD (A720-730, A700-720) | 直线 Linear | 0.49 | 25.22 | 0.18 |
| NDPS (A720-730, A700-720) | 直线 Linear | 0.77 | 10.60 | 0.09 |
| DPS (A675-720, A675-755) | 直线 Linear | 0.79 | 11.19 | 0.10 |
| DPS (A675-730, A675-755) | 直线 Linear | 0.77 | 10.51 | 0.09 |
| DPS (A675-700, A675-755) | 直线 Linear | 0.80 | 10.51 | 0.09 |
| 曲线 Curve | 0.81 | 9.95 | 0.09 | |
| Ared edge/Ared vale | 曲线 Curve | 0.54 | 13.54 | 0.12 |
| R795-R625 | 直线 Linear | 0.39 | 23.59 | 0.19 |
| R780-R680 | 直线 Linear | 0.41 | 23.94 | 0.20 |
表4 基于双峰红边面积参数的水稻叶层氮浓度监测模型的检验(n=251)
Table 4 Validation results of leaf canopy nitrogen concentration monitoring models based on different red edge area shape parameters in Oryza sativa (n=251)
| 参数 Parameter | 模型形式 Model type | R2 | 根均方差 RMSE (%) | 平均相对误差 RE |
|---|---|---|---|---|
| DPS (A730-755, A675-700) | 直线 Linear | 0.76 | 14.00 | 0.11 |
| 曲线 Curve | 0.81 | 10.11 | 0.09 | |
| DD (A730-755, A675-700) | 直线 Linear | 0.72 | 19.82 | 0.15 |
| NDPS (A730-755, A675-700) | 直线 Linear | 0.80 | 10.00 | 0.09 |
| DPS (A675-700, A700-755) | 直线 Linear | 0.78 | 12.10 | 0.11 |
| 曲线 Curve | 0.82 | 10.26 | 0.09 | |
| DD (A675-700, A700-755) | 直线 Linear | 0.58 | 23.63 | 0.19 |
| NDPS (A675-700, A700-755) | 直线 Linear | 0.80 | 10.51 | 0.09 |
| 曲线 Curve | 0.81 | 9.95 | 0.09 | |
| DPS (A675-730, A730-755) | 曲线 Curve | 0.77 | 10.40 | 0.09 |
| DD (A675-730, A730-755) | 直线 Linear | 0.59 | 22.08 | 0.16 |
| NDPS (A675-730, A730-755) | 直线 Linear | 0.77 | 11.13 | 0.10 |
| DPS (A675-720, A720-755) | 曲线 Curve | 0.79 | 10.78 | 0.14 |
| DD (A675-720, A720-755) | 直线 Linear | 0.74 | 18.10 | 0.09 |
| NDPS (A675-720, A720-755) | 直线 Linear | 0.79 | 10.23 | 0.09 |
| DPS (A720-730, A700-720) | 直线 Linear | 0.77 | 11.24 | 0.10 |
| DPS1 (A700-720, A700-730) | 直线 Linear | 0.77 | 10.60 | 0.09 |
| DD (A720-730, A700-720) | 直线 Linear | 0.49 | 25.22 | 0.18 |
| NDPS (A720-730, A700-720) | 直线 Linear | 0.77 | 10.60 | 0.09 |
| DPS (A675-720, A675-755) | 直线 Linear | 0.79 | 11.19 | 0.10 |
| DPS (A675-730, A675-755) | 直线 Linear | 0.77 | 10.51 | 0.09 |
| DPS (A675-700, A675-755) | 直线 Linear | 0.80 | 10.51 | 0.09 |
| 曲线 Curve | 0.81 | 9.95 | 0.09 | |
| Ared edge/Ared vale | 曲线 Curve | 0.54 | 13.54 | 0.12 |
| R795-R625 | 直线 Linear | 0.39 | 23.59 | 0.19 |
| R780-R680 | 直线 Linear | 0.41 | 23.94 | 0.20 |
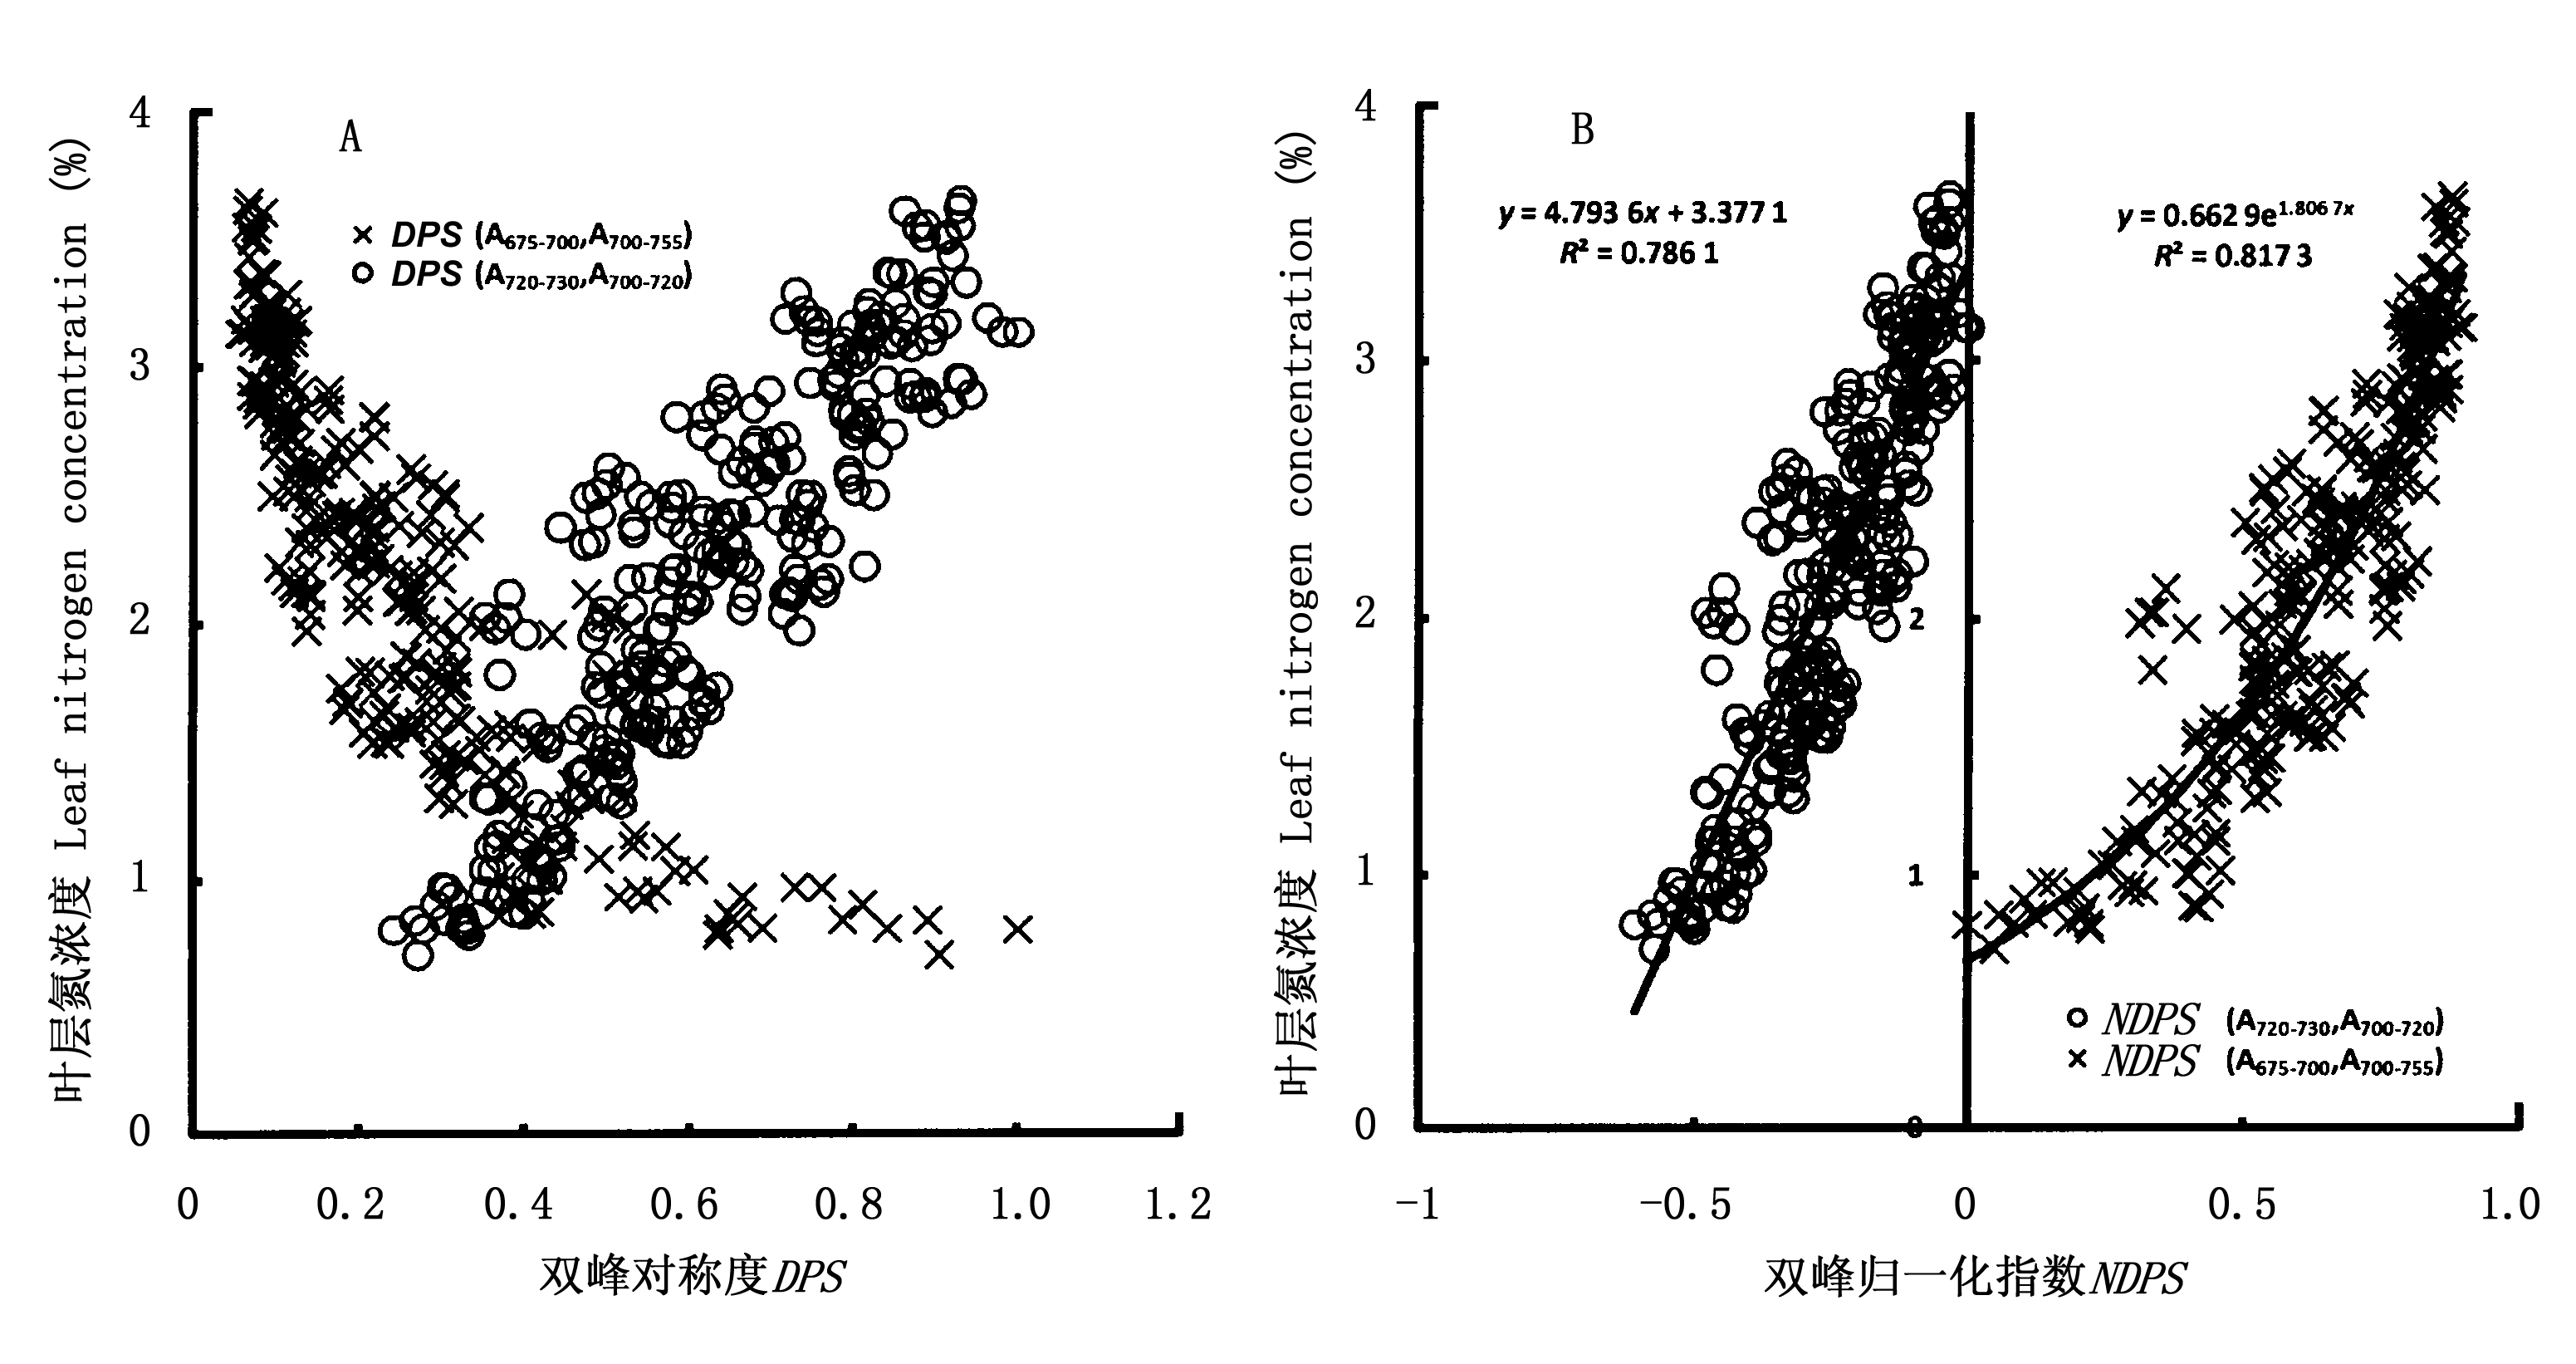
图4 双峰对称度(A)和双峰归一化指数(B)与水稻冠层叶片氮浓度的关系
Fig. 4 Relationships of leaf canopy nitrogen concentration to double peak symmetry (DPS) (A) and normalized difference double peak symmetry (NDPS) (B) in rice (n=312)
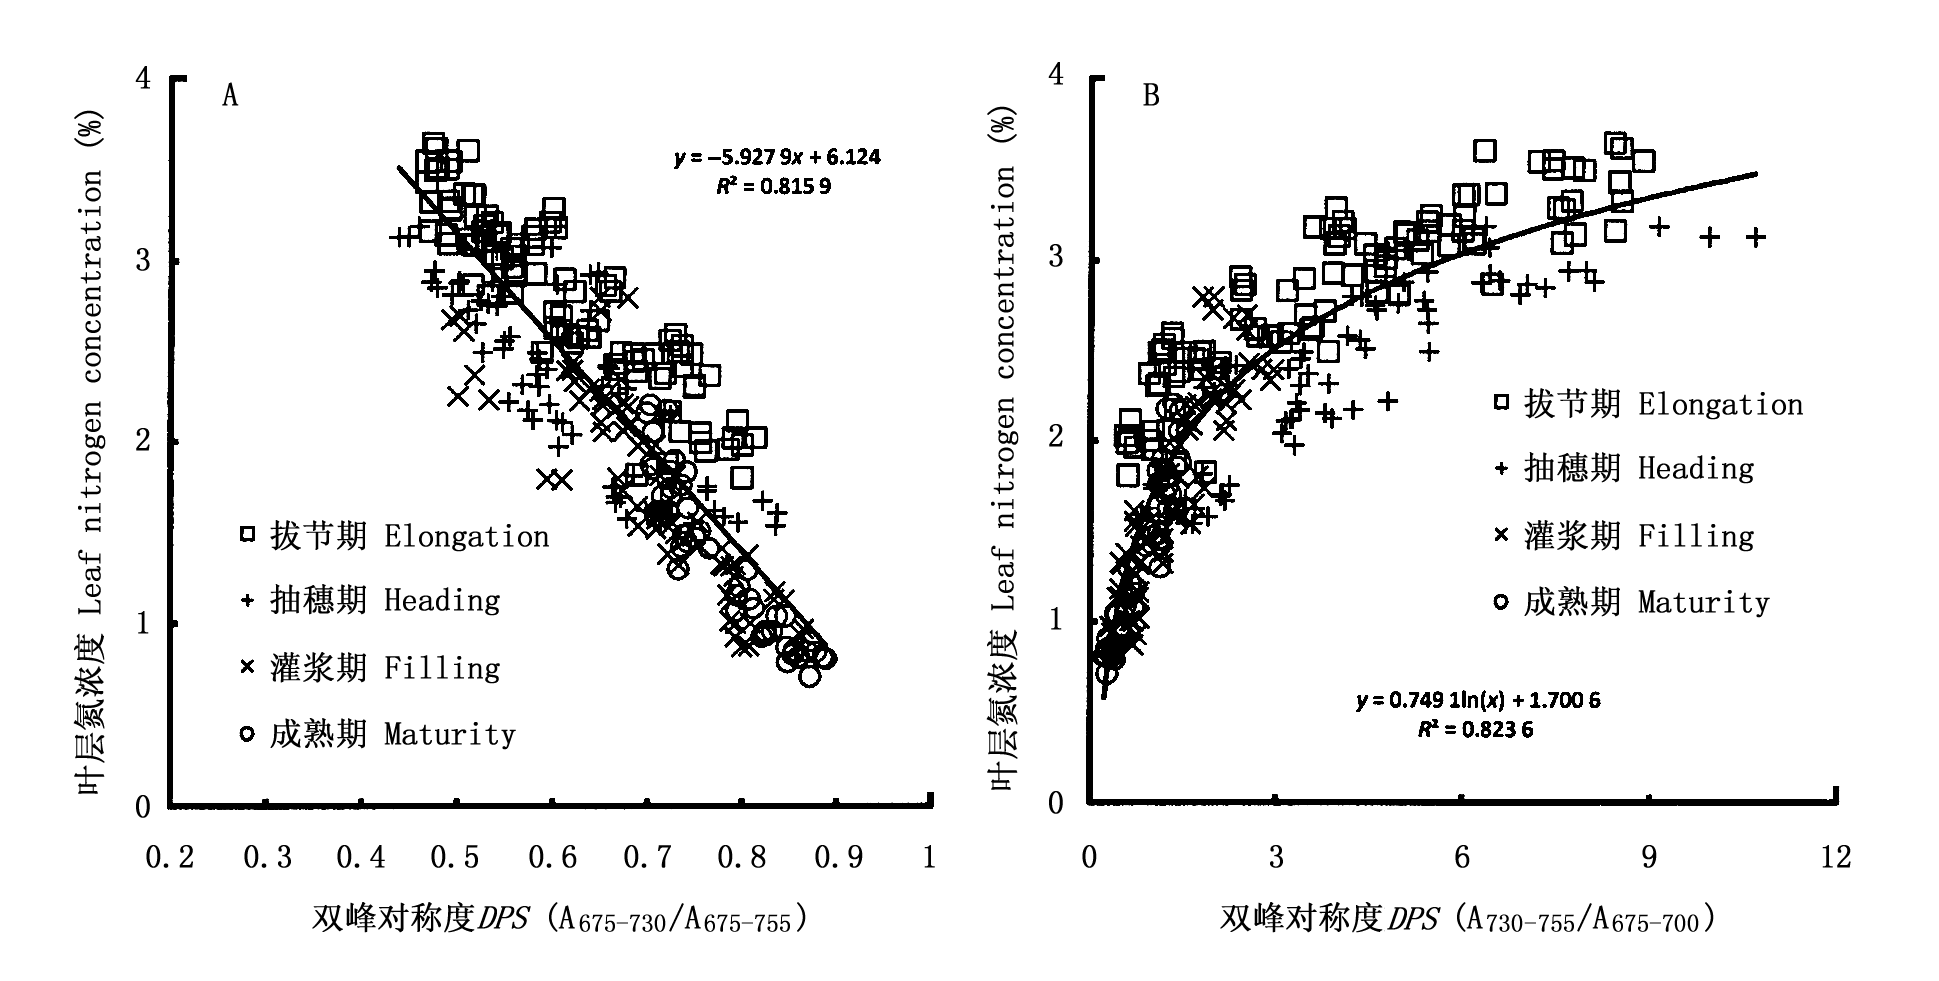
图3 双峰对称度DPS (A675-730, A675-755) (A)和DPS (A730-755, A675-700) (B)与水稻叶层氮浓度的关系
Fig. 3 Relationships of leaf canopy nitrogen concentration to DPS (A675-730, A675-755) (A) and DPS (A730-755, A675-700) (B) in rice (n=312)DPS: Double peak symmetry
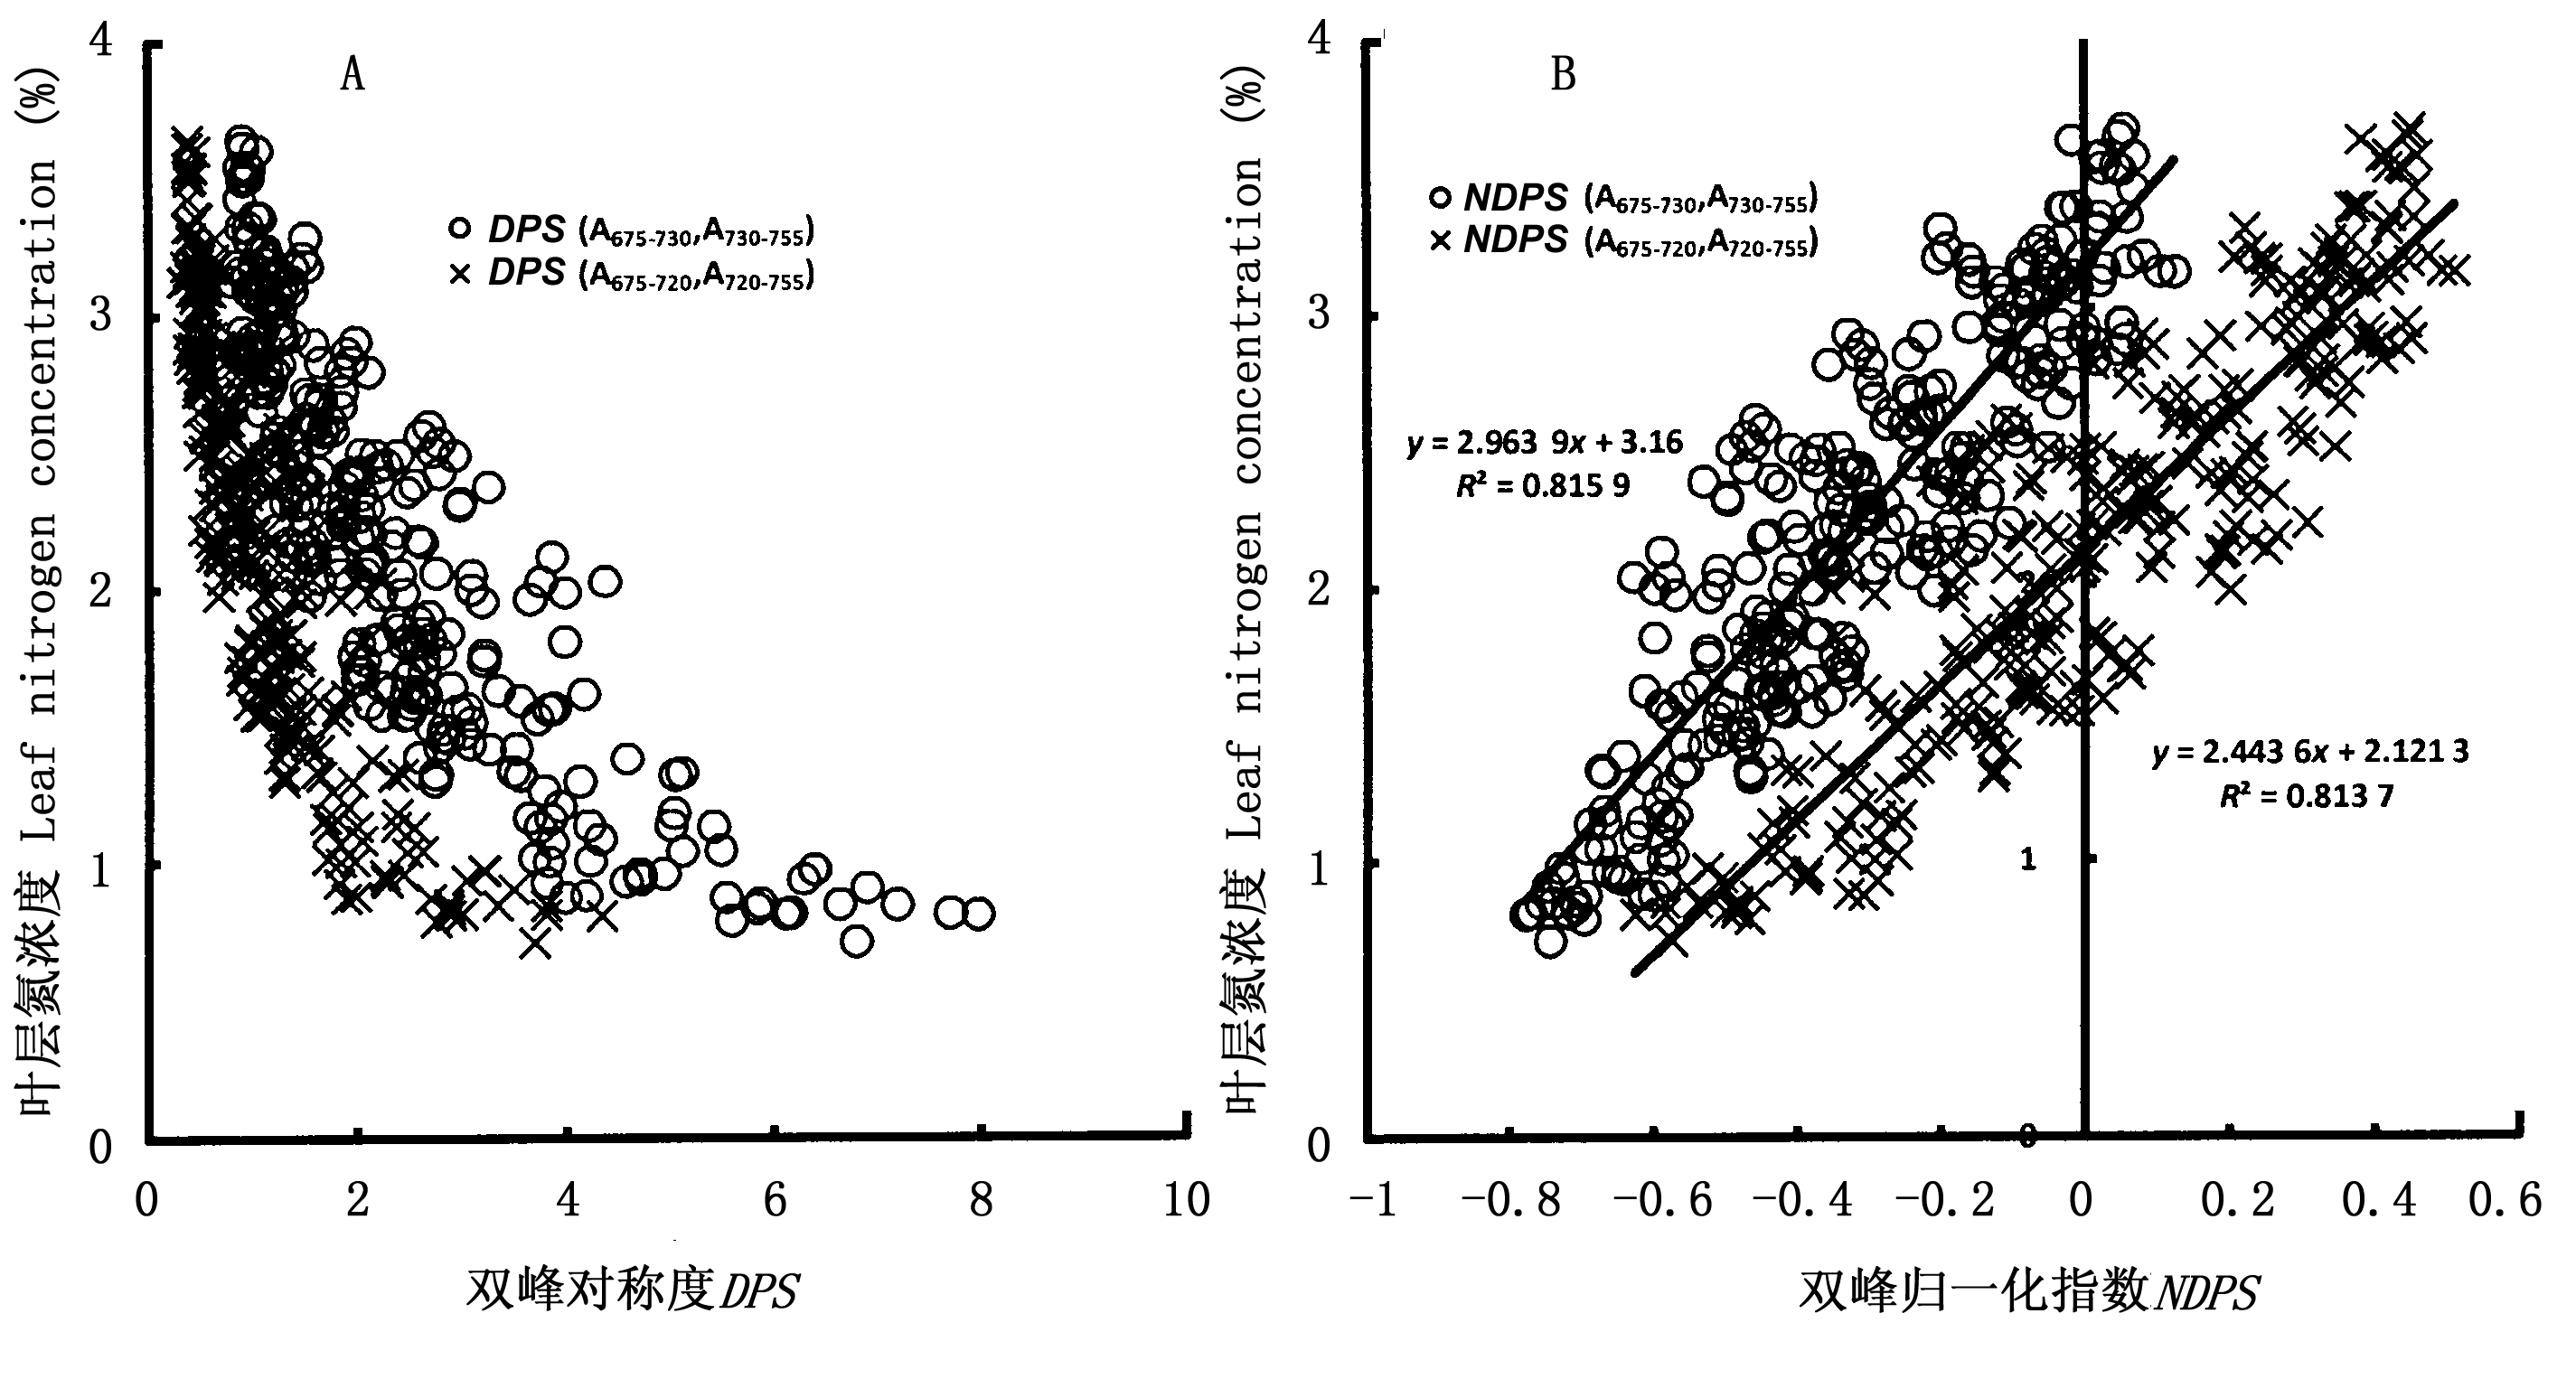
图5 双峰对称度DPS (A675-720, A720-755), DPS (A675-730, A730-755) (A)和NDPS (A720-730, A700-720), NDPS (A675-730, A730-755) (B)与水稻冠层叶片氮浓度的关系 DPS, NDPS同表2 See Table 2
Fig. 5 Relationships of leaf canopy nitrogen concentration to DPS (A675-720,A720-755), DPS (A675-730,A730-755) (A) and NDPS (A675-720, A720-755), NDPS (A675-730, A730-755) (B) (n=312)
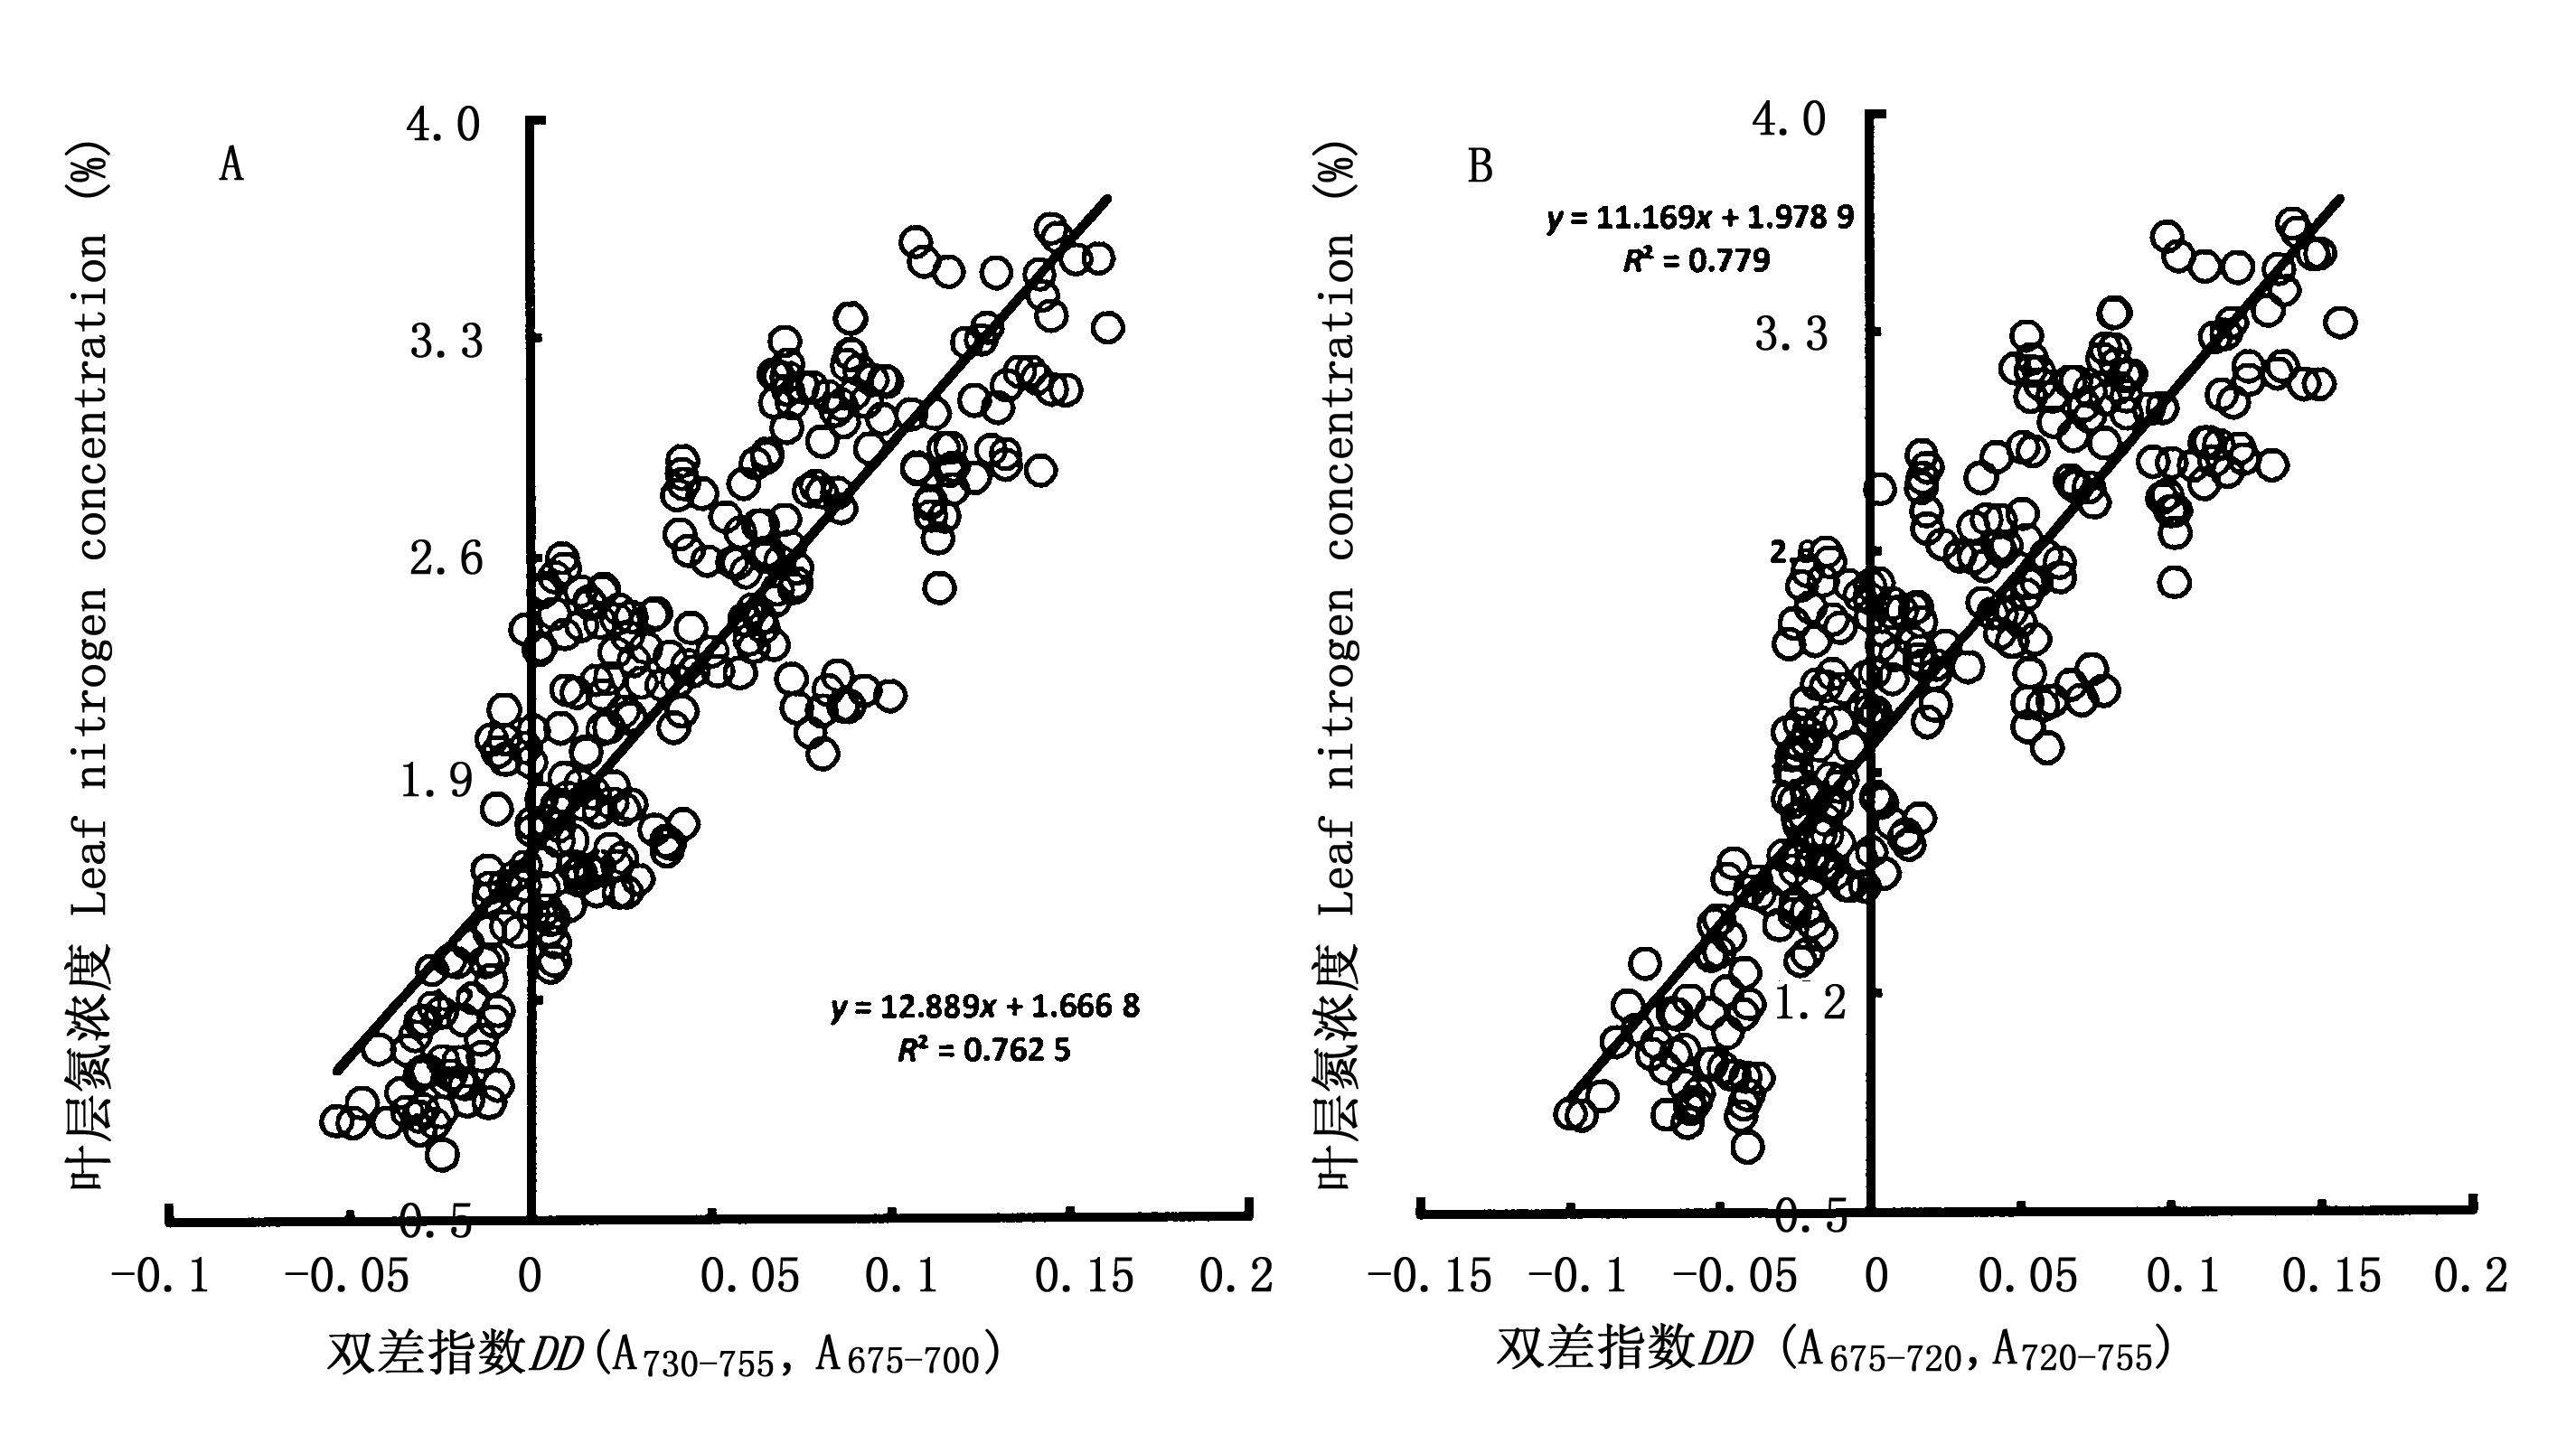
图6 双差指数DD (A730-755, A675-700)(A)和DD (A675-720, A720-755)(B)与水稻冠层叶片氮浓度的关系 DD: 同表2 See Table 2
Fig. 6 Relationships of leaf canopy nitrogen concentration to DD (A730-755, A675-700) (A) and DD (A675-720, A720-755) (B) (n=312)
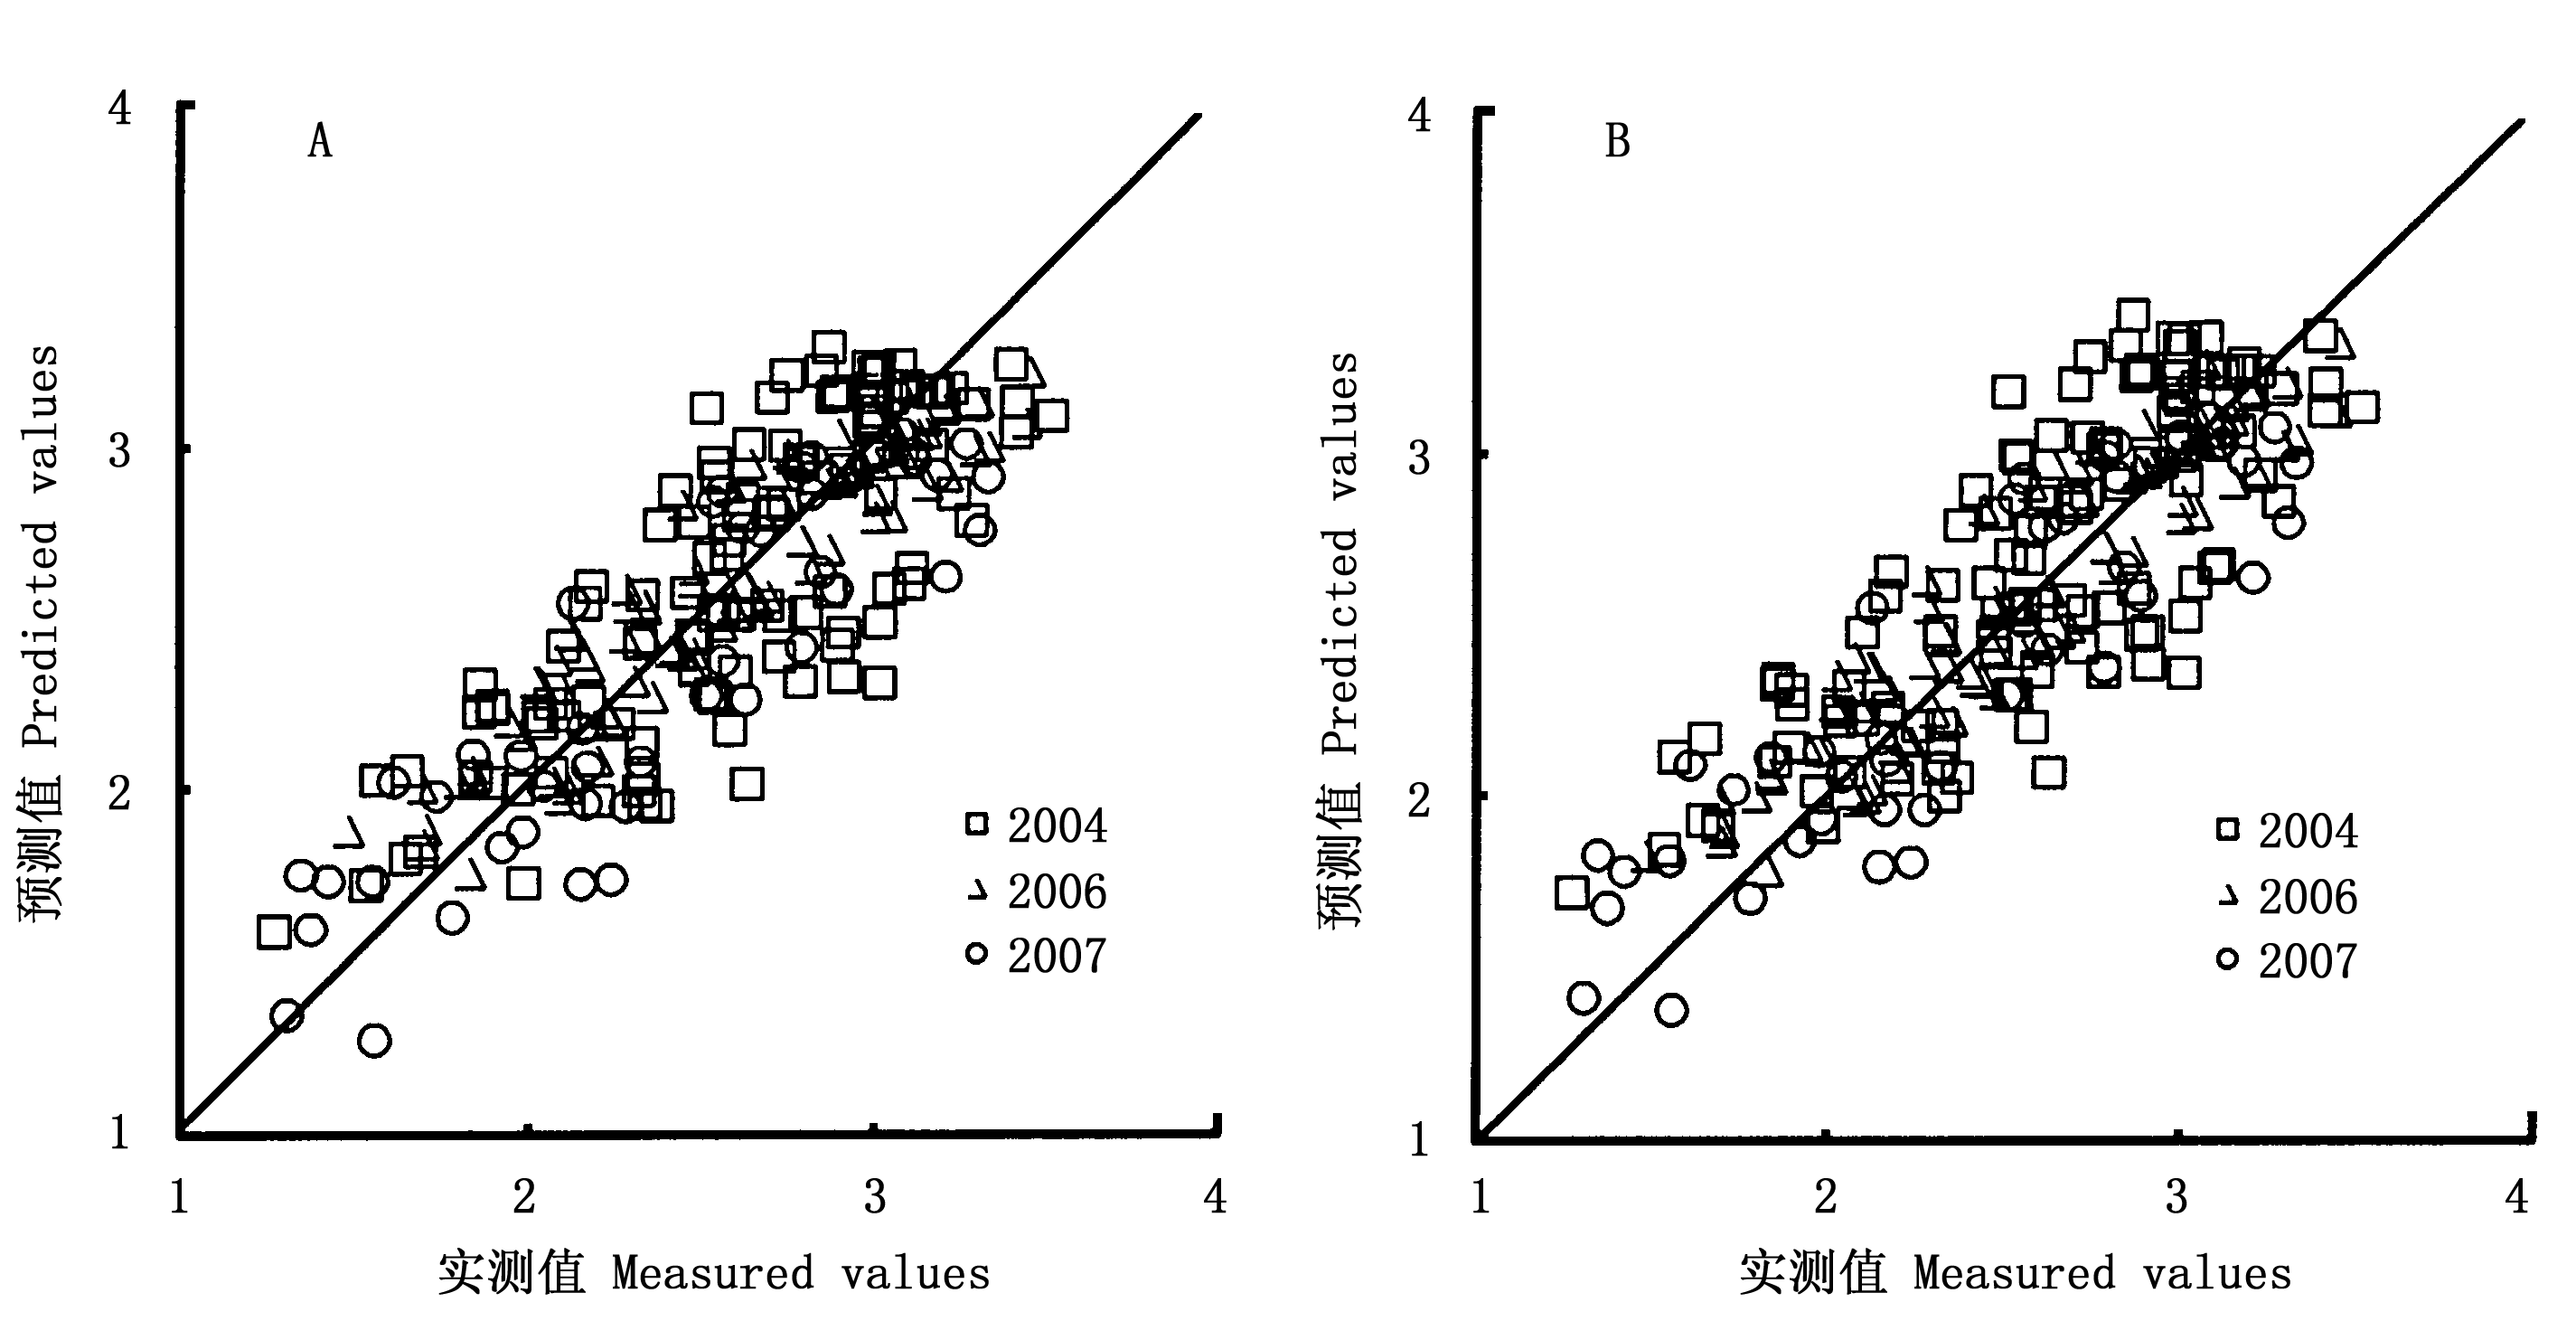
图7 基于DPS (A675-700, A675-755)(A)和NDPS (A675-700, A700-755)(B)的水稻叶层氮浓度监测模型的检验
Fig. 7 Comparison of measured and predicted leaf canopy nitrogen concentrations based on DPS (A675-700, A675-755) (A) and NDPS (A675-700, A700-755) (B) (n=251)
| 参数 Parameter | 模型形式 Model type | 拟合模型 Model | 决定系数 R2 | 预测标准误 Standard error |
|---|---|---|---|---|
| DPS (A730-755, A675-700) | 直线 Linear | y=0.267 2x+1.450 2 | 0.69 | 0.41 |
| 曲线 Curve | y=0.749 1ln(x)+1.700 6 | 0.82 | ||
| DD (A730-755, A675-700) | 直线 Linear | y=12.889x+1.666 8 | 0.76 | 0.36 |
| NDPS (A730-755, A675-700) | 直线 Linear | y=1.794 6x+1.702 4 | 0.81 | 0.32 |
| DPS (A675-700, A700-755) | 直线 Linear | Y= -3.618x + 3.102 8 | 0.71 | 0.40 |
| 曲线 Curve | y= -1.022ln(x)+0.563 9 | 0.82 | ||
| DD (A675-700, A700-755) | 直线 Linear | y=8.395 5x+1.028 6 | 0.64 | 0.45 |
| NDPS (A675-700, A700-755) | 直线 Linear | y=3.38x+0.084 2 | 0.78 | 0.35 |
| 曲线 Curve | y=0.662 9e1.806 7x | 0.82 | ||
| DPS (A675-730, A730-755) | 曲线 Curve | y=3.692 7e-0.244x | 0.81 | 0.39 |
| DD (A675-730, A730-755) | 直线 Linear | y=15.781x+3.098 8 | 0.66 | 0.44 |
| NDPS (A675-730, A730-755) | 直线 Linear | y=2.963 9x+3.16 | 0.82 | 0.32 |
| DPS (A675-720, A720-755) | 曲线 Curve | y=3.494 9e-0.474x | 0.78 | 0.41 |
| DD (A675-720, A720-755) | 直线 Linear | y=11.169x+1.978 9 | 0.78 | 0.35 |
| NDPS (A675-720, A720-755) | 直线 Linear | y=2.443 6x+2.121 3 | 0.82 | 0.32 |
| DPS (A720-730, A700-720) | 直线 Linear | y=3.747x-0.142 3 | 0.79 | 0.34 |
| DPS1 (A700-720, A700-730) | 直线 Linear | y= -9.587 1x+8.170 6 | 0.79 | 0.35 |
| DD (A720-730, A700-720) | 直线 Linear | y=56.323x+3.417 1 | 0.60 | 0.47 |
| NDPS (A720-730, A700-720) | 直线 Linear | y=4.793 6x+3.377 1 | 0.79 | 0.35 |
| DPS (A675-720, A675-755) | 直线 Linear | y= -4.887 3x+4.564 9 | 0.81 | 0.32 |
| DPS (A675-730, A675-755) | 直线 Linear | y= -5.927 9x+6.124 | 0.82 | 0.32 |
| DPS (A675-700, A675-755) | 直线 Linear | y= -6.759 9x+3.464 1 | 0.78 | 0.35 |
| 曲线 Curve | y=4.037 2e-3.613x | 0.82 | ||
| Ared edge/Ared vale | 曲线 Curve | y=0.947ln(x)-1.316 4 | 0.67 | 0.38 |
| R795-R625 | 直线 Linear | y=6.506 8x + 0.757 6 | 0.41 | 0.58 |
| R780-R680 | 直线 Linear | y=6.396 2x + 0.754 3 | 0.38 | 0.58 |
表3 不同红边面积参数与水稻叶层氮浓度的关系(n=312)
Table 3 Relationships between leaf canopy nitrogen concentration and red edge area parameters in Oryza sativa (n=312)
| 参数 Parameter | 模型形式 Model type | 拟合模型 Model | 决定系数 R2 | 预测标准误 Standard error |
|---|---|---|---|---|
| DPS (A730-755, A675-700) | 直线 Linear | y=0.267 2x+1.450 2 | 0.69 | 0.41 |
| 曲线 Curve | y=0.749 1ln(x)+1.700 6 | 0.82 | ||
| DD (A730-755, A675-700) | 直线 Linear | y=12.889x+1.666 8 | 0.76 | 0.36 |
| NDPS (A730-755, A675-700) | 直线 Linear | y=1.794 6x+1.702 4 | 0.81 | 0.32 |
| DPS (A675-700, A700-755) | 直线 Linear | Y= -3.618x + 3.102 8 | 0.71 | 0.40 |
| 曲线 Curve | y= -1.022ln(x)+0.563 9 | 0.82 | ||
| DD (A675-700, A700-755) | 直线 Linear | y=8.395 5x+1.028 6 | 0.64 | 0.45 |
| NDPS (A675-700, A700-755) | 直线 Linear | y=3.38x+0.084 2 | 0.78 | 0.35 |
| 曲线 Curve | y=0.662 9e1.806 7x | 0.82 | ||
| DPS (A675-730, A730-755) | 曲线 Curve | y=3.692 7e-0.244x | 0.81 | 0.39 |
| DD (A675-730, A730-755) | 直线 Linear | y=15.781x+3.098 8 | 0.66 | 0.44 |
| NDPS (A675-730, A730-755) | 直线 Linear | y=2.963 9x+3.16 | 0.82 | 0.32 |
| DPS (A675-720, A720-755) | 曲线 Curve | y=3.494 9e-0.474x | 0.78 | 0.41 |
| DD (A675-720, A720-755) | 直线 Linear | y=11.169x+1.978 9 | 0.78 | 0.35 |
| NDPS (A675-720, A720-755) | 直线 Linear | y=2.443 6x+2.121 3 | 0.82 | 0.32 |
| DPS (A720-730, A700-720) | 直线 Linear | y=3.747x-0.142 3 | 0.79 | 0.34 |
| DPS1 (A700-720, A700-730) | 直线 Linear | y= -9.587 1x+8.170 6 | 0.79 | 0.35 |
| DD (A720-730, A700-720) | 直线 Linear | y=56.323x+3.417 1 | 0.60 | 0.47 |
| NDPS (A720-730, A700-720) | 直线 Linear | y=4.793 6x+3.377 1 | 0.79 | 0.35 |
| DPS (A675-720, A675-755) | 直线 Linear | y= -4.887 3x+4.564 9 | 0.81 | 0.32 |
| DPS (A675-730, A675-755) | 直线 Linear | y= -5.927 9x+6.124 | 0.82 | 0.32 |
| DPS (A675-700, A675-755) | 直线 Linear | y= -6.759 9x+3.464 1 | 0.78 | 0.35 |
| 曲线 Curve | y=4.037 2e-3.613x | 0.82 | ||
| Ared edge/Ared vale | 曲线 Curve | y=0.947ln(x)-1.316 4 | 0.67 | 0.38 |
| R795-R625 | 直线 Linear | y=6.506 8x + 0.757 6 | 0.41 | 0.58 |
| R780-R680 | 直线 Linear | y=6.396 2x + 0.754 3 | 0.38 | 0.58 |
| [1] | Belanger MJ, Miller JR, Boyer MG (1995). Comparative relationships between some red edge parameters and seasonal leaf chlorophyll concentrations. Canada Journal of Remote Sensing, 21, 16-21. |
| [2] | Boochs F, Kupfer G, Dockter K, Kuhbauch W (1990). Shape of the red edge as vitality indicator for plants. International Journal of Remote Sensing, 11, 1741-1753. |
| [3] | Bonham-Carter GF (1988). Numerical procedures and computer program for fitting an inverted Gaussian model to vegetation reflectance data. Computers and Geosciences, 14, 339-356. |
| [4] | Cho MA, Skidmore AK (2006). A new technique for extracting the red edge position from hyperspectral data: the linear extrapolation method. Remote Sensing of Environment, 101, 181-193. |
| [5] | Clevers JGPW, Kooistra L, Salas EAL (2004). Study of heavy metal contamination in river floodplains using the red-edge position in spectroscopic data. International Journal of Remote Sensing, 25, 3883-3895. |
| [6] | Curran PJ (1989). Remote sensing of foliar chemistry. Remote Sensing Environment, 30, 271-278. |
| [7] |
Curran PJ, Dungan JL, Gholz HL (1990). Exploring the relationship between reflectance red edge and chlorophyll content in slash pine. Tree Physiology, 7, 33-38.
DOI URL PMID |
| [8] | Dawson TP, Curran PJ (1998). A new technique for interpolating the reflectance red edge position. International Journal of Remote Sensing, 19, 2133-2139. |
| [9] | Elvidge CD, Chen ZK (1995). Comparison of broad-band and narrow-band red and near-Infrared vegetation indices. Remote Sensing of Environment, 54, 38-48. |
| [10] | Filella I, Peñuelas J (1994). The red edge position and shape as indicators of plant chlorophyll content, biomass and hydric status. International Journal of Remote Sensing, 15, 1459-1470. |
| [11] | Gausman HW (1977). Reflectance of leaf components. Remote Sensing Environment, 6, 1-9. |
| [12] | Gitelson AA, Merzlyak MN (1994). Quantitative estimation of chlorophyll-a using reflectance spectra: experiments with autumn chestnut and maple leaves. Journal of Photochemistry and Photobioliology, 22, 247-252. |
| [13] | Horler DNH, Dockray M, Barber J (1983). The red edge of plant leaf reflectance. International Journal of Remote Sensing, 4, 273-288. |
| [14] | Jongschaap REE, Booij R (2004). Spectral measurements at different spatial scales in potato: relating leaf, plant and canopy nitrogen status. International Journal of Applied Earth Observation and Geoinformation, 5, 204-218. |
| [15] | Jordan CF (1969). Derivation of leaf area index from quality of light on the forest floor. Ecology, 50, 663-666. |
| [16] | Lamb DW, Steyn-ross M, Schaare P, Hanna MM, Silvester W, Steyn-Ross A (2002). Estimating leaf nitrogen concentration in ryegrass (Lolium spp.) pasture using the chlorophyll red-edge: theoretical modelling and experimental observations. International Journal of Remote Sensing, 23, 3619-3648. |
| [17] | Li Y, Demetriades-Shah TH, Kanemasu ET, Shultis KK, Kirkham MB (1993). Use of second derivatives of canopy reflectance for monitoring prairie vegetation over different soil backgrounds. Remote Sense of Environment, 44, 81-87. |
| [18] | Liu LY, Wang JH, Huang WJ, Zhao CJ, Zhang B, Tong QX (2004). Estimating winter wheat plant water content using red edge parameters. International Journal of Remote Sensing, 25, 3331-3342. |
| [19] | Maccioni A, Agati G, Mazzinghi P (2001). New vegetation indices for remote measurement of chlorophylls based on leaf directional reflectance spectra. Journal of Photochemistry and Photobiology, 61, 52-61. |
| [20] | Maire GL, Francois C, Dufrene E (2004). Towards universal broad leaf chlorophyll indices using PROSPECT simulated database and hyperspectral reflectance measurements. Remote Sensing of Environment, 89, 1-28. |
| [21] | Miller JR (1991). Season patterns in leaf reflectance red edge characteristics. International Journal of Remote Sensing, 12, 1509-1523. |
| [22] | Miller JR, Hare EW, Wu J (1990). Quantitative characterization of the red edge reflectance. An inverted- Gaussian reflectance model. International Journal of Remote Sensing, 11, 1755-1773. |
| [23] | Munden R, Curran PJ, Catt JA (1994). The relationship between red edge and chlorophyll concentration in broadbalk winter wheat experiment at rothamsted. International Journal of Remote Sensing, 15, 705-709. |
| [24] |
Pu RL, Gong P, Biging GS, Larrieu MR (2003). Extraction of red edge optical parameters from Hyperion data for estimation of forest leaf area index. IEEE Transactions on Geoscience and Remote Sensing, 41, 916-921.
DOI URL |
| [25] |
Shibayama M, Akiyama T (1989). Seasonal visible, near-infrared and mid-infrared spectra of rice canopies in relation to LAI and above-ground dry phytomass. Remote Sensing of Environment, 27, 119-127.
DOI URL |
| [26] |
Sims DA, Gamon JA (2002). Relationships between leaf pigment content and spectral reflectance across a wide range of species, leaf structures and developmental stages. Remote Sensing of Environment, 81, 337-354.
DOI URL |
| [27] | Sun L (孙莉), Chen X (陈曦), Wu JJ (武建军), Feng XW (冯先伟), Bao AM (包安明), Ma YQ (马亚琴), Wang DW (王登伟) (2006). Changes of canopy leaf hyper-spectral reflectance under water stress in cotton. Chinese Science Bulletin (科学通报), 51(Suppl.), 143-147. (in Chinese with English abstract) |
| [28] |
Tsai F, Philpot W (1998). Derivative analysis of hyperspectral data. Remote Sensing of Environment, 66, 41-51.
DOI URL |
| [29] |
Wang YY (王圆圆), Chen YH (陈云浩), Li J (李京), Huang WJ (黄文江) (2007). Two new red edge indices as indicators for stripe rust disease severity of winter wheat. Journal of Remote Sensing (遥感学报), 11, 875-881. (in Chinese with English abstract)
DOI URL |
| [30] | Wu CS (吴长山), Tong QX (童庆禧), Zhen LF (郑兰芬), Liu WD (刘伟东) (2000). Correlation analysis between spectral data and chlorophyll of rice and maze. Journal of Basic Science and Engineering (应用基础与工程科学学报), 8, 31-37. (in Chinese with English abstract) |
| [1] | 王雪梅, 闫帮国, 史亮涛, 刘刚才. 车桑子幼苗生物量分配与叶性状对氮磷浓度的响应差异[J]. 植物生态学报, 2020, 44(12): 1247-1261. |
| [2] | 沙依然·外力,李秉柏,张佳华,杨沈斌. 水稻模拟模型在高温敏感性研究中的应用[J]. 植物生态学报, 2014, 38(5): 515-528. |
| [3] | 邹媛媛, 刘琳, 刘洋, 赵亮, 邓启云, 吴俊, 庄文, 宋未. 不同水稻品种种子固有细菌群落的多样性[J]. 植物生态学报, 2012, 36(8): 880-890. |
| [4] | 隗溟,廖学群,李冬霞,段海龙. 水稻分蘖节位生产力比较[J]. 植物生态学报, 2012, 36(4): 324-332. |
| [5] | 李霄峰, 胥晓, 王碧霞, 黄尤优, 王志峰, 李俊钰. 小五台山森林落叶层对天然青杨种群更新方式的影响[J]. 植物生态学报, 2012, 36(2): 109-116. |
| [6] | 顾东祥, 汤亮, 徐其军, 雷晓俊, 曹卫星, 朱艳. 水氮处理下不同品种水稻根系生长分布特征[J]. 植物生态学报, 2011, 35(5): 558-566. |
| [7] | 陈洁, 汤亮, 刘小军, 曹卫星, 朱艳. 基于植株碳流的水稻籽粒淀粉积累模拟模型[J]. 植物生态学报, 2011, 35(4): 431-440. |
| [8] | 王维, 蔡一霞, 杨建昌, 朱庆森. 结实期土壤水分亏缺影响水稻籽粒灌浆的生理原因[J]. 植物生态学报, 2011, 35(2): 195-202. |
| [9] | 杨杰, 田永超, 姚霞, 曹卫星, 朱艳. 利用高光谱参数反演水稻叶片类胡萝卜素含量[J]. 植物生态学报, 2010, 34(7): 845-854. |
| [10] | 张玉森, 姚霞, 田永超, 曹卫星, 朱艳. 应用近红外光谱预测水稻叶片氮含量[J]. 植物生态学报, 2010, 34(6): 704-712. |
| [11] | 张巍巍, 郑飞翔, 王效科, 冯兆忠, 欧阳志云. 臭氧对水稻根系活力、可溶性蛋白含量与抗氧化系统的影响[J]. 植物生态学报, 2009, 33(3): 425-432. |
| [12] | 蔡昆争, 吴学祝, 骆世明. 不同生育期水分胁迫对水稻根叶渗透调节物质变化的影响[J]. 植物生态学报, 2008, 32(2): 491-500. |
| [13] | 陈惠哲, Natalia Ladatko, 朱德峰, 林贤青, 张玉屏, 孙宗修. 盐胁迫下水稻苗期Na+和K+吸收与分配规律的初步研究[J]. 植物生态学报, 2007, 31(5): 937-945. |
| [14] | 蔡一霞, 王维, 朱庆森. 水分胁迫对水稻籽粒蛋白质积累及营养品质的影响[J]. 植物生态学报, 2007, 31(3): 536-543. |
| [15] | 朱艳, 姚霞, 田永超, 周冬琴, 李映雪, 曹卫星. 稻麦叶片氮积累量与冠层反射光谱的定量关系[J]. 植物生态学报, 2006, 30(6): 983-990. |
| 阅读次数 | ||||||
|
全文 |
|
|||||
|
摘要 |
|
|||||
Copyright © 2022 版权所有 《植物生态学报》编辑部
地址: 北京香山南辛村20号, 邮编: 100093
Tel.: 010-62836134, 62836138; Fax: 010-82599431; E-mail: apes@ibcas.ac.cn, cjpe@ibcas.ac.cn
备案号: 京ICP备16067583号-19