
植物生态学报 ›› 2006, Vol. 30 ›› Issue (6): 983-990.DOI: 10.17521/cjpe.2006.0126
朱艳, 姚霞, 田永超, 周冬琴, 李映雪, 曹卫星( )
)
收稿日期:2005-07-28
接受日期:2005-12-28
出版日期:2006-07-28
发布日期:2006-11-30
通讯作者:
曹卫星
作者简介:* E-mail: caow@njau.edu.cn基金资助:
ZHU Yan, YAO Xia, TIAN Yong-Chao, ZHOU Dong-Qin, LI Ying-Xue, CAO Wei-Xing()
Received:2005-07-28
Accepted:2005-12-28
Online:2006-07-28
Published:2006-11-30
Contact:
CAO Wei-Xing
摘要:
作物氮素积累动态是评价作物群体长势及估测产量和品质的重要指标,对于作物氮素的实时监测和精确管理具有重要意义。该文以5个小麦(Triticum aestivum)品种和3个水稻(Oryza sativa)品种在不同施氮水平下的3年田间试验为基础,综合研究了稻麦叶片氮积累量与冠层反射光谱的定量关系。结果表明,不同试验中拔节后叶片氮积累量均随施氮水平呈上升趋势;稻麦冠层光谱反射率在不同施氮水平下存在明显差异,可见光区(460~710 nm)反射率一般随施氮水平的增加逐渐降低,近红外波段(760~1 220 nm)反射率却随施氮水平的增加逐渐升高;就单波段而言,810和870 nm处的冠层光谱反射率均与稻麦叶片氮积累量具有相对较高的相关性;在光谱参数中,比值植被指数(Ratio vegetation index, RVI)(870,660)和RVI(810,660)均与稻麦叶片氮积累量具有高度的相关性,且相关系数明显高于单波段反射率,尤其是水稻作物;对于小麦和水稻,均可以利用统一的波段和光谱指数来监测其叶片氮积累量,并可以采用统一的回归方程来描述其叶片氮积累量随单波段反射率和反射光谱参数的变化模式,但若采用单独的回归系数则可以提高稻麦叶片氮积累量估测的准确性。
朱艳, 姚霞, 田永超, 周冬琴, 李映雪, 曹卫星. 稻麦叶片氮积累量与冠层反射光谱的定量关系. 植物生态学报, 2006, 30(6): 983-990. DOI: 10.17521/cjpe.2006.0126
ZHU Yan, YAO Xia, TIAN Yong-Chao, ZHOU Dong-Qin, LI Ying-Xue, CAO Wei-Xing. QUANTITATIVE RELATIONSHIP BETWEEN LEAF NITROGEN ACCUMULATION AND CANOPY REFLECTANCE SPECTRA IN RICE AND WHEAT. Chinese Journal of Plant Ecology, 2006, 30(6): 983-990. DOI: 10.17521/cjpe.2006.0126
| 波段Band | 460 | 510 | 560 | 610 | 660 | 680 | 710 | 760 | ||||||
|---|---|---|---|---|---|---|---|---|---|---|---|---|---|---|
| 中心波长Center wavelength (nm) | 460.4 | 511.4 | 560.9 | 610.7 | 661.7 | 682.0 | 711.4 | 761.2 | ||||||
| 带宽Band width (nm) | 8.3 | 8.8 | 8.7 | 9.7 | 9.4 | 11.7 | 12.4 | 9.9 | ||||||
| 波段Band | 810 | 870 | 950 | 1 100 | 1 220 | 1 480 | 1 500 | 1 650 | ||||||
| 中心波长Center wavelength (nm) | 812.6 | 871.6 | 951.2 | 1 099.5 | 1 222.8 | 1 480.2 | 1 500.2 | 1 669.0 | ||||||
| 带宽Band width (nm) | 11.2 | 12.6 | 10.6 | 16.3 | 11.5 | 13.1 | 15.3 | 195.0 | ||||||
表1 Cropscan波段的中心波长和带宽
Table 1 The center wavelength and band width of Cropscan
| 波段Band | 460 | 510 | 560 | 610 | 660 | 680 | 710 | 760 | ||||||
|---|---|---|---|---|---|---|---|---|---|---|---|---|---|---|
| 中心波长Center wavelength (nm) | 460.4 | 511.4 | 560.9 | 610.7 | 661.7 | 682.0 | 711.4 | 761.2 | ||||||
| 带宽Band width (nm) | 8.3 | 8.8 | 8.7 | 9.7 | 9.4 | 11.7 | 12.4 | 9.9 | ||||||
| 波段Band | 810 | 870 | 950 | 1 100 | 1 220 | 1 480 | 1 500 | 1 650 | ||||||
| 中心波长Center wavelength (nm) | 812.6 | 871.6 | 951.2 | 1 099.5 | 1 222.8 | 1 480.2 | 1 500.2 | 1 669.0 | ||||||
| 带宽Band width (nm) | 11.2 | 12.6 | 10.6 | 16.3 | 11.5 | 13.1 | 15.3 | 195.0 | ||||||
| 光谱参数 Spectral parameter | 缩写 Abbreviation | 计算公式 Algorithm formula | 参考文献 Reference |
|---|---|---|---|
| 单波段反射率 Reflectance | ρλ | ||
| 比值植被指数 Ratio vegetation index | RVI (λ1, λ2) | ρλ1/ρλ2 | Pearson & Miller, |
| 差值植被指数 Differential vegetation index | DVI (λ1, λ2) | ρλ1-ρλ2 | Jordan, |
| 归一化差值植被指数Normalized difference vegetation index | NDVI (λ1, λ2) | (ρλ1-ρλ2)/(ρλ1+ρλ2) | Rouse et al., |
表2 光谱参数计算方法
Table 2 Algorithm of different spectral parameters
| 光谱参数 Spectral parameter | 缩写 Abbreviation | 计算公式 Algorithm formula | 参考文献 Reference |
|---|---|---|---|
| 单波段反射率 Reflectance | ρλ | ||
| 比值植被指数 Ratio vegetation index | RVI (λ1, λ2) | ρλ1/ρλ2 | Pearson & Miller, |
| 差值植被指数 Differential vegetation index | DVI (λ1, λ2) | ρλ1-ρλ2 | Jordan, |
| 归一化差值植被指数Normalized difference vegetation index | NDVI (λ1, λ2) | (ρλ1-ρλ2)/(ρλ1+ρλ2) | Rouse et al., |
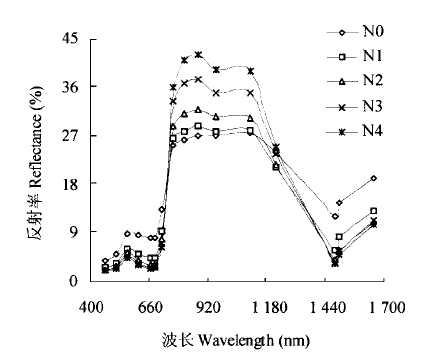
图1 试验3中不同施氮水平下`淮麦20'小麦品种在开花期的冠层光谱反射率
Fig.1 Canopy reflectance under different nitrogen rates at anthesis of `Huaimai 20' wheat in experiment 3 N0: 0 N1: 75 kg N·hm-2 N2: 150 kg N·hm-2 N3: 225 kg N·hm-2 N4: 300 kg N·hm-2
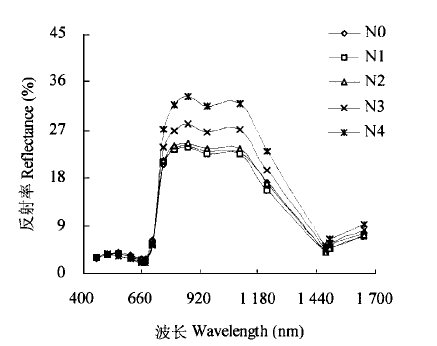
图2 试验5中不同施氮水平下‘武香粳9’水稻品种在齐穗期的冠层光谱反射率 N0,N1,N2,N3,N4:见图1 See Fig. 1
Fig.2 Canopy reflectance under different nitrogen rates at full heading of `Wuxianggeng 9' rice in experiment 5
| 作物类型 Crop type | 波长 Wavelength(nm) | 回归方程 Regression equation | 决定系数 R2 |
|---|---|---|---|
| 小麦(n=381) Wheat | 810 | y=0.250 8x-3.695 1 | 0.768 2 |
| 870 | y=0.253 7x-3.998 3 | 0.759 6 | |
| 760 | y=0.320 3x-4.926 7 | 0.753 0 | |
| 950 | y=0.298 7x-5.015 6 | 0.744 8 | |
| 1 100 | y=0.289 6x-4.865 4 | 0.729 6 | |
| 水稻(n=222) Rice | 660 | y=12.519x-0.854 0 | 0.495 3 |
| 680 | y=11.029x-0.770 6 | 0.427 1 | |
| 610 | y=15.025x-0.846 2 | 0.375 0 | |
| 810 | y=0.201 7x-1.160 9 | 0.324 2 | |
| 870 | y=0.185 7x-0.915 4 | 0.294 6 | |
| 稻麦(n=603) Wheat & rice | 810 | y=0.237 7x-2.906 8 | 0.621 3 |
| 870 | y=0.237 7x-3.149 7 | 0.610 7 |
表3 稻麦叶片氮积累量(y)与冠层光谱反射率(x)之间的定量关系
Table 3 Quantitative relationships of leaf nitrogen accumulation to canopy spectral reflectance in wheat and rice
| 作物类型 Crop type | 波长 Wavelength(nm) | 回归方程 Regression equation | 决定系数 R2 |
|---|---|---|---|
| 小麦(n=381) Wheat | 810 | y=0.250 8x-3.695 1 | 0.768 2 |
| 870 | y=0.253 7x-3.998 3 | 0.759 6 | |
| 760 | y=0.320 3x-4.926 7 | 0.753 0 | |
| 950 | y=0.298 7x-5.015 6 | 0.744 8 | |
| 1 100 | y=0.289 6x-4.865 4 | 0.729 6 | |
| 水稻(n=222) Rice | 660 | y=12.519x-0.854 0 | 0.495 3 |
| 680 | y=11.029x-0.770 6 | 0.427 1 | |
| 610 | y=15.025x-0.846 2 | 0.375 0 | |
| 810 | y=0.201 7x-1.160 9 | 0.324 2 | |
| 870 | y=0.185 7x-0.915 4 | 0.294 6 | |
| 稻麦(n=603) Wheat & rice | 810 | y=0.237 7x-2.906 8 | 0.621 3 |
| 870 | y=0.237 7x-3.149 7 | 0.610 7 |
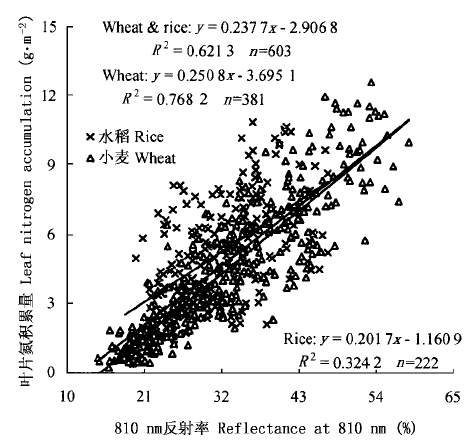
图3 稻麦叶片氮积累量与810 nm反射率的关系
Fig.3 Relationship between canopy reflectance at 810 nm and leaf nitrogen accumulation in wheat and rice
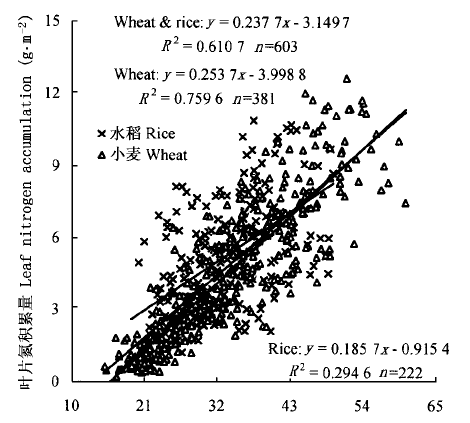
图4 稻麦叶片氮积累量与870 nm反射率的关系
Fig.4 Relationship between canopy reflectance at 870 nm and leaf nitrogen accumulation in wheat and rice
| 作物类型 Crop type | 波长 Wavelength(nm) | 回归方程 Regression equation | 决定系数 R2 |
|---|---|---|---|
| 小麦Wheat (n=381) | RVI(950,660) | y=0.413 3x0.986 3 | 0.848 7 |
| RVI (1 100,660) | y=0.401 7x0.992 5 | 0.849 8 | |
| RVI (870,660) | y=0.443 2x0.936 2 | 0.848 2 | |
| RVI (810,660) | y=0.477 6x0.914 3 | 0.845 6 | |
| RVI (760,660) | y=0.477 3x0.955 4 | 0.840 6 | |
| 水稻Rice (n=222) | RVI (870,660) | y=0.351 8x+1.221 8 | 0.642 5 |
| RVI (810,660) | y=0.361 8x+1.265 5 | 0.641 9 | |
| RVI (1 220,660) | y=0.577 1x+0.846 7 | 0.628 8 | |
| RVI (870,610) | y=0.498x+0.850 5 | 0.604 1 | |
| RVI (810,610) | y=0.506x+0.948 2 | 0.598 7 | |
| 稻麦Wheat & rice (n=603) | RVI (870,660) | y=0.493 3x0.919 8 | 0.798 8 |
| RVI (810,660) | y=0.534 6x0.897 6 | 0.793 5 |
表4 稻麦叶片氮积累量(y)与冠层光谱参数(x)之间的定量关系
Table 4 Quantitative relationships of leaf nitrogen accumulation and canopy spectral parameters in wheat and rice
| 作物类型 Crop type | 波长 Wavelength(nm) | 回归方程 Regression equation | 决定系数 R2 |
|---|---|---|---|
| 小麦Wheat (n=381) | RVI(950,660) | y=0.413 3x0.986 3 | 0.848 7 |
| RVI (1 100,660) | y=0.401 7x0.992 5 | 0.849 8 | |
| RVI (870,660) | y=0.443 2x0.936 2 | 0.848 2 | |
| RVI (810,660) | y=0.477 6x0.914 3 | 0.845 6 | |
| RVI (760,660) | y=0.477 3x0.955 4 | 0.840 6 | |
| 水稻Rice (n=222) | RVI (870,660) | y=0.351 8x+1.221 8 | 0.642 5 |
| RVI (810,660) | y=0.361 8x+1.265 5 | 0.641 9 | |
| RVI (1 220,660) | y=0.577 1x+0.846 7 | 0.628 8 | |
| RVI (870,610) | y=0.498x+0.850 5 | 0.604 1 | |
| RVI (810,610) | y=0.506x+0.948 2 | 0.598 7 | |
| 稻麦Wheat & rice (n=603) | RVI (870,660) | y=0.493 3x0.919 8 | 0.798 8 |
| RVI (810,660) | y=0.534 6x0.897 6 | 0.793 5 |
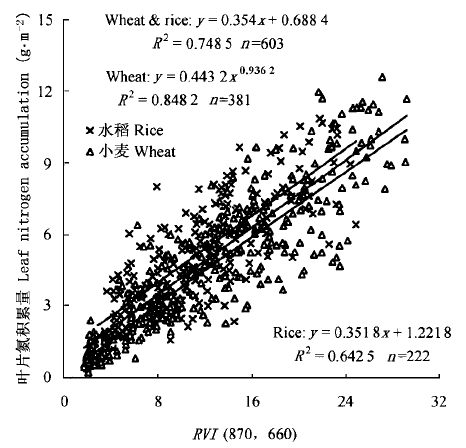
图5 稻麦叶片氮积累量与RVI (870, 660)的关系
Fig.5 Relationship between RVI (870, 660) and leaf nitrogen accumulation in wheat and rice
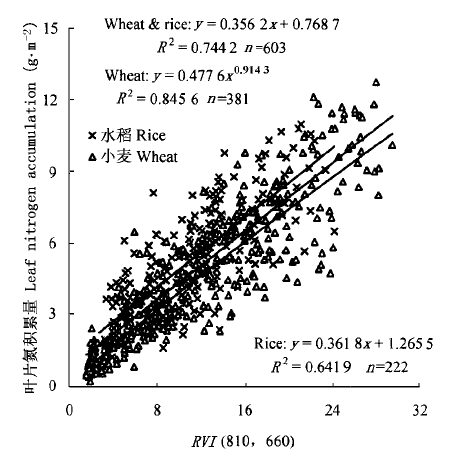
图6 稻麦叶片氮积累量与RVI (810, 660)的关系
Fig.6 Relationship between RVI (810, 660) and leaf nitrogen accumulation in wheat and rice
| [1] | Huang WJ(黄文江), Wang JH(王纪华), Liu LY(刘良云), Zhao CJ(赵春江), Wang JD(王锦地), Du XH(杜小鸿) (2003). The red edge parameters diversification discipline and its application for nutrition diagnosis. Remote Sensing Technology and Application(遥感技术与应用), 18,206-211. (in Chinese with English abstract) |
| [2] | Jensen A, Lorenzen B (1990). Radiometric estimation of biomass and nitrogen content of barley grown at different nitrogen levels. International Journal of Remote Sensing, 11,1809-1820. |
| [3] | Jongschaap REE, Booij R (2004). Spectral measurements at different spatial scales in potato: relating leaf, plant and canopy nitrogen status. International Journal of Applied Earth Observation and Geoinformation, 5,205-218. |
| [4] | Jordan CF (1969). Derivation of leaf area index from quality of light on the forest floor. Ecology, 50,663-666. |
| [5] | Lee T, Reddy KR, Sassenrath-Cole GF (2000). Reflectance indices with precision and accuracy in predicting cotton leaf nitrogen concentration. Crop Science, 40,1814-1819. |
| [6] | Li JH(李俊华), Dong ZX(董志新), Zhu JZ(朱继正) (2003). Present application and outlook for method of nitrogen nutrition diagnosis. Journal of Shihezi University (Natural Science Edition) (石河子大学学报(自然科学版)), 7(1),80-83. (in Chinese with English abstract) |
| [7] | Li YX(李映雪), Zhu Y(朱艳), Tian YC(田永超), Yao X(姚霞), Qin XD(秦小东), Cao WX(曹卫星) (2005). Quantitative relationship between leaf nitrogen accumulation and canopy reflectance spectra in wheat. Acta Agronomica Sinica (作物学报), 32,203-209. (in Chinese with English abstract) |
| [8] | Pearson RL, Miller LD (1972). Remote mapping of standing crop biomass for estimation of the productivity of the shortgrass prairie. Proceedings of the Eighth International Symposium on Remote Sensing of Environment. Environmental Research Institute of Michigan, Ann Arbor, MI,1357-1381. |
| [9] | Roth GW, Fox RH, Marshall HG (1989). Plant tissue test for predicting nitrogen fertilizer requirement of winter wheat. Agronomy Journal, 81,502-507. |
| [10] | Rouse JW, Haas RH, Schell JA, Deering DW, Harlan JC (1974). Monitoring the vernal advancement of retrogradation of natural vegetation. NASA/GSFC, Type Ⅲ, Final Report, Greenbelt, Maryland, USA,1-371. |
| [11] | Stone ML, Soile JB, Raun WR, Whitney RW, Taylor SL, Ringer JD (1996). Use of spectral radiance for correcting in-season fertilizer nitrogen deficiencies in winter wheat. Transactions of the American Society of Agricultural Engineers, 39,1623-1631. |
| [12] | Takebe M, Yoneyama T, Inada K, Murakami T (1990). Spectral reflectance ratio of rice canopy for estimating crop nitrogen status. Plant and Soil, 122,295-297. |
| [13] | Takihashi W, Nguyen-Cong V, Kawaguchi S, Minamiyama M, Ninomiya S (2000). Statistical models for prediction of dry weight and nitrogen accumulation based on visible and near-infrared hyper-spectral reflectance. Plant Production Science, 3,377-386. |
| [14] | Xue LH, Cao WX, Luo WH, Dai TB, Zhu Y (2004). Monitoring leaf nitrogen status in rice with canopy spectral reflectance. Agronomy Journal, 96,135-142. |
| [15] | Xue LH(薛利红), Cao WX(曹卫星), Luo WH(罗卫红), Zhang X(张宪) (2004). Correlation between leaf nitrogen status and canopy spectral characteristics in wheat. Acta Phytoecologica Sinica(植物生态学报), 28,172-177. (in Chinese with English abstract) |
| [16] | Zhang JH(张金恒), Wang K(王珂), Wang RC(王人潮), Zheng HF(郑洪福), Zhou B(周斌) (2004). Sensitive band ranges of leaf spectral reflectance in diagnosis of rice nitrogen nutrition. Journal of Zhejiang University (Agriculture & Life Science) (浙江大学学报(农业与生命科学版)), 30,304-346. (in Chinese with English abstract) |
| [17] | Zhang QJ(张庆江), Zhang LY(张立言), Bi HW(毕桓武) (1996). Accumulation and distribution of carbohydrate and nitrogen and their relationships to grain protein content in wheat. Acta Agriculturae Boreali-Sinica(华北农学报), 11(3),57-62. (in Chinese with English abstract) |
| [18] | Zhang XJ(张喜杰), Li MZ(李民赞), Zhang YE(张彦娥), Zhao P(赵朋), Zhang JP(张建平) (2004). Estimating nitrogen concentration of cucumber leaf based on solar irradiance spectral reflectance in greenhouse. Transactions of the Chinese Society of Agricultural Engineering (农业工程学报), 20(6),11-14. (in Chinese with English abstract) |
| [1] | 陈雪萍, 赵学勇, 张晶, 王瑞雄, 卢建男. 基于地理探测器的科尔沁沙地植被NDVI时空变化特征及其驱动因素[J]. 植物生态学报, 2023, 47(8): 1082-1093. |
| [2] | 缪丽娟, 张宇阳, 揣小伟, 包刚, 何昱, 朱敬雯. 亚洲旱区草地NDVI对气候变化的响应及滞后效应[J]. 植物生态学报, 2023, 47(10): 1375-1385. |
| [3] | 朱玉英, 张华敏, 丁明军, 余紫萍. 青藏高原植被绿度变化及其对干湿变化的响应[J]. 植物生态学报, 2023, 47(1): 51-64. |
| [4] | 文可, 姚焕玫, 龚祝清, 纳泽林, 韦毅明, 黄以, 陈华权, 廖鹏任, 唐丽萍. 水淹频率变化对鄱阳湖增强型植被指数的影响[J]. 植物生态学报, 2022, 46(2): 148-161. |
| [5] | 原媛, 母艳梅, 邓钰洁, 李鑫豪, 姜晓燕, 高圣杰, 查天山, 贾昕. 植被覆盖度和物候变化对典型黑沙蒿灌丛生态系统总初级生产力的影响[J]. 植物生态学报, 2022, 46(2): 162-175. |
| [6] | 熊淑萍, 曹文博, 曹锐, 张志勇, 付新露, 徐赛俊, 潘虎强, 王小纯, 马新明. 水平结构配置对冬小麦冠层垂直结构、微环境及产量的影响[J]. 植物生态学报, 2022, 46(2): 188-196. |
| [7] | 刘宁, 彭守璋, 陈云明. 气候因子对青藏高原植被生长的时间效应[J]. 植物生态学报, 2022, 46(1): 18-26. |
| [8] | 倪铭, 张曦月, 姜超, 王鹤松. 中国西南部地区植被对极端气候事件的响应[J]. 植物生态学报, 2021, 45(6): 626-640. |
| [9] | 汲玉河, 周广胜, 王树东, 王丽霞, 周梦子. 2000-2019年秦岭地区植被生态质量演变特征及 驱动力分析[J]. 植物生态学报, 2021, 45(6): 617-625. |
| [10] | 陈哲, 汪浩, 王金洲, 石慧瑾, 刘慧颖, 贺金生. 基于物候相机归一化植被指数估算高寒草地植物地上生物量的季节动态[J]. 植物生态学报, 2021, 45(5): 487-495. |
| [11] | 周明星, 李登秋, 邹建军. 基于稠密Landsat数据的邛崃山大熊猫栖息地植被变化研究[J]. 植物生态学报, 2021, 45(4): 355-369. |
| [12] | 徐光来, 李爱娟, 徐晓华, 杨先成, 杨强强. 中国生态功能保护区归一化植被指数动态及气候因子驱动[J]. 植物生态学报, 2021, 45(3): 213-223. |
| [13] | 张文强, 罗格平, 郑宏伟, 王浩, HAMDI Rafiq, 何惠丽, 蔡鹏, 陈春波. 基于随机森林模型的内陆干旱区植被指数变化与驱动力分析: 以北天山北坡中段为例[J]. 植物生态学报, 2020, 44(11): 1113-1126. |
| [14] | 史娜娜, 肖能文, 王琦, 韩煜, 高晓奇, 冯瑾, 全占军. 锡林郭勒植被NDVI时空变化及其驱动力定量分析[J]. 植物生态学报, 2019, 43(4): 331-341. |
| [15] | 赵芸, 贾荣亮, 高艳红, 周媛媛, 滕嘉玲. 腾格里沙漠人工固沙植被演替过程中生物土壤结皮归一化植被指数的变化特征[J]. 植物生态学报, 2017, 41(9): 972-984. |
| 阅读次数 | ||||||
|
全文 |
|
|||||
|
摘要 |
|
|||||
Copyright © 2022 版权所有 《植物生态学报》编辑部
地址: 北京香山南辛村20号, 邮编: 100093
Tel.: 010-62836134, 62836138; Fax: 010-82599431; E-mail: apes@ibcas.ac.cn, cjpe@ibcas.ac.cn
备案号: 京ICP备16067583号-19