
植物生态学报 ›› 2007, Vol. 31 ›› Issue (5): 834-841.DOI: 10.17521/cjpe.2007.0105 cstr: 32100.14.cjpe.2007.0105
刘伟1,2, 朱丽1,2, 桑卫国1,*( )
)
收稿日期:2006-01-18
接受日期:2006-09-13
出版日期:2007-01-18
发布日期:2007-09-30
作者简介:* E-mail: swg@ibcas.ac.cn基金资助:
LIU Wei1,2, ZHU Li1,2, SANG Wei-Guo1,*()
Received:2006-01-18
Accepted:2006-09-13
Online:2007-01-18
Published:2007-09-30
摘要:
反枝苋(Amaranthus retroflexus)是苋属入侵种中发生频率最多、分布最广、危害最严重的杂草。基于反枝苋在世界范围内4 207个实际分布点及其对应的气候、地形和土壤3类要素28个环境因子的定量关系,利用主成分分析确定了影响其分布的主要环境因子,据此估测其中心可能分布区和最大可能分布区,并与实际分布点进行比较。结果表明:14个环境因子在决定反枝苋全球分布格局中起着重要作用。反枝苋中心分布区位于新西兰南部、澳大利亚东南部、南美洲北部少数地区、北美洲西北部及东南部部分地区、欧洲大部分地区和中国东南部,最大可能分布区位于南美洲中南部、北美洲大部分、非洲北部小部分、澳大利亚南部及北部少数区域、欧洲大部分地区和亚洲大部分地区及中国除西藏、青海、新疆、四川西部以外的地区。中心分布区的预测结果与实际分布点吻合较好,而最大分布区则过于广阔。
刘伟, 朱丽, 桑卫国. 影响入侵种反枝苋分布的环境因子分析及可能分布区预测. 植物生态学报, 2007, 31(5): 834-841. DOI: 10.17521/cjpe.2007.0105
LIU Wei, ZHU Li, SANG Wei-Guo. POTENTIAL GLOBAL GEOGRAPHICAL DISTRIBUTION OF AMARANTHUS RETROFLEXUS. Chinese Journal of Plant Ecology, 2007, 31(5): 834-841. DOI: 10.17521/cjpe.2007.0105
| 主成分次序 No. of components | 贡献率 Contribution (%) | |
|---|---|---|
| 1 | 41.747 | |
| 2 | 19.932 | |
| 3 | 14.726 | |
| 累计Sum | 76.405 | |
表1 影响反枝苋分布的环境因子前3个主成分的贡献率
Table 1 Contribution of environmental factors in the first three principle components
| 主成分次序 No. of components | 贡献率 Contribution (%) | |
|---|---|---|
| 1 | 41.747 | |
| 2 | 19.932 | |
| 3 | 14.726 | |
| 累计Sum | 76.405 | |
| 环境指标 Environmental indexes | 主成分1 Component 1 | 主成分2 Component 2 |
|---|---|---|
| 气温年较差 Temperature annual range (℃) | 0.960 | -0.053 |
| 温度变差系数 Temperature seasonality | 0.911 | -0.214 |
| 最干季度的降雨量 Precipitation of the driest quarter (mm) | -0.907 | -0.010 |
| 最干月份的降雨量 Precipitation of the driest month (mm) | -0.906 | -0.037 |
| 最冷季度的降雨量 Precipitation of the coldest quarter (mm) | -0.861 | 0.089 |
| 降水变差系数 Precipitation seasonality coefficient of variation | 0.856 | 0.155 |
| 极端最低温 Min temperature of the coldest month (℃) | -0.820 | 0.459 |
| 月温差 Mean diurnal range (℃) | 0.783 | 0.354 |
| 土壤水分 Soil moisture (g·kg-1) | -0.760 | -0.080 |
| 太阳辐射 Radiation (MJ·m-2) | 0.744 | 0.534 |
| 最冷季度的平均温度 Mean temperature of the coldest quarter (℃) | -0.665 | 0.650 |
| 极端最高温 Max temperature of the warmest month (℃) | 0.694 | 0.635 |
| 土壤pH值 Soil pH value | 0.680 | 0.238 |
| 最暖季度的平均温度 Mean temperature of the warmest quarter (℃) | 0.649 | 0.682 |
| 最干季度的平均温度 Mean temperature of the driest quarter (℃) | -0.639 | 0.561 |
| 霜冻日 Frost day (d) | 0.628 | -0.614 |
| 最湿季度的平均温度 Mean temperature of wettest quarter (℃) | 0.610 | 0.278 |
| 海拔 Altitude (m) | 0.588 | -0.067 |
| 年降雨量 Annual precipitation (mm) | -0.568 | 0.418 |
| 可能蒸散率 Potential evapotranspiration ratio (℃·mm-1) | -0.565 | 0.416 |
| 土壤有机碳储量 Soil carbon (kg·m-2) | -0.422 | -0.282 |
| 坡度 Slope (°) | 0.356 | -0.135 |
| 最暖季度的降雨量 Precipitation of the warmest quarter (mm) | 0.206 | 0.510 |
| 最湿月份的降雨量 Precipitation of the wettest month (mm) | 0.199 | 0.219 |
| 生物温度 Biotemperature (℃) | 0.153 | 0.937 |
| 年平均温度 Annual mean temperature (℃) | -0.143 | 0.926 |
| 最湿季度的降雨量 Precipitation of wettest quarter (mm) | 0.062 | 0.506 |
| 坡向 Aspect (°) | 0.032 | -0.021 |
表2 影响反枝苋分布的28个环境因子在前两个主成分上的负荷量
Table 2 Load of 28 environmental indexes in the first two principle components that affecting the distribution of Amaranthus retroflexus
| 环境指标 Environmental indexes | 主成分1 Component 1 | 主成分2 Component 2 |
|---|---|---|
| 气温年较差 Temperature annual range (℃) | 0.960 | -0.053 |
| 温度变差系数 Temperature seasonality | 0.911 | -0.214 |
| 最干季度的降雨量 Precipitation of the driest quarter (mm) | -0.907 | -0.010 |
| 最干月份的降雨量 Precipitation of the driest month (mm) | -0.906 | -0.037 |
| 最冷季度的降雨量 Precipitation of the coldest quarter (mm) | -0.861 | 0.089 |
| 降水变差系数 Precipitation seasonality coefficient of variation | 0.856 | 0.155 |
| 极端最低温 Min temperature of the coldest month (℃) | -0.820 | 0.459 |
| 月温差 Mean diurnal range (℃) | 0.783 | 0.354 |
| 土壤水分 Soil moisture (g·kg-1) | -0.760 | -0.080 |
| 太阳辐射 Radiation (MJ·m-2) | 0.744 | 0.534 |
| 最冷季度的平均温度 Mean temperature of the coldest quarter (℃) | -0.665 | 0.650 |
| 极端最高温 Max temperature of the warmest month (℃) | 0.694 | 0.635 |
| 土壤pH值 Soil pH value | 0.680 | 0.238 |
| 最暖季度的平均温度 Mean temperature of the warmest quarter (℃) | 0.649 | 0.682 |
| 最干季度的平均温度 Mean temperature of the driest quarter (℃) | -0.639 | 0.561 |
| 霜冻日 Frost day (d) | 0.628 | -0.614 |
| 最湿季度的平均温度 Mean temperature of wettest quarter (℃) | 0.610 | 0.278 |
| 海拔 Altitude (m) | 0.588 | -0.067 |
| 年降雨量 Annual precipitation (mm) | -0.568 | 0.418 |
| 可能蒸散率 Potential evapotranspiration ratio (℃·mm-1) | -0.565 | 0.416 |
| 土壤有机碳储量 Soil carbon (kg·m-2) | -0.422 | -0.282 |
| 坡度 Slope (°) | 0.356 | -0.135 |
| 最暖季度的降雨量 Precipitation of the warmest quarter (mm) | 0.206 | 0.510 |
| 最湿月份的降雨量 Precipitation of the wettest month (mm) | 0.199 | 0.219 |
| 生物温度 Biotemperature (℃) | 0.153 | 0.937 |
| 年平均温度 Annual mean temperature (℃) | -0.143 | 0.926 |
| 最湿季度的降雨量 Precipitation of wettest quarter (mm) | 0.062 | 0.506 |
| 坡向 Aspect (°) | 0.032 | -0.021 |
| 环境指标 Environmental indexes | 最小值 Minimum | 最大值 Maximum | 均值 Mean | 标准偏差 Standard deviation |
|---|---|---|---|---|
| 年平均温度Annual mean temperature (℃) | -3.5 | 27.3 | 8.91 | 1.61 |
| 月温差Mean diurnal range (℃) | 5.2 | 18.7 | 8.22 | 1.46 |
| 温度变差系数Temperature seasonality | 8.3 | 159.7 | 63.97 | 13.70 |
| 极端最低温Min temperature of the coldest month (℃) | -33.2 | 18.1 | -2.95 | 3.45 |
| 生物温度Biotemperature (℃) | 3.7 | 27.2 | 9.02 | 1.44 |
| 气温年较差Temperature annual range (℃) | 16.4 | 58.1 | 25.71 | 4.86 |
| 最冷季度的平均温度Mean temperature of the coldest quarter (℃) | -24.2 | 26.2 | 0.64 | 2.88 |
| 最干月份的降雨量Precipitation of the driest month (mm) | 0 | 85 | 39.83 | 12.84 |
| 降水变差系数Precipitation seasonality | 8 | 145 | 23.90 | 17.55 |
| 最干季度的降雨量Precipitation of the driest quarter (mm) | 1 | 311 | 130.10 | 40.16 |
| 最冷季度的降雨量Precipitation of the coldest quarter (mm) | 3 | 623 | 151.51 | 56.50 |
| 太阳辐射Radiation (MJ·m-2) | 77 | 201 | 107.63 | 15.53 |
| 海拔Altitude (m) | -3 | 2 465 | 217.946 | 250.22 |
| 土壤水分Soil moisture (g·kg-1) | 0.73 | 149.9 | 82.55 | 34.87 |
表3 影响反枝苋在世界范围地理分布的14个主要环境指标
Table 3 Fourteen main environmental indexes affecting the distribution of Amaranthus retroflexus in the world
| 环境指标 Environmental indexes | 最小值 Minimum | 最大值 Maximum | 均值 Mean | 标准偏差 Standard deviation |
|---|---|---|---|---|
| 年平均温度Annual mean temperature (℃) | -3.5 | 27.3 | 8.91 | 1.61 |
| 月温差Mean diurnal range (℃) | 5.2 | 18.7 | 8.22 | 1.46 |
| 温度变差系数Temperature seasonality | 8.3 | 159.7 | 63.97 | 13.70 |
| 极端最低温Min temperature of the coldest month (℃) | -33.2 | 18.1 | -2.95 | 3.45 |
| 生物温度Biotemperature (℃) | 3.7 | 27.2 | 9.02 | 1.44 |
| 气温年较差Temperature annual range (℃) | 16.4 | 58.1 | 25.71 | 4.86 |
| 最冷季度的平均温度Mean temperature of the coldest quarter (℃) | -24.2 | 26.2 | 0.64 | 2.88 |
| 最干月份的降雨量Precipitation of the driest month (mm) | 0 | 85 | 39.83 | 12.84 |
| 降水变差系数Precipitation seasonality | 8 | 145 | 23.90 | 17.55 |
| 最干季度的降雨量Precipitation of the driest quarter (mm) | 1 | 311 | 130.10 | 40.16 |
| 最冷季度的降雨量Precipitation of the coldest quarter (mm) | 3 | 623 | 151.51 | 56.50 |
| 太阳辐射Radiation (MJ·m-2) | 77 | 201 | 107.63 | 15.53 |
| 海拔Altitude (m) | -3 | 2 465 | 217.946 | 250.22 |
| 土壤水分Soil moisture (g·kg-1) | 0.73 | 149.9 | 82.55 | 34.87 |
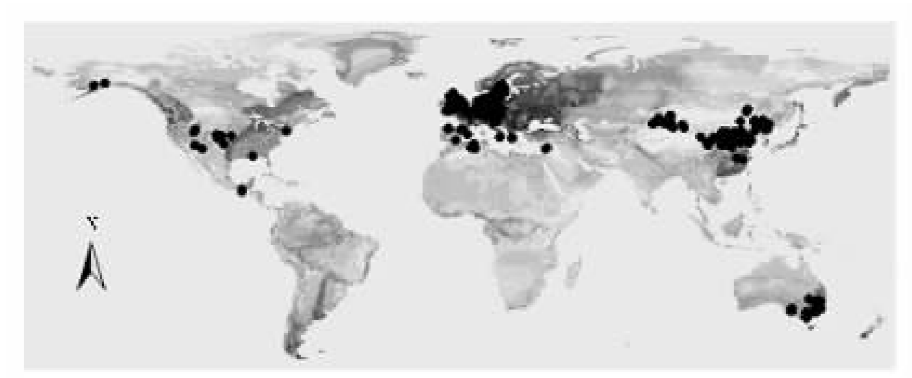
图1 反枝苋全球范围的实际分布点和估测中心分布范围 图中点为反枝苋实际分布点,颜色越深,代表预测的分布概率越大
Fig.1 Actual distribution sites and central possible distribution ranges of Amaranthus retroflexus in the world The points in the figure represent actual distribution sites of Amaranthus retroflexus in the world, darker color means higher distribution probability
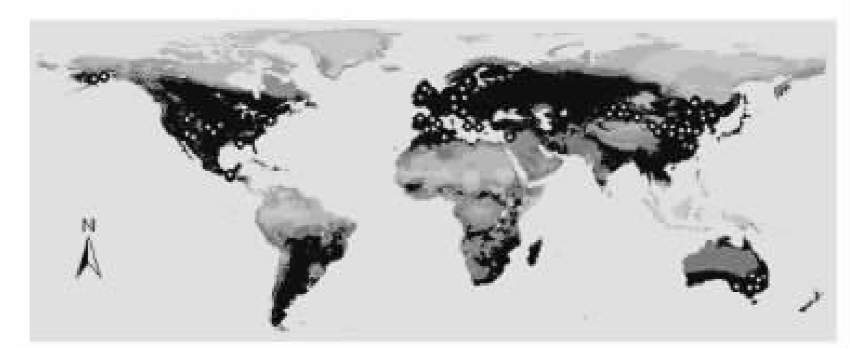
图2 反枝苋全球范围的实际分布点和估测最大分布范围 图注见图1
Fig.2 Actual distribution sites and maximum possible distribution area of Amaranthus retroflexus in the world Note see Fig. 1
| [1] | Austin MP (1980). Searching for a model for use in vegetation analysis. Vegetatio, 42,11-21. |
| [2] | Austin MP, Cunningham RB, Fleming PM (1984). New approaches to direct gradient analysis using environmental scalars and statistical curve-fitting procedures. Vegetatio, 55,11-27. |
| [3] | Austin MP (1985). Continuum concept, ordination methods and niche theory. Annual Review of Ecology and Systematics, 16,39-61. |
| [4] | Austin MP, Smith TM (1989). A new model for the continuum concept. Vegetatio, 83,35-47. |
| [5] | Bai ZH (白章红), Zhou GL (周国梁), Qian TR (钱天荣), Jiang ZF (蒋樟法) (1997). Study on establishment of karnal bunt disease in China. Plant Quarantine (植物检疫), 11,331-334. (in Chinese with English abstract) |
| [6] | Baker RHA, Sansford CE, Jarvis CH, Cannon RJC, Macleod A, Walters KFA (2000). The role of climatic mapping in predicting potential distribution of non-indigenous pests under current and future climates. Agriculture Ecosystems and Environment, 82,57-71. |
| [7] | Chen CY (陈成永) (2004). Electronic Map of China (全中国电子地图). China Map Press, Beijing. (in Chinese) |
| [8] | Chen YQ (陈永强), Lü J (吕军), Liu YL (柳云龙) (2001). Study on evaluation index system of red soil degradation. Journal of Soil and Water Conservation (水土保持学报), 15(2),72-76. (in Chinese with English abstract) |
| [9] | ESRI (2003). Arcview GIS, Version 8.3. Environmental Systems Research Institute, Inc., Redlands, California, USA. |
| [10] | Fang JY (方精云), Li Y (李莹) (2002). Climate factors for limiting northward distribution of eight temperate tree species in eastern North America. Acta Botanica Sinica (植物学报), 44,199-203.(in English with Chinese abstract). |
| [11] | Forman RTT (1964). Growth under controlled conditions to explain the hierarchical distributions of a moss, Tetraphis pellucida. Ecological Monographs, 19,474-499. |
| [12] | Global Ecosystems Database (2000). National Geophysical Data Center. Available from http://www.ngdc.noaa.gov/seg/ecosys/ecosys.shtml. |
| [13] | Guisan A, Zimmermann NE (2000). Predictive habitat distribution models in ecology. Ecological Modeling, 135,147-186. |
| [14] | Hijmans RJ, Cameron SE, Parra JL, Jones PG, Jarvis A (2004). The WorldClim Interpolated Global Terrestrial Climate Surfaces. Version 1.3. Available at http://biogeo.berkeley.edu/. |
| [15] | Institute of Gazetteer Research, State Bureau of Surveying and Mapping (国家测绘局地名研究所) (1994). Gazetteer of China (中国地名录). China Map Press, Beijing. (in Chinese) |
| [16] | International Geosphere-Biosphere Programme, Data and Information System IGBP-DIS (2000). Global Soil Data Task. Available from http://sage.wisc.edu/atlas/. |
| [17] | Intergovernmental Panel on Climate Change (2003). Data Distribution Center. Available from http://ipcc-ddc.cru.uea.ac.uk/. |
| [18] | Jiang X (蒋霞), Ni J (倪健) (2005). Species-climate relationships of 10 desert plant species and their estimated potential distribution range in the arid lands of northwestern China. Acta Phytoecologica Sinica (植物生态学报), 29,98-107. (in Chinese with English abstract) |
| [19] | Kriticos DJ, Yonow T, Mcfadyen RE (2005). The potential distribution of Chromolaena odorata (siam weed) in relation to climate. Weed Research, 45,246-254. |
| [20] |
Lindsay SW, Person L, Thomas CJ (1998). Mapping the ranges and relative abundance of the two principal African malaria vectors, Anopheles gambiae sensu stricto and An. arabiensis, using climate data. Proceedings of the Royal Society B: Biological Sciences, 265,847-854.
URL PMID |
| [21] | Li XJ (李晓晶), Zhang HJ (张宏军), Ni HW (倪汉文) (2004). Review on the biological characters and control of Redroot pigweed (Amaranthus retroflexus L). Pesticide Science and Administration (农药科学与管理), 25(3),13-16. (in Chinese with English abstract) |
| [22] | Li YH (李扬汉) (1998). Weeds of China (中国杂草志). China Agriculture Press, Beijing. (in Chinese) |
| [23] | Li ZY (李振宇), Xie Y (解焱) (2002). Invasive Alien Species in China (中国外来入侵种). China Forestry Publishing House, Beijing. (in Chinese) |
| [24] | Ni HW (倪汉文), Zhang L (张丽), Chen Y (陈勇), Li SL (李善林) (2000). Yield loss model due to the infestation of weeds in summer maize. Acta Phytophylacica Sinica (植物保护学报), 27,163-167. (in Chinese with English abstract) |
| [25] | Papes M, Peterson AT (2003). Predicting the potential invasive distribution for Eupatorium adenophorum Spreng. in China. Journal of Wuhan Botanical Research (武汉植物学研究), 21,137-142. |
| [26] | Pimentel D, Lach L, Zuniga R, Morrison D (2000). Environmental and economic costs of non-indigenous species in the United States. BioScience, 50,53-65. |
| [27] | Qiang S (强胜), Cao XZ (曹学章) (2000). Survey and analysis of exotic weeds in China. Journal of Plant Resources and Environment (植物资源与环境学报), 9(4),34-38. (in Chinese) |
| [28] | Sang WG (桑卫国) (2002). Primary analysis of invasive characteristics of alien weeds in China. Review of China Agricultural Science and Technology (中国农业科技导报), 4(5),59-61. (in Chinese) |
| [29] | SPSS (2000). SPSS 10.0 for Windows. SPSS Inc. Chicago, USA. |
| [30] | Tang HY (唐洪元) (1987). Longitude distribution and harm of cropland weeds in N 26° of China. Journal of Weed Science (杂草学报), 1(2),8-10. (in Chinese with English abstract) |
| [31] |
Waage JK, Reaser JK (2001). A global strategy to defeat invasive species. Science, 292,1486.
DOI URL PMID |
| [32] | Wu HR (吴海荣), Qiang S (强胜) (2003). Quantitative survey on exotic weeds in autumn in Nanjing. Biodiversity Science (生物多样性), 11,432-438. (in Chinese with English abstract) |
| [33] | Xu RM (徐汝梅) (2003). Biological Invasion-Data Collection, Quantitative Analysis and Alarm in Advance (生物入侵——数据集成、数量分析与预警). Science Press, Beijing. (in Chinese) |
| [34] | Yu GR (于贵瑞), He HL (何洪林), Liu XA (刘新安) (2004). Atlas for Spatialized Information of Terrestrial Ecosystem in China—Volume of Climatological Elements (中国陆地生态系统空间化信息研究图集——气候要素分卷). China Meteorological Press, Beijing. (in Chinese) |
| [35] | Zhao YF (赵友福), Lin W (林伟) (1995). Primary study on potential distribution of Erwinia amylovora using geographic information system. Plant Quarantine (植物检疫), 9,321-326. (in Chinese) |
| [36] | Zheng JM (郑景明) (2004). Introduction to Ecology of Biological Invasion (入侵生态学导论). Postdoctoral Dissertation, Institute of Botany, Chinese Academy of Sciences, Beijing, 2. (in Chinese with English abstract) |
| [1] | 吴光进, 郭垚鑫, 任成杰, 王俊, 岳明, 赵发珠. 秦岭北麓不同植被类型土壤有机碳含量分布及其影响因素[J]. 植物生态学报, 2026, 50(预发表): 1-. |
| [2] | 田地, 迟小龙, 石亮, 刘宵含, 赵常提, 吴梅, 张玉忠, 高永亮. 塞罕坝地区优势造林树种叶片化学计量特征及其环境驱动[J]. 植物生态学报, 2026, 50(2): 362-373. |
| [3] | 韦鑫, 江蓝, 郑晨成, 朱静, 陈博, 李文周, 赖淑瑜, 刘金福, 何中声. 戴云山南坡海拔梯度上木本植物性系统分布特征及其影响因素[J]. 植物生态学报, 2026, 50(1): 150-159. |
| [4] | 黄美红, 牛梦秋, 杨鹏飞, 林洁, 廖周瑜, 陈建国, 向建英. 不同温度和埋藏深度对高山垫状植物山生福禄草种子出苗及幼苗生长的影响[J]. 植物生态学报, 2025, 49(12): 2092-2104. |
| [5] | 竹万宽, 许宇星, 黄润霞, 杜阿朋, 王志超. 雷州半岛桉树人工林生态系统水分利用效率旱雨季差异及其控制因素[J]. 植物生态学报, 2025, 49(12): 2015-2029. |
| [6] | 付照琦, 胡旭, 田沁瑞, 葛艳灵, 周红娟, 吴小云, 陈立欣. 晋西黄土区2种典型森林树种夜间液流特征及对环境因子的响应[J]. 植物生态学报, 2024, 48(9): 1128-1142. |
| [7] | 盘远方, 潘良浩, 邱思婷, 邱广龙, 苏治南, 史小芳, 范航清. 中国沿海红树林树高变异与环境适应机制[J]. 植物生态学报, 2024, 48(4): 483-495. |
| [8] | 王丽丽, 宋晓彤, 谷际岐, 邵小明. 西藏尖叶对齿藓形态特征与环境变化的关系及响应策略[J]. 植物生态学报, 2024, 48(10): 1351-1360. |
| [9] | 赵孟娟, 金光泽, 刘志理. 阔叶红松林3种典型蕨类叶功能性状的垂直变异[J]. 植物生态学报, 2023, 47(8): 1131-1143. |
| [10] | 李安艳, 黄先飞, 田源斌, 董继兴, 郑菲菲, 夏品华. 贵州草海草-藻型稳态转换过程中叶绿素a的变化及其影响因子[J]. 植物生态学报, 2023, 47(8): 1171-1181. |
| [11] | 杨丽琳, 邢万秋, 王卫光, 曹明珠. 新安江源区杉木树干液流速率变化及其对环境因子的响应[J]. 植物生态学报, 2023, 47(4): 571-583. |
| [12] | 陈雪纯, 刘虹, 朱少琦, 孙铭遥, 宇振荣, 王庆刚. 漓江流域不同弃耕年限下4种常见草本植物功能性状种内变化及其影响因素[J]. 植物生态学报, 2023, 47(4): 559-570. |
| [13] | 赵镇贤, 陈银萍, 王立龙, 王彤彤, 李玉强. 河西走廊荒漠区不同功能类群植物叶片建成成本的比较[J]. 植物生态学报, 2023, 47(11): 1551-1560. |
| [14] | 张潇, 武娟娟, 贾国栋, 雷自然, 张龙齐, 刘锐, 吕相融, 代远萌. 降水控制对侧柏液流变化特征及其水分来源的影响[J]. 植物生态学报, 2023, 47(11): 1585-1599. |
| [15] | 郑宁, 李素英, 王鑫厅, 吕世海, 赵鹏程, 臧琛, 许玉珑, 何静, 秦文昊, 高恒睿. 基于环境因子对叶绿素影响的典型草原植物生活型优势研究[J]. 植物生态学报, 2022, 46(8): 951-960. |
| 阅读次数 | ||||||
|
全文 |
|
|||||
|
摘要 |
|
|||||
Copyright © 2026 版权所有 《植物生态学报》编辑部
地址: 北京香山南辛村20号, 邮编: 100093
Tel.: 010-62836134, 62836138; Fax: 010-82599431; E-mail: apes@ibcas.ac.cn, cjpe@ibcas.ac.cn
备案号: 京ICP备16067583号-19
![]()