
植物生态学报 ›› 2016, Vol. 40 ›› Issue (4): 385-394.DOI: 10.17521/cjpe.2015.1102 cstr: 32100.14.cjpe.2015.1102
所属专题: 生态遥感及应用
王紫君1, 申广荣1,3,*( ), 朱赟1, 刘春江2,3, 王哲4, 韩玉洁4, 薛春燕4
收稿日期:2015-03-23
接受日期:2015-10-24
出版日期:2016-04-29
发布日期:2016-04-30
基金资助:
Zi-Jun WANG1, Guang-Rong SHEN1,3,*(), Yun ZHU1, Yu-Jie HAN4, Chun-Jiang LIU2,3, Zhe WANG4, Chun-Yan XUE4
Received:2015-03-23
Accepted:2015-10-24
Online:2016-04-29
Published:2016-04-30
摘要:
城市森林发挥着改善和维护城市生态环境质量的作用, 研究城市森林生物量和分布特点对其生态系统服务评价和林分经营均具有重要意义。该文根据上海城市森林的种植分布和经营状况利用2011年6月-2012年6月样地实测森林生物量数据和同期Landsat ETM+遥感图像, 在基于逐步回归分析建立森林生物量反演模型的基础上, 引入回归残差及空间分析, 研究了城市森林及其主要优势树种樟(Cinnamomum camphora)林分的生物量分布特征, 探讨了区域尺度森林生物量的遥感估测方法。结果表明: (1)上海城市森林生物量密度总体呈现中心城区(静安区、黄浦区等)较高, 生物量密度集中在35-70 t·hm-2之间, 郊区(嘉定区、青浦区等)空间分布状况相对较低, 生物量密度介于15-50 t·hm-2之间的变化特征。上海优势树种樟林分生物量密度范围为20-110 t·hm-2; 空间上呈现出东北部较高、西南部较低的变化特征。(2)上海城市森林及樟林分的生物量总量分别为3.57 Tg和1.33 Tg。林地面积小, 具有较高森林生物量密度的上海中心城区, 其森林生物量占总量的6.1%, 其中林地面积最小的静安区生物量最低, 仅占总量的0.11%。在所有区县中, 林地面积最大的崇明县、浦东新区具有较高的森林生物量, 分别占总量的20.08%和19.18%。(3)所建立的基于回归反距离插值的城市森林生物量估测模型, 其标准误差、平均绝对误差、平均相对误差分别为8.39、6.86、24.22%, 较回归模型分别降低了57.69%、55.43%、64.00%, 较空间插值的方法分别降低了62.21%、58.50%、65.40%。残差的引入减少了由于空间变异引发的城市森林生物量遥感估测的不确定性。相比基于实测数据通过空间插值的估测, 遥感为快速便捷、客观高效的森林生物量监测提供了可能, 更加完善的结果和模型的优化有待引入其他信息源如高分高光谱信息或改善残差空间分析方法获得。
王紫君, 申广荣, 朱赟, 刘春江, 王哲, 韩玉洁, 薛春燕. 基于遥感和空间分析的上海城市森林生物量分布特征. 植物生态学报, 2016, 40(4): 385-394. DOI: 10.17521/cjpe.2015.1102
Zi-Jun WANG, Guang-Rong SHEN, Yun ZHU, Yu-Jie HAN, Chun-Jiang LIU, Zhe WANG, Chun-Yan XUE. Research on characteristics of biomass distribution in urban forests of Shanghai metropolis based on remote sensing and spatial analysis. Chinese Journal of Plant Ecology, 2016, 40(4): 385-394. DOI: 10.17521/cjpe.2015.1102
| 林分类型 Forest type | 样地数 Number of plots | 平均胸径 Mean D (cm) | 平均树高 Mean tree height (m) | 林龄 Stand age (a) |
|---|---|---|---|---|
| 樟 Cinnamomum camphora | 15 | 7.8-21 | 5.4-13.6 | 12-18 |
| 水杉 Metasequoia glyptostroboides | 18 | 8.5-28.7 | 8.5-28.54 | 11-50 |
| 枫香树 Liquidambar formosana | 2 | 9.2-12.8 | 7.9-10.3 | 12-30 |
| 池杉 Taxodium distichum var. imbricatum | 4 | 9.4-17.3 | 8.0-14.6 | 12-30 |
| 无患子 Sapindus saponaria | 3 | 8.3-8.8 | 6.7-7.7 | 12 |
| 全缘叶栾树 Koelreuteria bipinnata var. integrifoliola | 3 | 8.9-9.5 | 8.6-8.8 | 12 |
| 女贞 Ligustrum lucidum | 3 | 10.0-10.9 | 7.7-8.6 | 12 |
| 银杏 Ginkgo biloba | 6 | 6.5-13.8 | 2.6-6.4 | 12-25 |
| 山杜英 Elaeocarpus sylvestri | 7 | 10.7-13.6 | 6.6-8.4 | 11 |
| 荷花玉兰 Magnolia grandiflora | 6 | 7.5-10.2 | 4.4-5.7 | 8-12 |
| 毛竹 Phyllostachys edulis | 5 | 8.0-9.3 | 11.2-11.8 | 2 |
| 意大利的‘I-214’杨 Populus × canadensis ‘I-214’ | 3 | 14.9-17.7 | 11.6-14.5 | 12 |
| 阔叶混交林 Broadleaved mixed forest | 18 | 6.7-17.4 | 4.1-17.2 | 10-15 |
| 总计 Total | 93 | 5.7-28.7 | 2.6-28.4 | 2-50 |
表1 不同林分样地信息
Table 1 Information on sampling plots of different forest types
| 林分类型 Forest type | 样地数 Number of plots | 平均胸径 Mean D (cm) | 平均树高 Mean tree height (m) | 林龄 Stand age (a) |
|---|---|---|---|---|
| 樟 Cinnamomum camphora | 15 | 7.8-21 | 5.4-13.6 | 12-18 |
| 水杉 Metasequoia glyptostroboides | 18 | 8.5-28.7 | 8.5-28.54 | 11-50 |
| 枫香树 Liquidambar formosana | 2 | 9.2-12.8 | 7.9-10.3 | 12-30 |
| 池杉 Taxodium distichum var. imbricatum | 4 | 9.4-17.3 | 8.0-14.6 | 12-30 |
| 无患子 Sapindus saponaria | 3 | 8.3-8.8 | 6.7-7.7 | 12 |
| 全缘叶栾树 Koelreuteria bipinnata var. integrifoliola | 3 | 8.9-9.5 | 8.6-8.8 | 12 |
| 女贞 Ligustrum lucidum | 3 | 10.0-10.9 | 7.7-8.6 | 12 |
| 银杏 Ginkgo biloba | 6 | 6.5-13.8 | 2.6-6.4 | 12-25 |
| 山杜英 Elaeocarpus sylvestri | 7 | 10.7-13.6 | 6.6-8.4 | 11 |
| 荷花玉兰 Magnolia grandiflora | 6 | 7.5-10.2 | 4.4-5.7 | 8-12 |
| 毛竹 Phyllostachys edulis | 5 | 8.0-9.3 | 11.2-11.8 | 2 |
| 意大利的‘I-214’杨 Populus × canadensis ‘I-214’ | 3 | 14.9-17.7 | 11.6-14.5 | 12 |
| 阔叶混交林 Broadleaved mixed forest | 18 | 6.7-17.4 | 4.1-17.2 | 10-15 |
| 总计 Total | 93 | 5.7-28.7 | 2.6-28.4 | 2-50 |
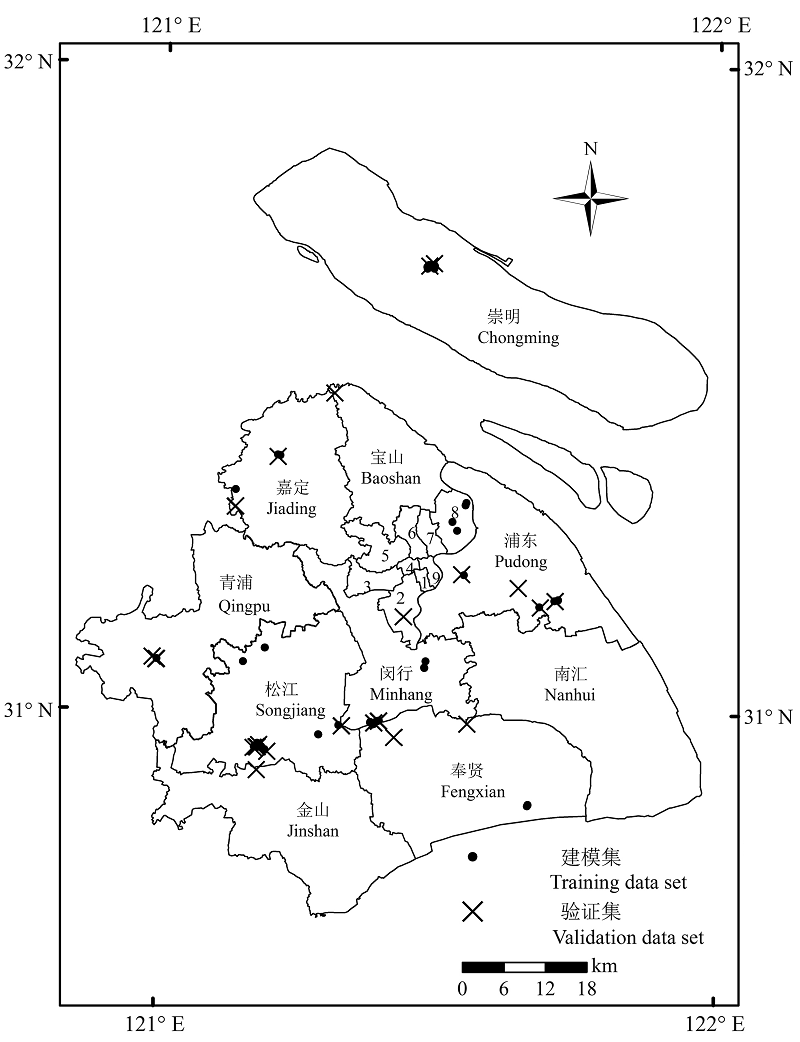
图1 研究区样地分布图。图中的1-9为上海中心城区, 分别代表: 卢湾、徐汇、长宁、静安、普陀、闸北、虹口、杨浦和黄浦区。
Fig. 1 The map of sample plot distributions. Numbers 1-9 represent the nine districts in the central city, namely Luwan, Xuhui, Changning, Jing’an, Putuo, Zhabei, Hongkou, Yangpu and Huangpu, respectively.
| 样地数 Number of plots | 模型公式 Model equation | 决定系数 Coefficient of determination | 校正决定系数 Adjusted coefficient of determination | |
|---|---|---|---|---|
| 城市森林 Urban forest | 62 | Y = 82.941-2.564 × X1 + 0.651 × X2 | 0.46 | 0.44 |
| 樟 Cinnamomum camphora | 15 | Y = 125.6 × exp(-0.833 × X3) | 0.56 | 0.52 |
表2 上海城市森林及樟林分生物量的回归模型
Table 2 Regression models for biomass in urban forests and Cinnamomum camphora trees in the Shanghai metropolis
| 样地数 Number of plots | 模型公式 Model equation | 决定系数 Coefficient of determination | 校正决定系数 Adjusted coefficient of determination | |
|---|---|---|---|---|
| 城市森林 Urban forest | 62 | Y = 82.941-2.564 × X1 + 0.651 × X2 | 0.46 | 0.44 |
| 樟 Cinnamomum camphora | 15 | Y = 125.6 × exp(-0.833 × X3) | 0.56 | 0.52 |
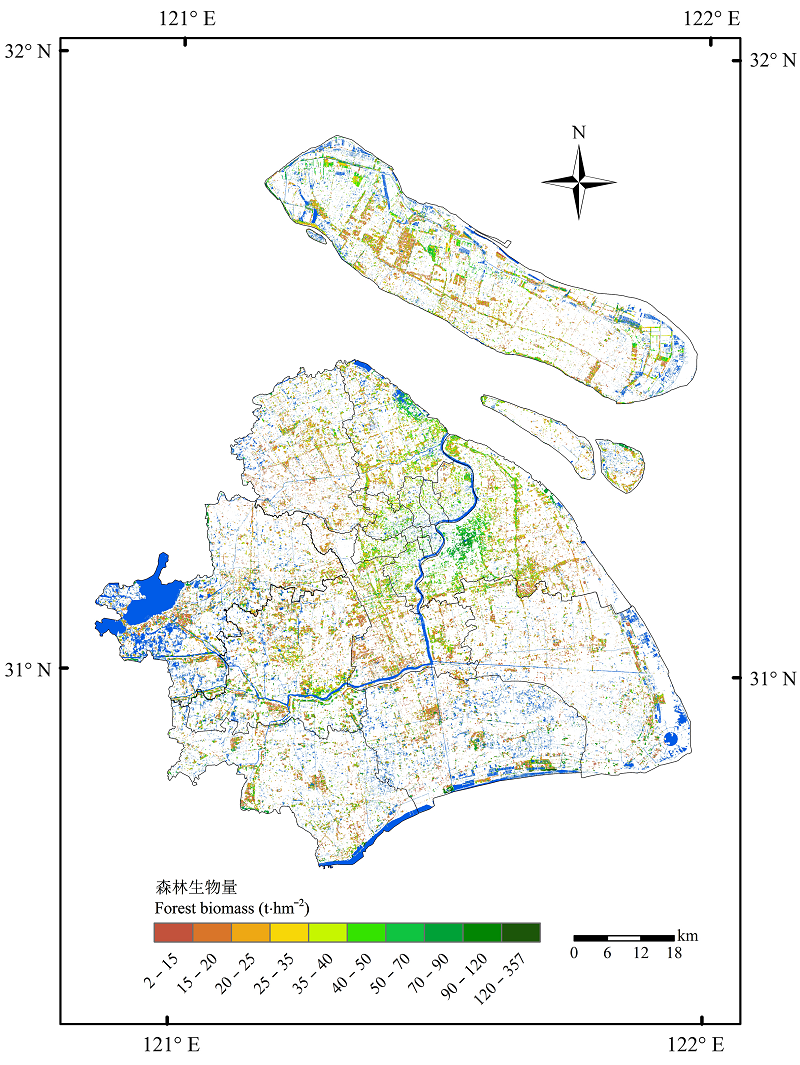
图2 上海城市森林生物量的空间分布图。
Fig. 2 Map of spatial distribution of urban forest biomass in the Shanghai metropolis.
| 回归模型 Regression model | 回归反距离插值模型 IDW regression model | ||||||
|---|---|---|---|---|---|---|---|
| 标准误差 RMSE | 平均绝对误差 MAE | 平均相对误差 MRE | 标准误差 RMSE | 平均绝对误差 MAE | 平均相对误差 MRE | ||
| 城市森林 Urban forest | 19.83 | 15.39 | 67.30% | 8.39 | 6.86 | 24.22% | |
| 樟 Cinnamomum camphora | 10.90 | 8.92 | 24.93% | 10.42 | 7.33 | 19.74% | |
表3 基于回归模型和回归反距离插值的上海城市森林及樟林分生物量估测结果
Table 3 Results of evaluations on estimation of urban forest biomass and Cinnamomum camphora tree biomass based on regression model and combination of regression model and spatial analysis (IDW regression model) from validation sites in the Shanghai metropolis
| 回归模型 Regression model | 回归反距离插值模型 IDW regression model | ||||||
|---|---|---|---|---|---|---|---|
| 标准误差 RMSE | 平均绝对误差 MAE | 平均相对误差 MRE | 标准误差 RMSE | 平均绝对误差 MAE | 平均相对误差 MRE | ||
| 城市森林 Urban forest | 19.83 | 15.39 | 67.30% | 8.39 | 6.86 | 24.22% | |
| 樟 Cinnamomum camphora | 10.90 | 8.92 | 24.93% | 10.42 | 7.33 | 19.74% | |
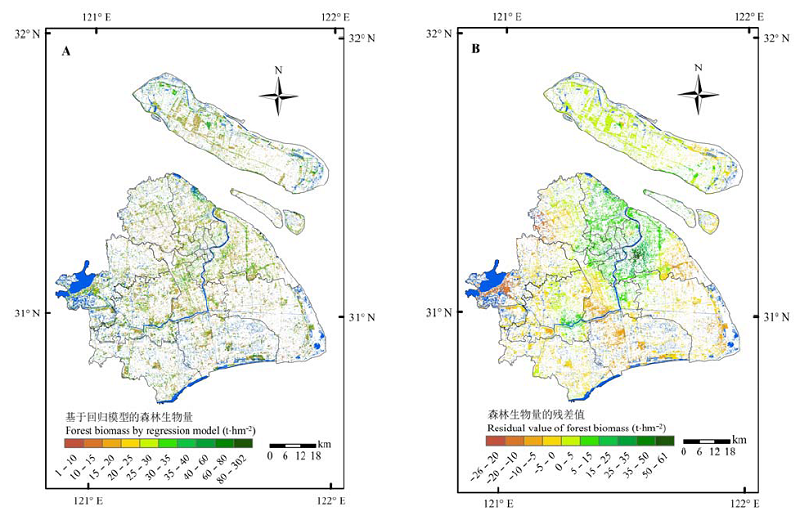
图3 基于回归模型的上海城市森林生物量的分布图(A)及其残差分布图(B)。
Fig. 3 Maps of spatial distribution of urban forest biomass based on regression model (A) and its residual (B) in the Shanghai metropolis.
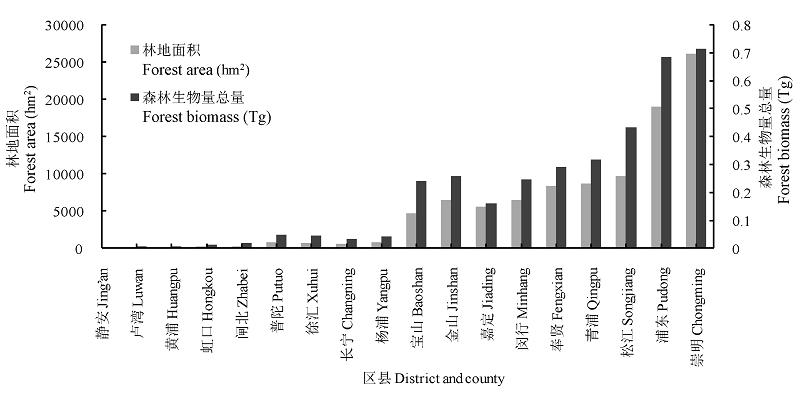
图4 上海各区县林地面积与森林生物量总量图。
Fig. 4 Chart of forest biomass and relative areas for different districts and counties in the Shanghai metropolis.
| 1 | Antonarakis AS, Saatchi SS, Chazdon RL, Moorcroft PR (2011). Using Lidar and Radar measurements to constrain predictions of forest ecosystem structure and function.Ecological Applications, 21, 1120-1137. |
| 2 | Asner GP, Mascaro J, Muller-Landau HC, Vieilledent G, Vaudry R, Rasamoelina M, Hall JS, van Breugel M (2012). A universal airborne LiDAR approach for tropical forest carbon mapping.Oecologia, 168, 1147-1160. |
| 3 | Barbosa JM, Broadbent EN, Bitencourt MD (2014b). Remote sensing of aboveground biomass in tropical secondary forests: A review.International Journal of Forestry Research, 2014, 1-14. |
| 4 | Barbosa JM, Melendez-Pastor I, Navarro-Pedreño J, Bitencourt MD (2014a). Remotely sensed biomass over steep slopes: An evaluation among successional stands of the Atlantic Forest, Brazil.ISPRS Journal of Photogrammetry and Remote Sensing, 88, 91-100. |
| 5 | Burrough PA, McDonnell RA (1998). Principles of Geogra- phical Information Systems. 2nd ed. Oxford University Press, Oxford, UK. |
| 6 | Eckert S, Ratsimba HR, Rakotondrasoa LO, Rajoelison LG, Ehrensperger A (2011). Deforestation and forest degrada- tion monitoring and assessment of biomass and carbon stock of lowland rainforest in the Analanjirofo region, Madagascar.Forest Ecology and Management, 262, 1996-2007. |
| 7 | Hall FG, Bergen K, Blair JB, Dubayah R, Houghton R, Hurtt G, Kellndorfer J, Lefsky M, Ranson J, Saatchi S, Shugarti HH, Wicklande D (2011). Characterizing 3D vegetation structure from space: Mission requirements.Remote Sensing of Environment, 115, 2753-2775. |
| 8 | Liu CF, He XY, Chen W, Zhao GL, Li L, Xu WD (2008). Ecological benefit evaluation of urban forests in Shenyang City based on QuickBird image and CITYgreen model.Chinese Journal of Applied Ecology, 19, 1865-1870. (in Chinese with English abstract)[刘常富, 何兴元, 陈玮, 赵桂玲, 李玲, 徐文铎 (2008). 基于QuickBird和CITY- green的沈阳城市森林效益评价. 应用生态学报, 19, 1865-1870.] |
| 9 | Liu SN, Zhou T, Shu Y, Dai M, Wei LY, Zhang X (2012). The estimating of the spatial distribution of forest biomass in China based on remote sensing and downscaling techniques.Acta Ecologica Sinica, 32, 2320-2330. (in Chinese with English abstract)[刘双娜, 周涛, 舒阳, 戴铭, 魏林艳, 张鑫 (2012). 基于遥感降尺度估算中国森林生物量的空间分布. 生态学报, 32, 2320-2330.] |
| 10 | Lu DS (2006). The potential and challenge of remote sensing-based biomass estimation.International Journal of Remote Sensing, 27, 1297-1328. |
| 11 | Manna S, Nandy S, Chanda A, Akhand A, Hazra S, Dadhwal VK (2014). Estimating aboveground biomass in Avicennia marina plantation in Indian Sundarbans using high- resolution satellite data.Journal of Applied Remote Sensing, 8, 1-12. |
| 12 | Pereira P, Oliva M, Baltrenaite E (2010). Modelling extreme precipitation in hazardous mountainous areas. Contribu- tion to landscape planning and environmental manage- ment.Journal of Environmental Engineering and Lands- cape Management, 18, 329-342. |
| 13 | Ren Y, Yan J, Wei XH, Wang YJ, Yang YS, Hua LZ, Xiong YZ, Niu X, Song XD (2012). Effects of rapid urban sprawl on urban forest carbon stocks: Integrating remotely sensed, GIS and forest inventory data.Journal of Environmental Management, 113, 447-455. |
| 14 | Shen LY (2008). Studies and Assessments on Vegetation Characteristics in Urban Forests of Shanghai. PhD dissertation, Nanjing Forestry University, Nanjing. (in Chinese with English abstract)[沈烈英 (2008). 上海城市森林的植被特征与综合评价研究. 博士学位论文, 南京林业大学, 南京.] |
| 15 | Shi LJ (2009). The Research on LUCC and Soil Organic Carbon Pool of Shanghai Based on RS and GIS. PhD dissertation, East China Normal University, Shanghai. (in Chinese with English abstract)[史利江 (2009). 基于遥感和GIS的上海土地利用变化与土壤碳库研究. 博士学位论文, 华东师范大学, 上海.] |
| 16 | Wang C, Qi J (2008). Biophysical estimation in tropical forests using JERS-1 SAR and VNIR imagery. II. Aboveground woody biomass.International Journal of Remote Sensing, 29, 6827-6849. |
| 17 | Wang Z (2012). Studies on Carbon Stock in Shanghai Urban Forest. PhD dissertation, Shanghai Jiao Tong University, Shanghai. (in Chinese with English abstract)[王哲 (2012). 上海城市森林碳储量研究. 博士学位论文, 上海交通大学, 上海.] |
| 18 | Wang Z, Cui X, Yin S, Shen GR, Han YJ, Liu CJ (2013). Characteristics of carbon storage in Shanghai’s urban forest.Chinese Science Bulletin, 58, 1130-1138. |
| 19 | Woodwell GM, Whittaker RH, Reiners WA, Likens GE, Delwiche CC, Botkin DB (1978). The biota and the world carbon budget.Science, 199, 141-146. |
| 20 | Xu F, Liu WH, Ren WL, Zhong QC, Zhang GL, Wang KY (2010). Effects of community structure on carbon fixation of urban forests in Shanghai, China.Chinese Journal of Ecology, 29, 439-447. (in Chinese with English abstract)[徐飞, 刘为华, 任文玲, 仲启铖, 张桂莲, 王开运 (2010). 上海城市森林群落结构对固碳能力的影响. 生态学杂志, 29, 439-447.] |
| 21 | Xu XL, Cao MK (2006). An analysis of the applications of remote sensing method to the forest biomass estimation.Geo-Information Science, 8, 122-128. (in Chinese with English abstract)[徐新良, 曹明奎 (2006). 森林生物量遥感估算与应用分析. 地球信息科学, 8, 122-128.] |
| 22 | Zhang HF (2008). Remotely Sensed Inversion of Forest Bio- mass and Its Temporal and Spatial Distribution Patterns Dynamics in Beijing. Master degree dissertation, Beijing Forestry University, Beijing. (in Chinese with English abstract)[张慧芳 (2008). 北京地区森林植被生物量遥感反演及时空动态格局分析. 硕士学位论文, 北京林业大学, 北京.] |
| 23 | Zhang KX (2010). Study on Community Ecology of Shanghai Green Belt and Ecological Benefits and Aesthetics Assessment of Its Plant Communities. PhD dissertation, East China Normal University, Shanghai. (in Chinese with English abstract)[张凯旋 (2010). 上海环城林带群落生态学与生态效益及景观美学评价研究. 博士学位论文, 华东师范大学, 上海.] |
| 24 | Zhang QF, Xia L, Qiao P, Yang WY (2001). Development dynamic, distribution pattern and scale characters of the parks system in Shanghai.Journal of Chinese Landscape Architecture, (1), 58-61. (in Chinese with English abstract)[张庆费, 夏檑, 乔平, 杨文悦 (2001). 上海公园的发展动态、分布格局与规模特征分析. 中国园林, (1), 58-61.] |
| 25 | Zhu CY, Wang RH, Chen DQ (2013). Urban forest ecosystem NPP and carbon storage based on the casa model in Nanjing.China Forestry Science and Technology, 27(3), 53-56. (in Chinese with English abstract)[朱婵璎, 王让会, 陈东强 (2013). 南京城市森林生态系统生产力与碳储量的计算. 林业科技开发, 27(3), 53-56.] |
| 26 | Zhu XL, Liu DS (2015). Improving forest aboveground biomass estimation using seasonal Landsat NDVI time-series.ISPRS Journal of Photogrammetry and Remote Sensing, 102, 222-231. |
| [1] | 张静, 陈洁, 李艳朋, 盘李军, 许涵, 李意德, 何海生. 南亚热带针阔混交人工林植物生物量比较及其影响因子分析[J]. 植物生态学报, 2026, 50(2): 400-416. |
| [2] | 田地, 迟小龙, 石亮, 刘宵含, 赵常提, 吴梅, 张玉忠, 高永亮. 塞罕坝地区优势造林树种叶片化学计量特征及其环境驱动[J]. 植物生态学报, 2026, 50(2): 362-373. |
| [3] | 徐恩相, 周蕾, 章晓炜, 张国萍, 仲杜伟, 黄智, 刘派, 迟永刚. 基于不同生育阶段冠层光谱和碳通量的水稻产量估算[J]. 植物生态学报, 2026, 50(1): 82-93. |
| [4] | 赵珮杉, 高广磊, 丁国栋, 张英. 林龄和生态位对樟子松人工林地下真菌群落构建的影响[J]. 植物生态学报, 2025, 49(9): 1472-1484. |
| [5] | 张法伟, 李红琴, 祝景彬, 樊博, 周华坤, 李英年, 梁乃申. 氮添加和降水改变对高寒草甸生态系统地上与地下碳储的影响[J]. 植物生态学报, 2025, 49(9): 1399-1409. |
| [6] | 邢强, 赵斌, 胡永红, 杨君, 秦俊, 刘何铭, 王红兵, 周鹏. 华东地区两种典型立体绿化植物根系性状特征及对新型土壤基质的响应[J]. 植物生态学报, 2025, 49(9): 1498-1514. |
| [7] | 宋珊珊, 唐志尧. 河北塞罕坝草甸草原根际土壤真菌与植物地上生物量的关系[J]. 植物生态学报, 2025, 49(9): 1461-1471. |
| [8] | 朱瑞德, 杨俊薇, 刘宵含, 陈冰瑞, 池秀莲, 田地, 杨光, 程蒙, 戴亚峰, 王诗文. 霍山石斛设施和林下栽培模式中养分对植物-微生物关联的调控[J]. 植物生态学报, 2025, 49(9): 1434-1447. |
| [9] | 滕安萍, 刘明慧, 高广磊, 丁国栋, 张英, 李启研. 科尔沁沙地不同林龄樟子松人工林土壤真菌-细菌共现模式[J]. 植物生态学报, 2025, 49(9): 1556-1568. |
| [10] | 樊月玲, 蒋正德, 叶佳舒, 郑立臣, 陈欣. 2005-2015年下辽河平原农田长期观测样地主要农作物收获期性状和产量数据集[J]. 植物生态学报, 2025, 49(8): 1271-1282. |
| [11] | 马腾飞, 郝杰, 刁华杰, 宁亚楠, $\boxed{\hbox{王常慧}}$, 董宽虎. 晋北农牧交错带草地土壤无机氮含量的季节变化及其对放牧强度的响应[J]. 植物生态学报, 2025, 49(6): 965-974. |
| [12] | 刘新月, 王立平, 刘春和, 孙艳丽, 刘鹏, 田赟, 贾昕, 查天山, 钱多. 北京不同林龄人工林生物量空间格局及其影响因素[J]. 植物生态学报, 2025, 49(6): 939-951. |
| [13] | 陈文义, 王智勇, 周梦岩, 麻文俊, 王军辉, 罗志斌, 周婧. 幼龄楸树生物量分配规律与异速生长模型[J]. 植物生态学报, 2025, 49(2): 356-366. |
| [14] | 郝毅晴, 刘伟, 杨阳, 安冰儿, 范冰, 李超, 崔久辉, 程延彬, 孙佳美, 潘庆民. 有机肥和无机肥对退化草原羊草种群密度和个体生物量的影响[J]. 植物生态学报, 2025, 49(1): 148-158. |
| [15] | 童郁强, 吴梦鸽, 王玲, 赵实, 韩叙, 张彤, 刘静, 秦胜金, 董英豪, 魏亚伟, 周永斌. 基于液流径向变化的樟子松蒸腾耗水量估算及影响因素[J]. 植物生态学报, 2024, 48(9): 1118-1127. |
| 阅读次数 | ||||||
|
全文 |
|
|||||
|
摘要 |
|
|||||
Copyright © 2026 版权所有 《植物生态学报》编辑部
地址: 北京香山南辛村20号, 邮编: 100093
Tel.: 010-62836134, 62836138; Fax: 010-82599431; E-mail: apes@ibcas.ac.cn, cjpe@ibcas.ac.cn
备案号: 京ICP备16067583号-19
![]()