
植物生态学报 ›› 2017, Vol. 41 ›› Issue (4): 387-395.DOI: 10.17521/cjpe.2016.0184 cstr: 32100.14.cjpe.2016.0184
• • 下一篇
张雷1, 王琳琳2, 刘世荣3,*( ), 孙鹏森3, 余振4, 黄书涛5, 张旭东1
收稿日期:2016-05-31
接受日期:2017-01-03
出版日期:2017-04-10
发布日期:2017-05-19
基金资助:
Lei ZHANG1, Lin-lin WANG2, Shi-Rong LIU3,*(), Peng-Sen SUN3, Zhen YU4, Shu-Tao HUANG5, Xu- Dong ZHANG1
Received:2016-05-31
Accepted:2017-01-03
Online:2017-04-10
Published:2017-05-19
摘要:
物种生境模型预测结果通常是概率性的, 然而在具体的保护管理等实践应用过程中通常需要基于二元值(存在/不存在)的分布图, 此时就需要把概率性的预测结果转化为二元值,在此转化过程中就涉及阈值选择问题。此外, 在评估模型预测准确度的时候, 多数评估指标也需要选择一个阈值用于转化概率预测结果, 这个阈值选择对于模型预测准确度也会有极大的影响。然而阈值选择却是物种生境模拟不确定性研究中较少涉及的领域。“随机森林”既可以生成物种生境概率分布图(回归算法)也可以生成二元分布图(分类算法), 然而还未见对两种预测方式的比较研究。该文以珙桐(Davidia involucrata)和杉木(Cunninghamia lanceolata)为例, 分别采用“随机森林”的分类算法和回归算法预测其生境二元分布图和概率分布图, 通过4个不同阈值选择方法(默认值0.5、MaxKappa、MaxTSS和MaxACC)把概率预测图转换为二元分布图, 进而比较分析转换结果对模型预估的影响。珙桐不同阈值选择方法所确立的阈值之间存在显著差异,而杉木没有显著差异; 两物种模型准确度之间没有显著差异; 在预测两物种未来气候条件下的生境面积变化、生境分布区迁移方向和距离以及最适宜海拔分布高度变化时, 二元值转换后的回归算法与分类算法之间存在显著差异,但回归算法中各阈值选择方法之间没有显著差异。空间生境分布图的相似性分析表明MaxKappa和MaxTSS法具有最大相似性, 分类算法与4种阈值选择方法之间具有最大差异。
张雷, 王琳琳, 刘世荣, 孙鹏森, 余振, 黄书涛, 张旭东. 生境概率预测值转换为二元值过程中4个阈值选择方法的比较评估——以珙桐和杉木生境预估为例. 植物生态学报, 2017, 41(4): 387-395. DOI: 10.17521/cjpe.2016.0184
Lei ZHANG, Lin-lin WANG, Shi-Rong LIU, Peng-Sen SUN, Zhen YU, Shu-Tao HUANG, Xu- Dong ZHANG. An evaluation of four threshold selection methods in species occurrence modelling with random forest: Case studies with Davidia involucrata and Cunninghamia lanceolata. Chinese Journal of Plant Ecology, 2017, 41(4): 387-395. DOI: 10.17521/cjpe.2016.0184
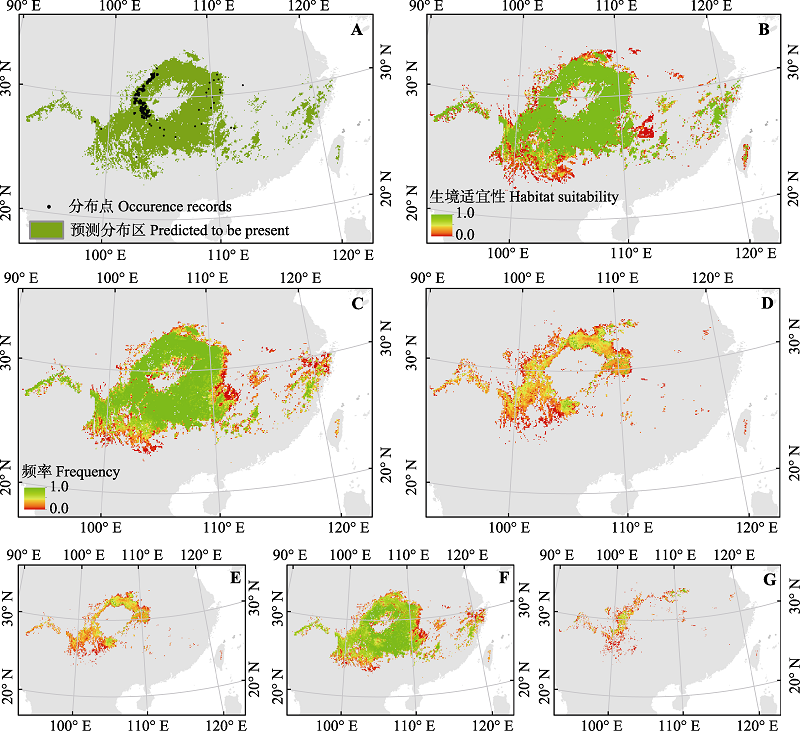
图1 基于同一建模数据的当前气候条件下珙桐生境二元值(A)和概率值(B)预测结果。不同阈值选择法和“随机森林”分类算法所生成的45个生境图中当前(C)和未来(D)气候条件下珙桐出现频率以及未来气候条件下生境不变(E)、生境消失(F)和新生境出现(G)的频率。
Fig. 1 Binary (A) and probability (B) distribution maps of Davidia involucrata under current climate produced by the same model-building dataset. Frequency of the presence of Davidia involucrata calculated across 45 predictions under current (C) and future (D) climates and the frequency of stable (E), lost (F) and gained (G) habitats under future climate.
| 精度指标 Accuracy measure | 公式 Formula |
|---|---|
| 总准确度 Overall accuracy | (a +d)/n |
| 敏感度 Sensitivity | a/(a + c) |
| 特异度 Specificity | d/(b + d) |
| Kappa | $\frac{\left( a\text{+}d \right)-\text{ }\!\![\!\!\text{ }\left( a\text{+}c \right)\left( a\text{+}b \right)\text{+}\left( b\text{+}d \right)\left( c\text{+}d \right)\text{ }\!\!]\!\!\text{ /}n}{n-\text{ }\!\![\!\!\text{ }\left( a\text{+}c \right)\left( a\text{+}b \right)\text{+(}b\text{+}d\text{)(}c\text{+}d\text{) }\!\!]\!\!\text{ /}n}$ |
| 真实技巧统计法 True skill statistic (TSS) | Sensitivity + Specificit -1 |
表1 模型预测准确度评价指标
Table 1 Measures of predictive accuracy
| 精度指标 Accuracy measure | 公式 Formula |
|---|---|
| 总准确度 Overall accuracy | (a +d)/n |
| 敏感度 Sensitivity | a/(a + c) |
| 特异度 Specificity | d/(b + d) |
| Kappa | $\frac{\left( a\text{+}d \right)-\text{ }\!\![\!\!\text{ }\left( a\text{+}c \right)\left( a\text{+}b \right)\text{+}\left( b\text{+}d \right)\left( c\text{+}d \right)\text{ }\!\!]\!\!\text{ /}n}{n-\text{ }\!\![\!\!\text{ }\left( a\text{+}c \right)\left( a\text{+}b \right)\text{+(}b\text{+}d\text{)(}c\text{+}d\text{) }\!\!]\!\!\text{ /}n}$ |
| 真实技巧统计法 True skill statistic (TSS) | Sensitivity + Specificit -1 |
| 阈值选择方法 Threshold method | 阈值 Threshold | Kappa | 真实技巧统计法 TSS | 总准确度 Overall accuracy | 敏感度 Sensitivity | 特异度 Specificity | |
|---|---|---|---|---|---|---|---|
| 珙桐 Davidia involucrata | 默认值0.5 Default 0.5 | 0.500 (0.000)a | 0.871 (0.024)a | 0.871 (0.024)a | 0.935 (0.012)a | 0.976 (0.019)a | 0.894 (0.025)a |
| 最大总准确度 Maximizing overall accuracy (MaxAcc) | 0.476 (0.187)ab | 0.872 (0.025)a | 0.872 (0.025)a | 0.936 (0.012)a | 0.975 (0.021)a | 0.897 (0.027)a | |
| 最大Kappa Maximizing Kappa (MaxKappa) | 0.364 (0.185)b | 0.872 (0.025)a | 0.872 (0.025)a | 0.936 (0.012)a | 0.976 (0.020)a | 0.895 (0.027)a | |
| 最大真实技巧统计法 Maximizing true skill statistic (MaxTSS) | 0.364 (0.185)b | 0.872 (0.025)a | 0.872 (0.025)a | 0.936 (0.012)a | 0.976 (0.020)a | 0.895 (0.027)a | |
| 随机森林分类 Random forest classification tree (RFCT) | - | 0.869 (0.030)a | 0.869 (0.030)a | 0.935 (0.015)a | 0.982 (0.022)a | 0.888 (0.031)a | |
| 杉木 Cunninghamia lanceolata | 默认值0.5 Default 0.5 | 0.500 (0.000)a | 0.903 (0.010)a | 0.903 (0.010)a | 0.951 (0.005)a | 0.962 (0.010)a | 0.941 (0.009)a |
| 最大总准确度 Maximizing overall accuracy (MaxAcc) | 0.540 (0.078)a | 0.908 (0.011)a | 0.908 (0.011)a | 0.954 (0.006)a | 0.958 (0.013)a | 0.950 (0.009)a | |
| 最大Kappa Maximizing Kappa (MaxKappa) | 0.540 (0.078)a | 0.908 (0.011)a | 0.908 (0.011)a | 0.954 (0.006)a | 0.958 (0.013)a | 0.950 (0.009)a | |
| 最大TSS Maximizing true skill statistic (MaxTSS) | 0.541 (0.076)a | 0.908 (0.011)a | 0.908 (0.011)a | 0.954 (0.006)a | 0.958 (0.013)a | 0.950 (0.009)a | |
| 随机森林分类 Random forest classification tree (RFCT) | - | 0.905 (0.010)a | 0.905 (0.010)a | 0.952 (0.005)a | 0.961 (0.010)a | 0.943 (0.007)a |
表2 不同阈值选择方法所确立的阈值及其应用于模型评估数据后的模型预测精度
Table 2 Thresholds selected by four threshold criteria and model accuracies determined by five measures
| 阈值选择方法 Threshold method | 阈值 Threshold | Kappa | 真实技巧统计法 TSS | 总准确度 Overall accuracy | 敏感度 Sensitivity | 特异度 Specificity | |
|---|---|---|---|---|---|---|---|
| 珙桐 Davidia involucrata | 默认值0.5 Default 0.5 | 0.500 (0.000)a | 0.871 (0.024)a | 0.871 (0.024)a | 0.935 (0.012)a | 0.976 (0.019)a | 0.894 (0.025)a |
| 最大总准确度 Maximizing overall accuracy (MaxAcc) | 0.476 (0.187)ab | 0.872 (0.025)a | 0.872 (0.025)a | 0.936 (0.012)a | 0.975 (0.021)a | 0.897 (0.027)a | |
| 最大Kappa Maximizing Kappa (MaxKappa) | 0.364 (0.185)b | 0.872 (0.025)a | 0.872 (0.025)a | 0.936 (0.012)a | 0.976 (0.020)a | 0.895 (0.027)a | |
| 最大真实技巧统计法 Maximizing true skill statistic (MaxTSS) | 0.364 (0.185)b | 0.872 (0.025)a | 0.872 (0.025)a | 0.936 (0.012)a | 0.976 (0.020)a | 0.895 (0.027)a | |
| 随机森林分类 Random forest classification tree (RFCT) | - | 0.869 (0.030)a | 0.869 (0.030)a | 0.935 (0.015)a | 0.982 (0.022)a | 0.888 (0.031)a | |
| 杉木 Cunninghamia lanceolata | 默认值0.5 Default 0.5 | 0.500 (0.000)a | 0.903 (0.010)a | 0.903 (0.010)a | 0.951 (0.005)a | 0.962 (0.010)a | 0.941 (0.009)a |
| 最大总准确度 Maximizing overall accuracy (MaxAcc) | 0.540 (0.078)a | 0.908 (0.011)a | 0.908 (0.011)a | 0.954 (0.006)a | 0.958 (0.013)a | 0.950 (0.009)a | |
| 最大Kappa Maximizing Kappa (MaxKappa) | 0.540 (0.078)a | 0.908 (0.011)a | 0.908 (0.011)a | 0.954 (0.006)a | 0.958 (0.013)a | 0.950 (0.009)a | |
| 最大TSS Maximizing true skill statistic (MaxTSS) | 0.541 (0.076)a | 0.908 (0.011)a | 0.908 (0.011)a | 0.954 (0.006)a | 0.958 (0.013)a | 0.950 (0.009)a | |
| 随机森林分类 Random forest classification tree (RFCT) | - | 0.905 (0.010)a | 0.905 (0.010)a | 0.952 (0.005)a | 0.961 (0.010)a | 0.943 (0.007)a |
| 阈值方法 Threshold | 当前适生区 Total habitat area (×103 km2) | 总生境变 化比例 Total range change (%) | 新生境 比例 Habitat gained (%) | 生境消失 比例 Habitat lost (%) | 东向迁移 距离 Eastward shift (km) | 北向迁移 距离 Northward shift (km) | 高程迁移 距离 Uphill shift (m) | |
|---|---|---|---|---|---|---|---|---|
| 珙桐 Davidia involucrata | Default 0.5 | 762.8 (34.6)a | -95.9 (3.8)a | 0.6 (0.9)a | 96.6 (3.0)a | 70.7 (133.2)a | 252.3 (43.5)a | -341 (211)a |
| MaxAcc | 761.1 (69.1)a | -94.8 (6.4)a | 1.0 (1.3)a | 95.8 (5.1)a | 69.3 (164.5)a | 228.4 (80.5)a | -336 (244)a | |
| MaxKappa | 780.1 (69.5)ab | -94.3 (6.6)ab | 1.1 (1.4)ab | 95.4 (5.3)ab | 50.9 (164.4)a | 241.7 (41.7)a | -341 (255)a | |
| MaxTSS | 780.1 (69.5)ab | -94.3 (6.6)ab | 1.1 (1.4)ab | 95.4 (5.3)ab | 50.9 (164.4)a | 241.7 (41.7)a | -341 (255)a | |
| RFCT | 804.3 (27.9)b | -60.1 (1.9)b | 7.9 (1.1)b | 68.0 (1.8)b | -236.0 (33.9)b | 134.5 (9.0)b | 242 (63)b | |
| 杉木 Cunninghamia lanceolata | Default 0.5 | 1β401.5 (14.4)a | -0.3 (0.1)ab | 0.1 (0.0)ab | 0.4 (0.1)ab | -129.1 (22.1)a | 68.5 (14.9)ab | 243.3 (37.5)a |
| MaxAcc | 1β367.4 (67.9)a | -0.4 (0.2)b | 0.1 (0.1)ab | 0.5 (0.1)b | -107.6 (48.2)ab | 57.6 (32.6)b | 238.7 (33.4)ab | |
| MaxKappa | 1β367.4 (67.9)a | -0.4 (0.2)b | 0.1 (0.1)ab | 0.5 (0.1)b | -107.6 (48.2)ab | 57.6 (32.6)b | 238.7 (33.4)ab | |
| MaxTSS | 1β365.7 (65.8)a | -0.4 (0.2)b | 0.1 (0.1)b | 0.5 (0.1)b | -108.0 (48.4)ab | 57.3 (32.5)b | 238.9 (33.5)ab | |
| RFCT | 1β391.2 (11.0)a | -0.3 (0.1)a | 0.1 (0.0)a | 0.4 (0.1)a | -82.0 (26.8)b | 81.5 (12.2)a | 183.0 (38.8)b |
表3 当前潜在适生区面积及未来(2070-2099, 2080s)气候条件下的生境相对变化
Table 3 Potential habitat suitable areas and changes in the distribution range of tree species (change in area and shift in distance and direction of mean centers of suitable habitat) for the normal period 2070-2099 (2080s) relative to current baseline (1961-1990).
| 阈值方法 Threshold | 当前适生区 Total habitat area (×103 km2) | 总生境变 化比例 Total range change (%) | 新生境 比例 Habitat gained (%) | 生境消失 比例 Habitat lost (%) | 东向迁移 距离 Eastward shift (km) | 北向迁移 距离 Northward shift (km) | 高程迁移 距离 Uphill shift (m) | |
|---|---|---|---|---|---|---|---|---|
| 珙桐 Davidia involucrata | Default 0.5 | 762.8 (34.6)a | -95.9 (3.8)a | 0.6 (0.9)a | 96.6 (3.0)a | 70.7 (133.2)a | 252.3 (43.5)a | -341 (211)a |
| MaxAcc | 761.1 (69.1)a | -94.8 (6.4)a | 1.0 (1.3)a | 95.8 (5.1)a | 69.3 (164.5)a | 228.4 (80.5)a | -336 (244)a | |
| MaxKappa | 780.1 (69.5)ab | -94.3 (6.6)ab | 1.1 (1.4)ab | 95.4 (5.3)ab | 50.9 (164.4)a | 241.7 (41.7)a | -341 (255)a | |
| MaxTSS | 780.1 (69.5)ab | -94.3 (6.6)ab | 1.1 (1.4)ab | 95.4 (5.3)ab | 50.9 (164.4)a | 241.7 (41.7)a | -341 (255)a | |
| RFCT | 804.3 (27.9)b | -60.1 (1.9)b | 7.9 (1.1)b | 68.0 (1.8)b | -236.0 (33.9)b | 134.5 (9.0)b | 242 (63)b | |
| 杉木 Cunninghamia lanceolata | Default 0.5 | 1β401.5 (14.4)a | -0.3 (0.1)ab | 0.1 (0.0)ab | 0.4 (0.1)ab | -129.1 (22.1)a | 68.5 (14.9)ab | 243.3 (37.5)a |
| MaxAcc | 1β367.4 (67.9)a | -0.4 (0.2)b | 0.1 (0.1)ab | 0.5 (0.1)b | -107.6 (48.2)ab | 57.6 (32.6)b | 238.7 (33.4)ab | |
| MaxKappa | 1β367.4 (67.9)a | -0.4 (0.2)b | 0.1 (0.1)ab | 0.5 (0.1)b | -107.6 (48.2)ab | 57.6 (32.6)b | 238.7 (33.4)ab | |
| MaxTSS | 1β365.7 (65.8)a | -0.4 (0.2)b | 0.1 (0.1)b | 0.5 (0.1)b | -108.0 (48.4)ab | 57.3 (32.5)b | 238.9 (33.5)ab | |
| RFCT | 1β391.2 (11.0)a | -0.3 (0.1)a | 0.1 (0.0)a | 0.4 (0.1)a | -82.0 (26.8)b | 81.5 (12.2)a | 183.0 (38.8)b |
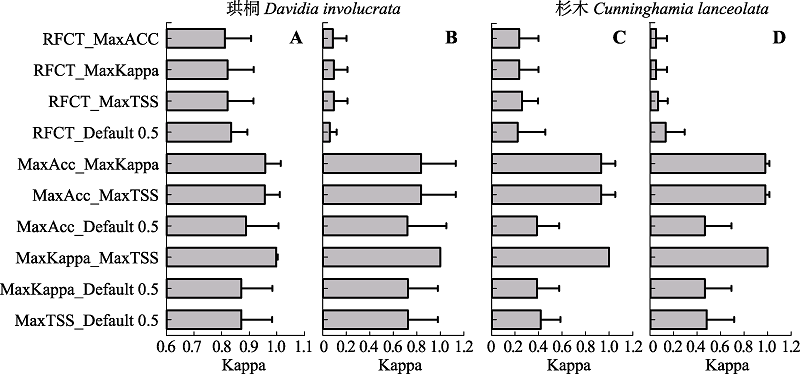
图2 当前(A、C)和未来(B、D)气候条件下不同阈值选择方法生境分布图的两两相似性。误差线代表标准偏差; 阈值方法缩写同表2。
Fig. 2 Pairwise Kappa correlation of habitat maps of four threshold selection method under current (A, C) and future (B, D) climates. Error bars represent standard errors. The abbreviations of threshold methods are the same as in Table 2.
| [1] | Bailey SA, Haines-Young RH, Watkins C (2002). Species presence in fragmented landscapes: Modelling of species requirements at the national level.Biological Conservation, 108, 307-316. |
| [2] | Barbet-Massin M, Jiguet F, Alber CH, Thuiller W (2012). Selecting pseudo-absences for species distribution models: How, where and how many?Methods in Ecology and Evolution, 3, 327-338. |
| [3] | Breiman L, Cutler A (. Cited: 2016-02-18. |
| [4] | Carpenter G, Gillison A, Winter J (1993). DOMAIN: A flexible modelling procedure for mapping potential distributions of plants and animals.Biodiversity and Conservation, 2, 667-680. |
| [5] | Editorial Committee of Vegetation Map of China, Chinese Academy of Sciences (2001). 1:1,000,000 Vegetation Distribution Map of China. Science Press, Beijing. (in Chinese)[中国科学院植被图编辑委员会 (2001). 1:1,000,000中国植被图. 科学出版社, 北京.] |
| [6] | Engler R, Guisan A, Rechsteiner L (2004). An improved approach for predicting the distribution of rare and endangered species from occurrence and pseudo-absence data.Journal of Applied Ecology, 41, 263-274. |
| [7] | Fielding AH, Haworth PF (1995). Testing the generality of bird-habitat models.Conservation Biology, 9, 1466-1481. |
| [8] | Fielding AH, Bell JF (1997). A review of methods for the assessment of prediction errors in conservation presence/ absence models.Environmental Conservation, 24, 38-49. |
| [9] | Freeman EA, Moisen GG (2008). A comparison of the performance of threshold criteria for binary classification in terms of predicted prevalence and Kappa.Ecological Modelling, 217, 48-58. |
| [10] | Guisan A, Zimmermann NE (2000). Predictive habitat distribution models in ecology.Ecological Modeling, 135, 147-186. |
| [11] | Guo Q, Liu Y (2010). ModEco: An integrated software package for ecological niche modeling.Ecography, 33, 637-642. |
| [12] | Hirzel AH, Hausser J, Perrin N (. Cited: 2016-02-18. |
| [13] | Jimenez-Valverde A, Lobo J (2007). Threshold criteria for conversion of probability of species presence to either-or presence-absence.Acta Oecologica, 31, 361-369. |
| [14] | Jin JX, Jiang H, Peng W, Zhang LJ, Lu XH, Xu JH, Zhang XY, Wang Y (2013). Evaluating the impact of soil factors on the potential distribution ofPhyllostachys edulis (bamboo) in China based on the species distribution model. Chinese Journal of Plant Ecology, 37, 631-640. (in Chinese with English abstract)[金佳鑫, 江洪, 彭威, 张林静, 卢学鹤, 徐建辉, 张秀英, 王颖 (2013). 基于物种分布模型评价土壤因子对我国毛竹潜在分布的影响. 植物生态学报, 37, 631-640.] |
| [15] | Liaw A, Wiener M (2002). Classification and regression by randomForest.R News, 2(3), 18-22. |
| [16] | Liu C, White M, Newell G (2013). Selecting thresholds for the prediction of species occurrence with presence-only data.Journal of Biogeography, 40, 778-789. |
| [17] | Liu C, Berry PM, Dawson TP, Pearson RG (2005). Selecting thresholds of occurrence in the prediction of species distributions.Ecography, 28, 385-393. |
| [18] | Nenzén H, Araújo M (2011). Choice of threshold alters projections of species range shifts under climate change.Ecological Modelling, 222, 3346-3354. |
| [19] | Norris D (2014). Model thresholds are more important than presence location type: Understanding the distribution of lowland tapir (Tapirus terrestris) in a continuous Atlantic forest of southeast Brazil. Tropical Conservation Science, 7, 529-547. |
| [20] | O’Hanley JR (2009). NeuralEnsembles: A neural network based ensemble forecasting program for habitat and bioclimatic suitability analysis.Ecography, 32, 89-93. |
| [21] | R Core Team (. Cited: 2016-02-18. |
| [22] | Robertson M, Caithness N, Villet M (2001). A PCA-based modelling technique for predicting environmental suitability for organisms from presence records.Diversity and Distributions, 7, 15-27. |
| [23] | Shao H, Tian JQ, Guo K, Sun OJ (2009). Effects of sample size and species traits on performance of bioclim in predicting geographical distribution of tree species—A case study with 12 deciduous Quercus species indigenous to china. Chinese Journal of Plant Ecology, 33, 870-877. (in Chinese with English abstract)[邵慧, 田佳倩, 郭柯, 孙建新 (2009). 样本容量和物种特征对BIOCLIM模型模拟物种分布准确度的影响——以12个中国特有落叶栎树种为例. 植物生态学报, 33, 870-877.] |
| [24] | terBraak CJF, Looman CWN (1986). Weighted averaging, logistic regression and the Gaussian response model.Plant Ecology, 65, 3-11. |
| [25] | Thuiller W (2004). Patterns and uncertainties of species’ range shifts under climate change.Global Change Biology, 10, 2020-2027. |
| [26] | Wang J, Ni J (2006). Review of modelling the distribution of plant species.Chinese Journal of Plant Ecology, 30, 1040-1053. (in Chinese with English abstract)[王娟, 倪健 (2006). 植物种分布的模拟研究进展. 植物生态学报, 30, 1040-1053.] |
| [27] | Zhang L, Liu S, Sun P, Wang T, Wang G, Zhang X, Wang L (2015). Consensus forecasting of species distributions: The effects of niche model performance and niche properties.PLOS ONE, 10, e0120056. doi:10.1371/journal.pone.0120056. |
| [28] | Zhang L, Liu SR, Sun PS, Wang TL (2011a). Comparative evaluation of multiple models of the effects of climate change on the potential distribution of Pinus massoniana. Chinese Journal of Plant Ecology, 35, 1091-1105. (in Chinese with English abstract)[张雷, 刘世荣, 孙鹏森, 王同立 (2011a). 气候变化对马尾松潜在分布影响预估的多模型比较. 植物生态学报, 35, 1091-1105.] |
| [29] | Zhang L, Liu SR, Sun PS, Wang TL (2011b). Predicting the potential distribution of Phyllostachys edulis with DOMAIN and NeuralEnsembles models. Scientia Silvae Sinicae, 47(7), 20-26. (in Chinese with English abstract)[张雷, 刘世荣, 孙鹏森, 王同立 (2011b). 基于DOMAIN和NeuralEnsembles模型预估中国毛竹潜在分布. 林业科学, 47(7), 20-26.] |
| [30] | Zhang L, Wang LL, Zhang XD, Liu SR, Sun PS, Wang TL (2014). The basic principle of random forest and its applications in ecology: A case study of Pinus yunnanensis.Acta Ecologica Sinica, 34, 650-659. (in Chinese with English abstract)[张雷, 王琳琳, 张旭东, 刘世荣, 孙鹏森, 王同立 (2014). 随机森林算法基本思想及其在生态学中的应用——以云南松分布模拟为例. 生态学报, 34, 650-659.] |
| [1] | 贾会丽, 王睿, 常玉良, 林茂, 栗国梁, 武帅楷, 苏原, 董宽虎, $\boxed{\hbox{王常慧}}$. 不同水平氮添加下晋北赖草叶片化学计量特征及其对光合的影响[J]. 植物生态学报, 2026, 50(2): 429-441. |
| [2] | 李淑英, 朱加保, 马艳, 徐道青, 阚画春, 陈敏, 刘小玲, 郑曙峰, 马小艳. 牛筋草对棉花的密度竞争和防治临界期[J]. 植物生态学报, 2026, 50(1): 134-149. |
| [3] | 郑琳敏, 熊小玲, 姜永孟, 王曼, 张锦秀, 曾志伟, 吕茂奎, 谢锦升. 武夷山不同海拔杉木凋落叶和细根分解规律以及驱动因素的差异[J]. 植物生态学报, 2025, 49(2): 244-255. |
| [4] | 卞嘉琛, 王睿, 高阳阳, 梁雯君, 晋红, 张文轩, 张晓荣, 郝杰, $\boxed{\hbox{王常慧}}$, 董宽虎, 刁华杰. 不同水平氮添加对晋北赖草草地地上和地下净初级生产力的影响[J]. 植物生态学报, 2025, 49(12): 2043-2053. |
| [5] | 李亚超, 张慧, 许珊珊, 李明, 马祥庆, 吴鹏飞. 低磷胁迫下外源挥发性有机化合物对杉木幼苗根系磷利用的影响[J]. 植物生态学报, 2025, 49(10): 1744-1754. |
| [6] | 黄智军, 甘子莹, 祝嘉新, 丘清燕, 胡亚林. 杉木不同器官不同碳氮比对土壤激发效应的影响及其机理[J]. 植物生态学报, 2025, 49(10): 1710-1720. |
| [7] | 许梦真, 卢正宽, 谭星儒, 王彦兵, 苏天成, 窦山德, 潘庆民, 陈世苹. 呼伦贝尔草甸草原退化特征因子识别与快速诊断指标体系构建[J]. 植物生态学报, 2025, 49(1): 42-58. |
| [8] | 韩雨晴, 熊伟, 吴波, 卢琦, 杨文斌, 刘雅莉, 张景波, 辛智鸣, 马迎宾, 廉泓林, 王思涵. 乌兰布和沙漠梭梭茎干液流对降雨脉冲的响应[J]. 植物生态学报, 2024, 48(9): 1172-1179. |
| [9] | 全小强, 王燕茹, 李小玉, 梁海燕, 王立冬, 闫小莉. 氮添加和铵硝态氮配比对杉木幼苗光合特性及叶绿素荧光参数的影响[J]. 植物生态学报, 2024, 48(8): 1050-1064. |
| [10] | 彭思瑞, 张慧玲, 孙兆林, 赵学超, 田鹏, 陈迪马, 王清奎, 刘圣恩. 长期凋落物去除对亚热带杉木林土壤有机碳及其组分的影响[J]. 植物生态学报, 2024, 48(8): 1078-1088. |
| [11] | 兰光飞, 张强, 陈相标, 陈仕东, 熊德成, 刘小飞, 杨智杰, 杨玉盛. 中亚热带格氏栲林凋落物季节动态特征及其影响因素[J]. 植物生态学报, 2024, 48(12): 1589-1601. |
| [12] | 杨子龙, 罗光宇, 雷富民, 余静柔, 蔡圣轩, 于晶. 浙江象山沿海岛屿苔藓植物种-面积关系及物种丰富度影响因素[J]. 植物生态学报, 2024, 48(11): 1486-1500. |
| [13] | 吴帆, 吴晨, 张宇辉, 余恒, 魏智华, 郑蔚, 刘小飞, 陈仕东, 杨智杰, 熊德成. 增温对成熟杉木人工林不同季节细根生长、形态及生理代谢特征的影响[J]. 植物生态学报, 2023, 47(6): 856-866. |
| [14] | 曹珍, 刘永英, 宋世凯, 张莉娜, 高德. 陆地生境岛屿藓类植物小岛屿效应驱动因素分析——以太行山脉中段山顶为例[J]. 植物生态学报, 2023, 47(1): 65-76. |
| [15] | 朱明阳, 林琳, 佘雨龙, 肖城材, 赵通兴, 胡春相, 赵昌佑, 王文礼. 云南轿子山不同海拔急尖长苞冷杉径向生长动态及其低温阈值[J]. 植物生态学报, 2022, 46(9): 1038-1049. |
| 阅读次数 | ||||||
|
全文 |
|
|||||
|
摘要 |
|
|||||
Copyright © 2026 版权所有 《植物生态学报》编辑部
地址: 北京香山南辛村20号, 邮编: 100093
Tel.: 010-62836134, 62836138; Fax: 010-82599431; E-mail: apes@ibcas.ac.cn, cjpe@ibcas.ac.cn
备案号: 京ICP备16067583号-19

