
植物生态学报 ›› 2025, Vol. 49 ›› Issue (9): 1461-1471.DOI: 10.17521/cjpe.2024.0458 cstr: 32100.14.cjpe.2024.0458
宋珊珊, 唐志尧*( )(
)( )
)
收稿日期:2024-12-16
接受日期:2025-04-08
出版日期:2025-09-20
发布日期:2025-04-09
通讯作者:
*唐志尧: ORCID: 0000-0003-0154-6403 (zytang@urban.pku.edu.cn)基金资助:
SONG Shan-Shan, TANG Zhi-Yao*()()
Received:2024-12-16
Accepted:2025-04-08
Online:2025-09-20
Published:2025-04-09
Supported by:摘要:
植物生长受自身特性和土壤微生物群落的共同影响。然而, 自然群落中植物资源获取策略如何通过根际微生物进而影响自身生物量, 目前尚缺乏明确的认识。该研究选取河北省塞罕坝草甸草原中的12种优势和常见植物种类, 对其根际土壤真菌进行高通量测序, 并同步测量了这些植物叶片和根系的功能性状及地上生物量, 旨在阐明不同资源获取策略的根际土壤真菌多样性与地上生物量的关系。研究发现: 1)资源获取策略上, 豆科植物属于“快生长”策略物种, 而莎草科和禾本科植物属于“慢生长”策略物种; 莎草科植物为“自给自足”策略, 而多数非豆科杂类草则倾向于“外包”策略。2) “慢生长”策略与“自给自足”策略的植物增加了根际总体真菌和腐生真菌多样性, 并且该策略植物的地上生物量在群落中占据主导地位。3)根际土壤真菌多样性与植物地上生物量正相关, 其中腐生真菌和病原真菌多样性的贡献尤为关键。4)群落内部地上生物量的差异主要由植物“快-慢”经济谱的直接作用主导。这些发现不仅揭示了植物资源获取策略对根际土壤真菌群落的调控作用, 还强调了植物“快-慢”经济谱和根际土壤真菌多样性在驱动地上生物量积累中的关键作用, 为理解植物-微生物互作对草地生态系统功能的影响提供了理论依据。
宋珊珊, 唐志尧. 河北塞罕坝草甸草原根际土壤真菌与植物地上生物量的关系. 植物生态学报, 2025, 49(9): 1461-1471. DOI: 10.17521/cjpe.2024.0458
SONG Shan-Shan, TANG Zhi-Yao. Relationship between rhizosphere soil fungi and plant aboveground biomass in the meadow steppe of Saihanba, Hebei, China. Chinese Journal of Plant Ecology, 2025, 49(9): 1461-1471. DOI: 10.17521/cjpe.2024.0458
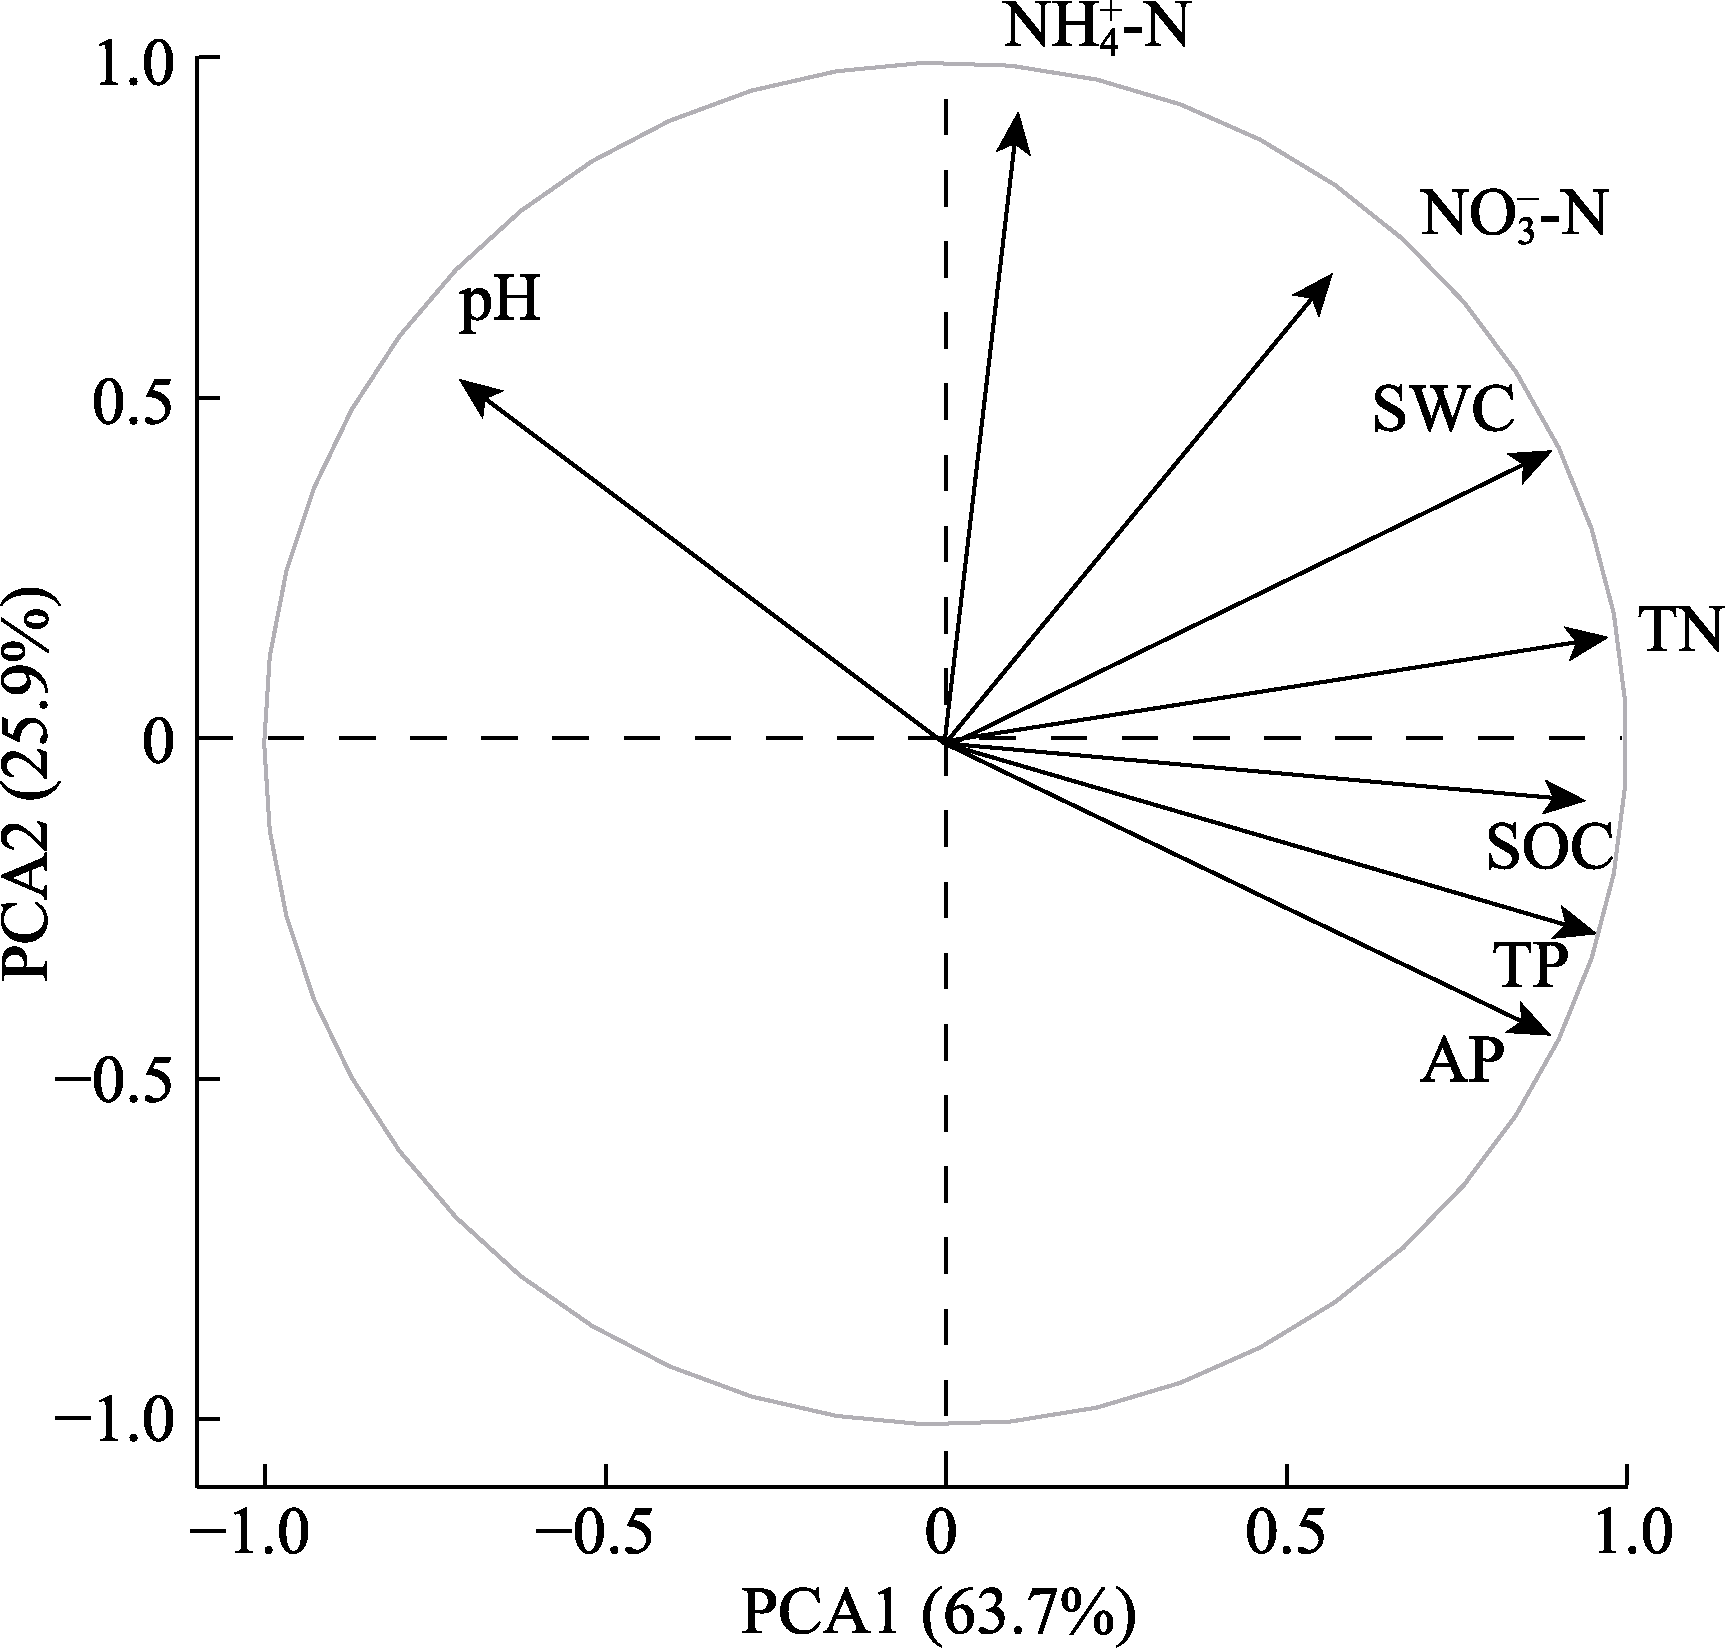
图1 土壤属性的主成分分析(PCA)。AP, 速效磷含量; NH4+-N, 铵态氮含量; NO3--N, 硝态氮含量; SOC, 土壤有机碳含量; SWC, 土壤含水量; TN, 全氮含量; TP, 全磷含量。
Fig. 1 Principal component analysis (PCA) of soil properties. AP, available phosphorus content; NH4+-N, ammonium nitrogen content; NO3--N, nitrate nitrogen content; SOC, soil organic carbon content; SWC, soil water content; TN, total nitrogen content; TP, total phosphorus content.
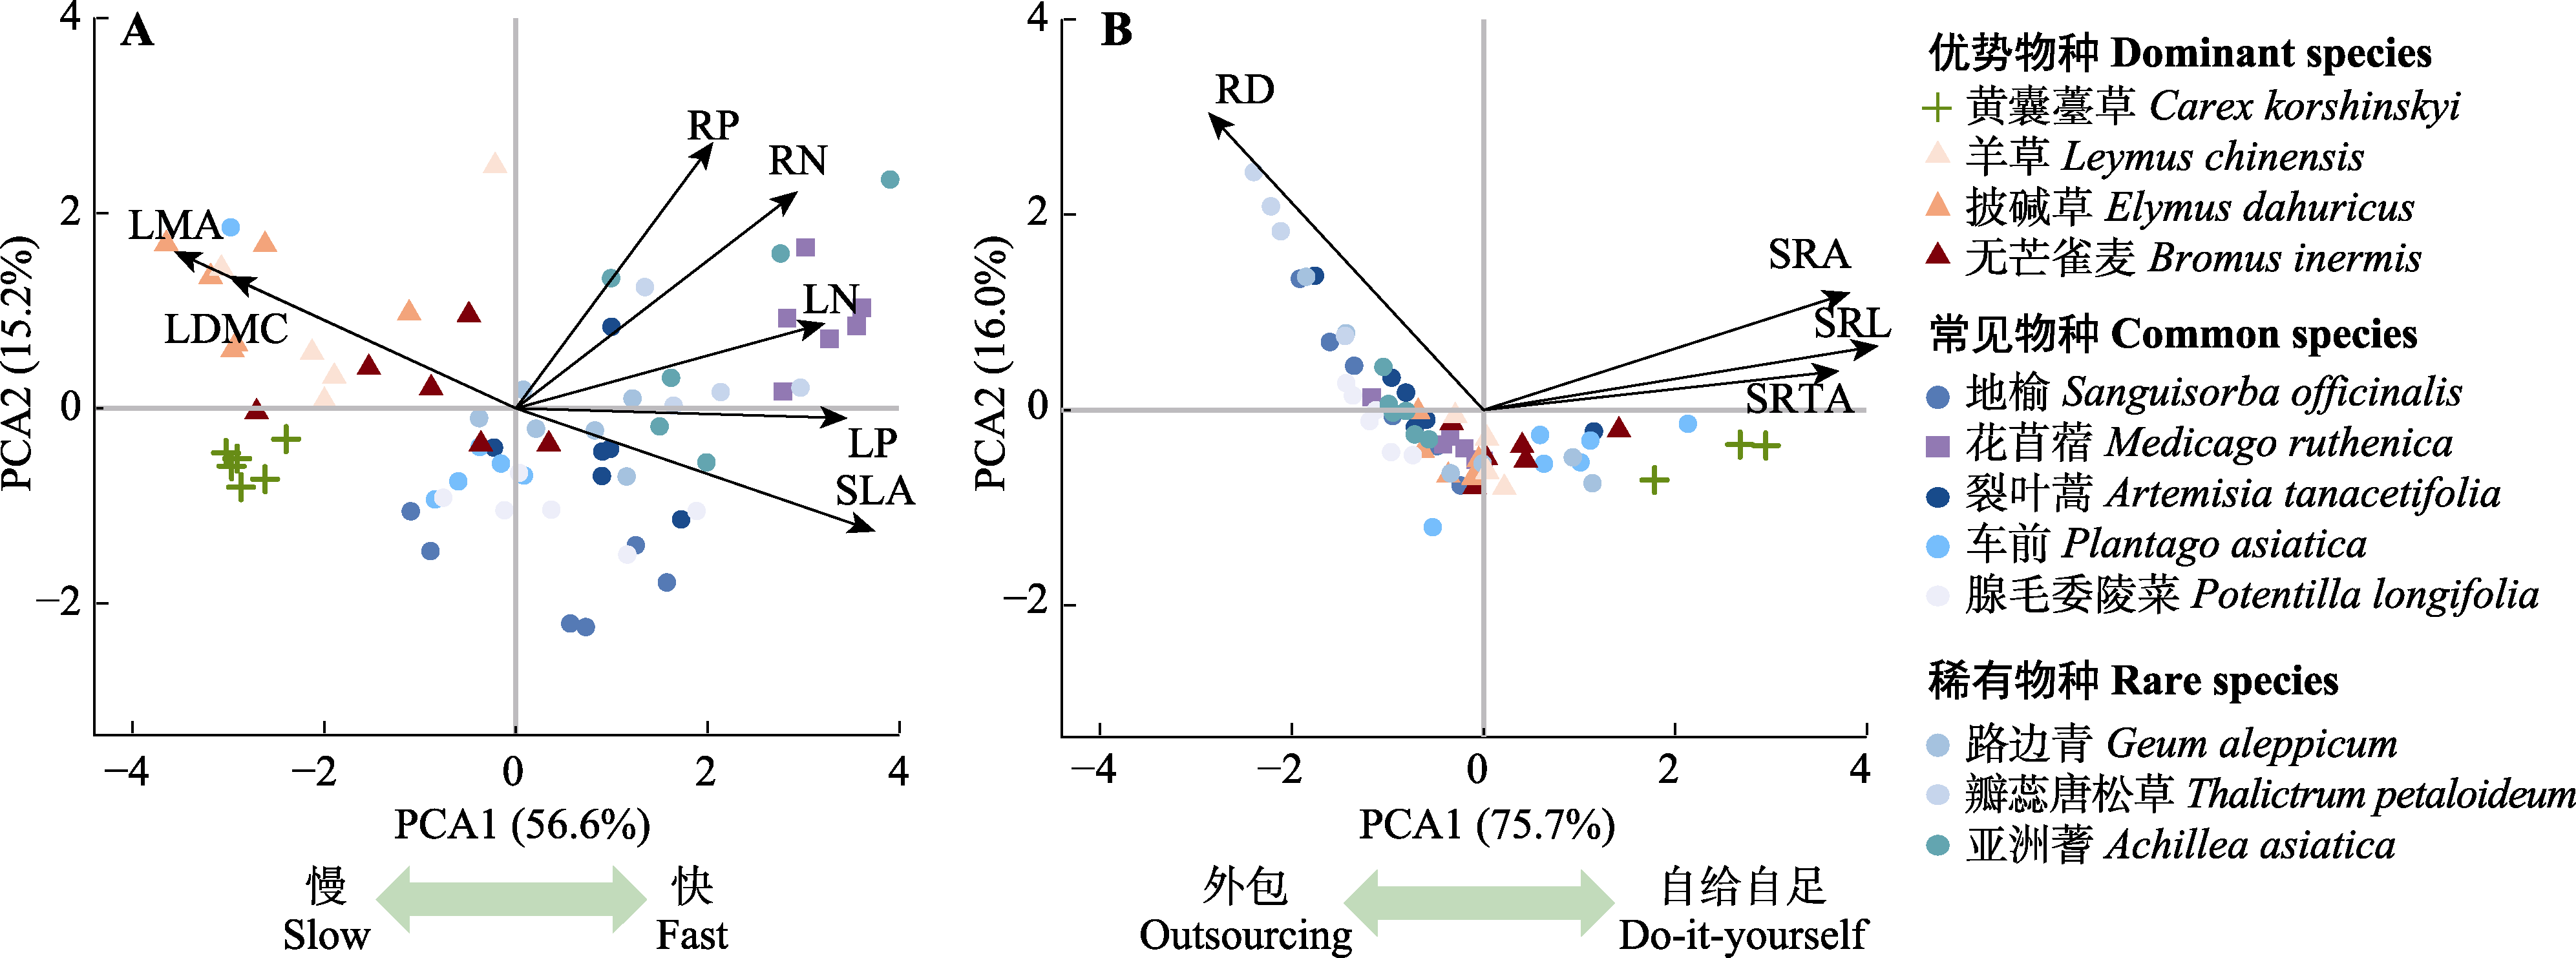
图2 “快-慢”经济谱(A)和协作维度相关性状(B)的主成分分析(PCA)。LDMC, 叶干物质含量; LMA, 比叶质量; LN, 叶氮含量; LP, 叶磷含量; RD, 根直径; RN, 根氮含量; RP, 根磷含量; SLA, 比叶面积; SRA, 比根面积; SRL, 比根长; SRTA, 比根尖丰度。
Fig. 2 Principal component analysis (PCA) of traits related to the “fast-slow” economic spectrum (A) and the collaboration dimension (B). LDMC, leaf dry matter content; LMA, specific leaf mass; LN, leaf nitrogen content; LP, leaf phosphorus content; RD, root diameter; RN, root nitrogen content; RP, root phosphorus content; SLA, specific leaf area; SRA, specific root area; SRL, specific root length; SRTA, specific root tip abundance.
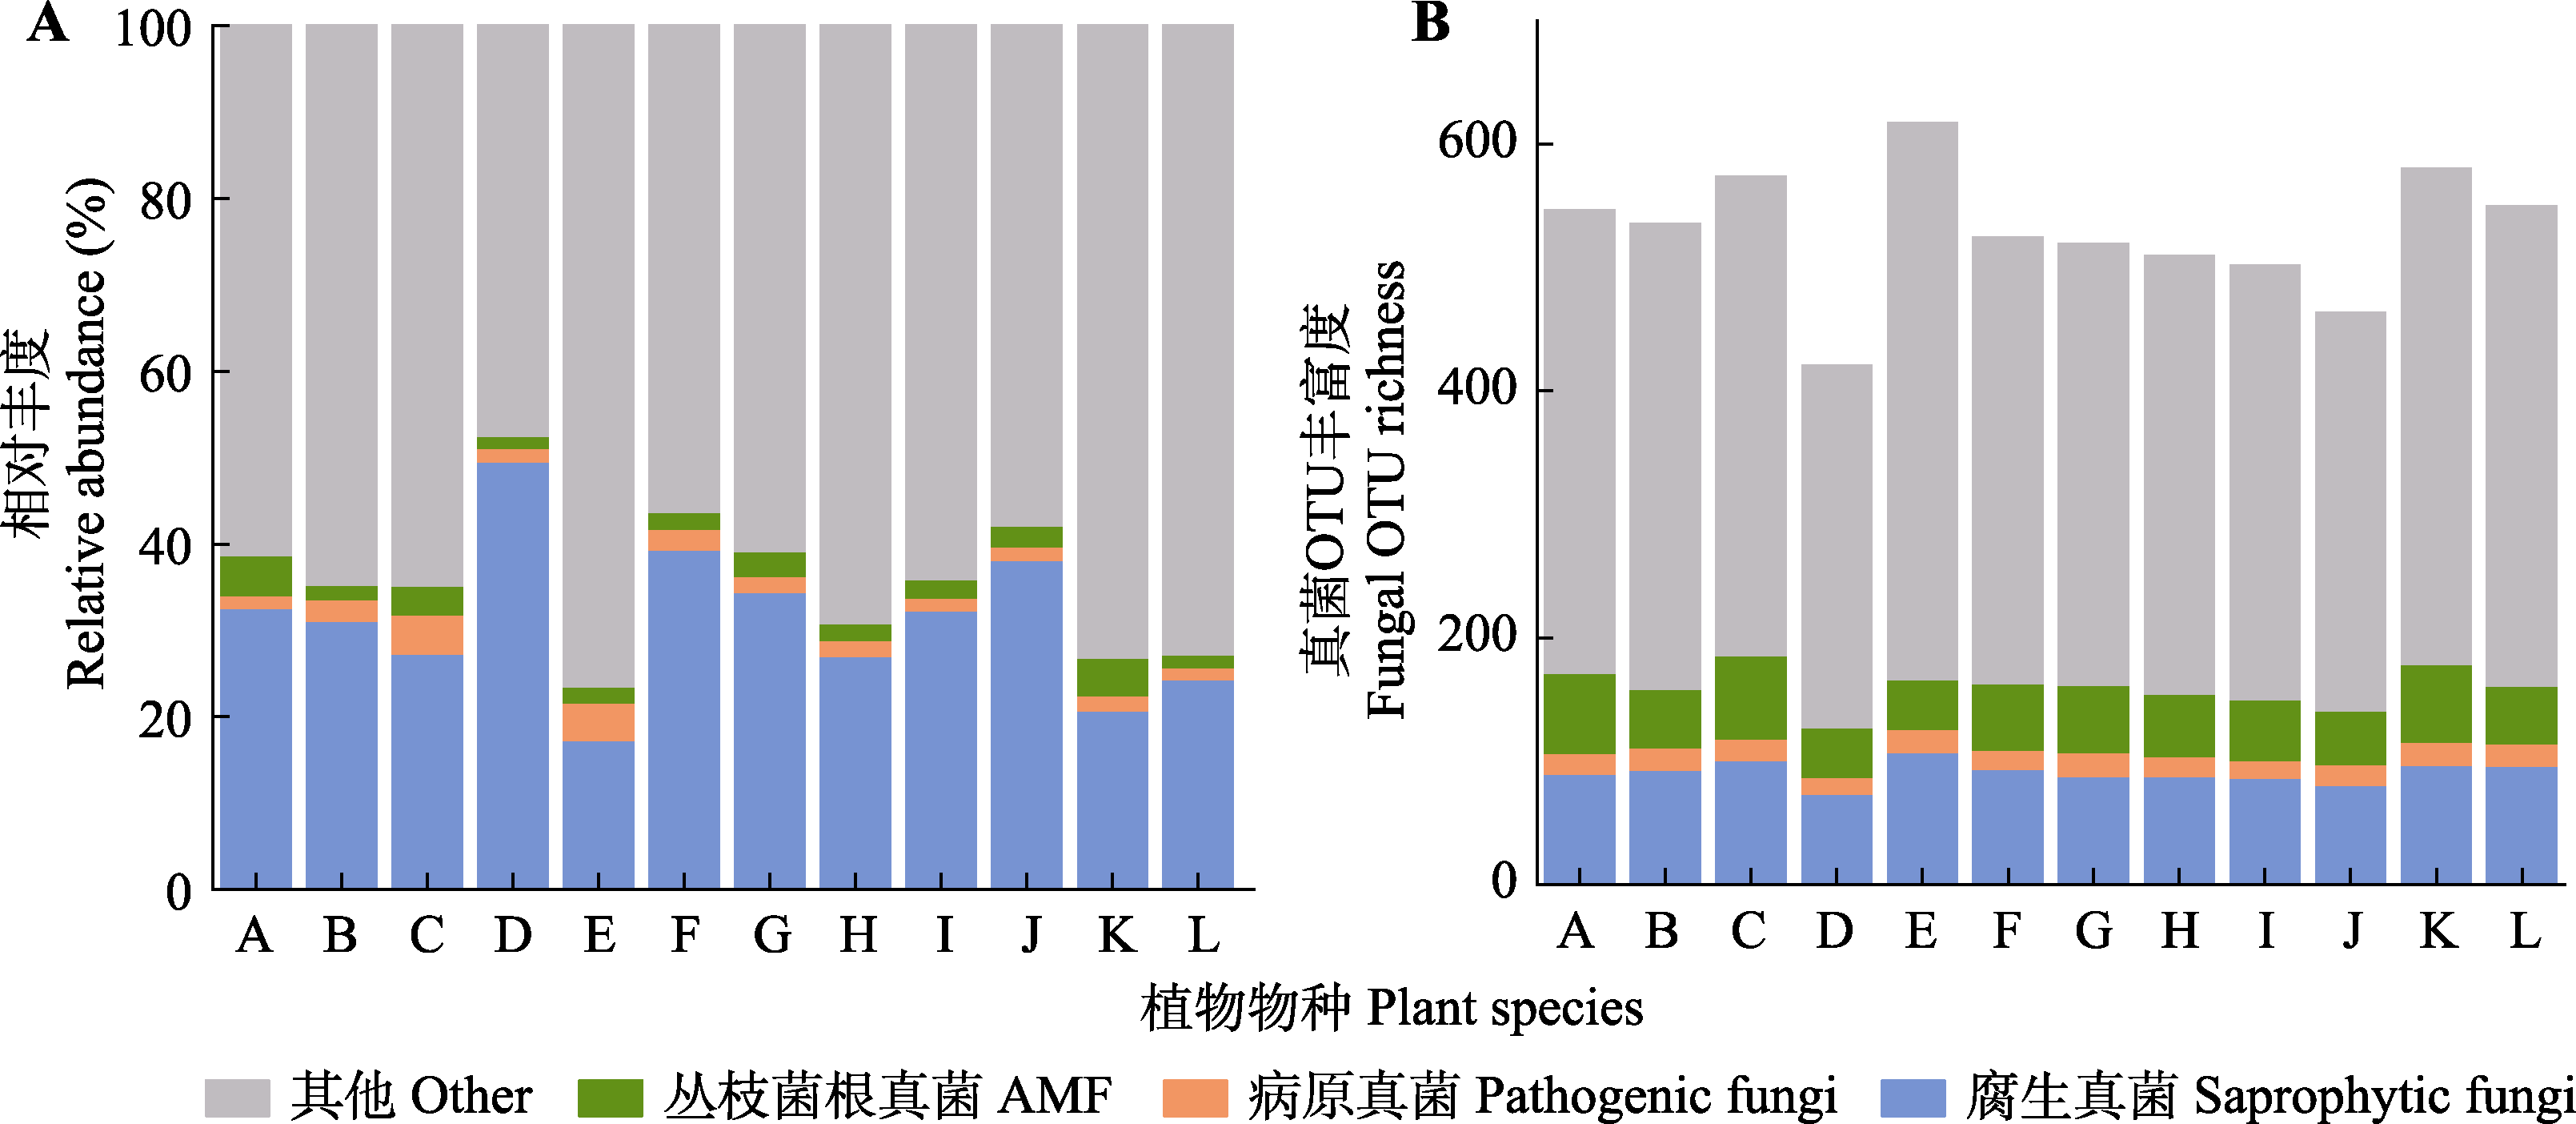
图3 植物根际土壤真菌的群落组成(A)和多样性(B)。A, 无芒雀麦; B, 披碱草; C, 羊草; D, 花苜蓿; E, 黄囊薹草; F, 裂叶蒿; G, 车前; H, 地榆; I, 路边青; J, 瓣蕊唐松草; K, 腺毛委陵菜; L, 亚洲蓍。OTU, 运算分类单元。
Fig. 3 Community composition (A) and diversity (B) of plant rhizosphere soil fungi. A, Bromus inermis; B, Elymus dahuricus; C, Leymus chinensis; D, Medicago ruthenica; E, Carex korshinskyi; F, Artemisia tanacetifolia; G, Plantago asiatica; H, Sanguisorba officinalis; I, Geum aleppicum; J, Thalictrum petaloideum; K, Potentilla longifolia; L, Achillea asiatica. OTU, operational taxonomic unit.
| 因子 Factor | df | FungiTotal | FungiSap | FungiPath | FungiAMF | 生物量 Biomass | ||||||
|---|---|---|---|---|---|---|---|---|---|---|---|---|
| Est. | SE | Est. | SE | Est. | SE | Est. | SE | Est. | SE | |||
| SLA | 62 | -24.16† | 12.26 | -4.61* | 2.21 | -0.72 | 0.52 | -2.60 | 2.51 | -14.36*** | 2.94 | |
| LN | 62 | -23.64† | 12.22 | -3.72 | 2.23 | -0.95† | 0.51 | -1.30 | 2.50 | -8.18* | 3.27 | |
| LP | 62 | -8.63 | 12.59 | -0.99 | 2.30 | -0.15 | 0.53 | -1.14 | 2.54 | -11.41*** | 3.12 | |
| LDMC | 62 | 12.06 | 12.53 | 1.49 | 2.29 | 0.52 | 0.52 | 1.68 | 2.54 | 13.27*** | 3.01 | |
| LMA | 62 | 19.31 | 12.41 | 4.03 | 2.23 | 0.68 | 0.52 | 1.27 | 2.52 | 16.02*** | 2.81 | |
| RN | 62 | -37.90** | 11.64 | -5.64* | 2.16 | -0.90† | 0.51 | -4.01 | 2.47 | -9.26** | 3.23 | |
| RP | 62 | -17.05 | 12.47 | -1.79 | 2.29 | -0.53 | 0.52 | -2.95 | 2.53 | -9.08** | 3.24 | |
| RD | 62 | -22.42 | 12.28 | -3.55 | 2.25 | -0.69 | 0.52 | -0.43 | 2.55 | -9.33** | 3.23 | |
| SRA | 62 | 25.08* | 12.22 | 4.10 | 2.23 | 1.08* | 0.51 | 2.70 | 2.52 | 7.80* | 3.29 | |
| SRL | 62 | 28.00* | 12.09 | 4.82* | 2.20 | 1.16* | 0.50 | 0.74 | 2.52 | 10.41** | 3.18 | |
| SRTA | 62 | 32.52** | 11.86 | 5.74** | 2.15 | 0.98† | 0.51 | -2.17 | 2.49 | 15.81*** | 2.82 | |
| SWC | 67 | -17.90 | 12.48 | -1.50 | 2.36 | -0.22 | 0.53 | -6.83* | 2.60 | -0.33 | 3.42 | |
| pH | 67 | 12.970 | 12.57 | 3.78 | 2.33 | 0.01 | 0.54 | -2.74 | 2.71 | -1.97 | 3.41 | |
| TN | 67 | -23.24† | 12.35 | -3.14 | 2.34 | -0.52 | 0.53 | -5.08† | 2.66 | -0.28 | 3.42 | |
| NH4+-N | 67 | 7.33 | 12.64 | 5.49* | 2.27 | 0.57 | 0.53 | -9.53*** | 2.47 | 0.34 | 3.42 | |
| NO3--N | 67 | -5.03 | 12.65 | 1.49 | 2.36 | 0.62 | 0.53 | -7.87** | 2.55 | 1.83 | 3.41 | |
| TP | 67 | -24.11† | 12.32 | -4.94* | 2.29 | -0.66 | 0.53 | -0.74 | 2.73 | -0.28 | 3.42 | |
| AP | 67 | -21.66† | 12.39 | -5.12* | 2.28 | -0.67 | 0.53 | 1.17 | 2.73 | -0.64 | 3.42 | |
| SOC | 67 | -28.70* | 12.17 | -5.36* | 2.28 | -0.90† | 0.52 | -2.60 | 2.71 | -0.65 | 3.42 | |
表1 植物功能性状和土壤属性对根际土壤真菌多样性和地上生物量的影响
Table 1 Effect of plant functional traits (PFT) and soil properties on rhizosphere soil fungal diversity and aboveground biomass
| 因子 Factor | df | FungiTotal | FungiSap | FungiPath | FungiAMF | 生物量 Biomass | ||||||
|---|---|---|---|---|---|---|---|---|---|---|---|---|
| Est. | SE | Est. | SE | Est. | SE | Est. | SE | Est. | SE | |||
| SLA | 62 | -24.16† | 12.26 | -4.61* | 2.21 | -0.72 | 0.52 | -2.60 | 2.51 | -14.36*** | 2.94 | |
| LN | 62 | -23.64† | 12.22 | -3.72 | 2.23 | -0.95† | 0.51 | -1.30 | 2.50 | -8.18* | 3.27 | |
| LP | 62 | -8.63 | 12.59 | -0.99 | 2.30 | -0.15 | 0.53 | -1.14 | 2.54 | -11.41*** | 3.12 | |
| LDMC | 62 | 12.06 | 12.53 | 1.49 | 2.29 | 0.52 | 0.52 | 1.68 | 2.54 | 13.27*** | 3.01 | |
| LMA | 62 | 19.31 | 12.41 | 4.03 | 2.23 | 0.68 | 0.52 | 1.27 | 2.52 | 16.02*** | 2.81 | |
| RN | 62 | -37.90** | 11.64 | -5.64* | 2.16 | -0.90† | 0.51 | -4.01 | 2.47 | -9.26** | 3.23 | |
| RP | 62 | -17.05 | 12.47 | -1.79 | 2.29 | -0.53 | 0.52 | -2.95 | 2.53 | -9.08** | 3.24 | |
| RD | 62 | -22.42 | 12.28 | -3.55 | 2.25 | -0.69 | 0.52 | -0.43 | 2.55 | -9.33** | 3.23 | |
| SRA | 62 | 25.08* | 12.22 | 4.10 | 2.23 | 1.08* | 0.51 | 2.70 | 2.52 | 7.80* | 3.29 | |
| SRL | 62 | 28.00* | 12.09 | 4.82* | 2.20 | 1.16* | 0.50 | 0.74 | 2.52 | 10.41** | 3.18 | |
| SRTA | 62 | 32.52** | 11.86 | 5.74** | 2.15 | 0.98† | 0.51 | -2.17 | 2.49 | 15.81*** | 2.82 | |
| SWC | 67 | -17.90 | 12.48 | -1.50 | 2.36 | -0.22 | 0.53 | -6.83* | 2.60 | -0.33 | 3.42 | |
| pH | 67 | 12.970 | 12.57 | 3.78 | 2.33 | 0.01 | 0.54 | -2.74 | 2.71 | -1.97 | 3.41 | |
| TN | 67 | -23.24† | 12.35 | -3.14 | 2.34 | -0.52 | 0.53 | -5.08† | 2.66 | -0.28 | 3.42 | |
| NH4+-N | 67 | 7.33 | 12.64 | 5.49* | 2.27 | 0.57 | 0.53 | -9.53*** | 2.47 | 0.34 | 3.42 | |
| NO3--N | 67 | -5.03 | 12.65 | 1.49 | 2.36 | 0.62 | 0.53 | -7.87** | 2.55 | 1.83 | 3.41 | |
| TP | 67 | -24.11† | 12.32 | -4.94* | 2.29 | -0.66 | 0.53 | -0.74 | 2.73 | -0.28 | 3.42 | |
| AP | 67 | -21.66† | 12.39 | -5.12* | 2.28 | -0.67 | 0.53 | 1.17 | 2.73 | -0.64 | 3.42 | |
| SOC | 67 | -28.70* | 12.17 | -5.36* | 2.28 | -0.90† | 0.52 | -2.60 | 2.71 | -0.65 | 3.42 | |
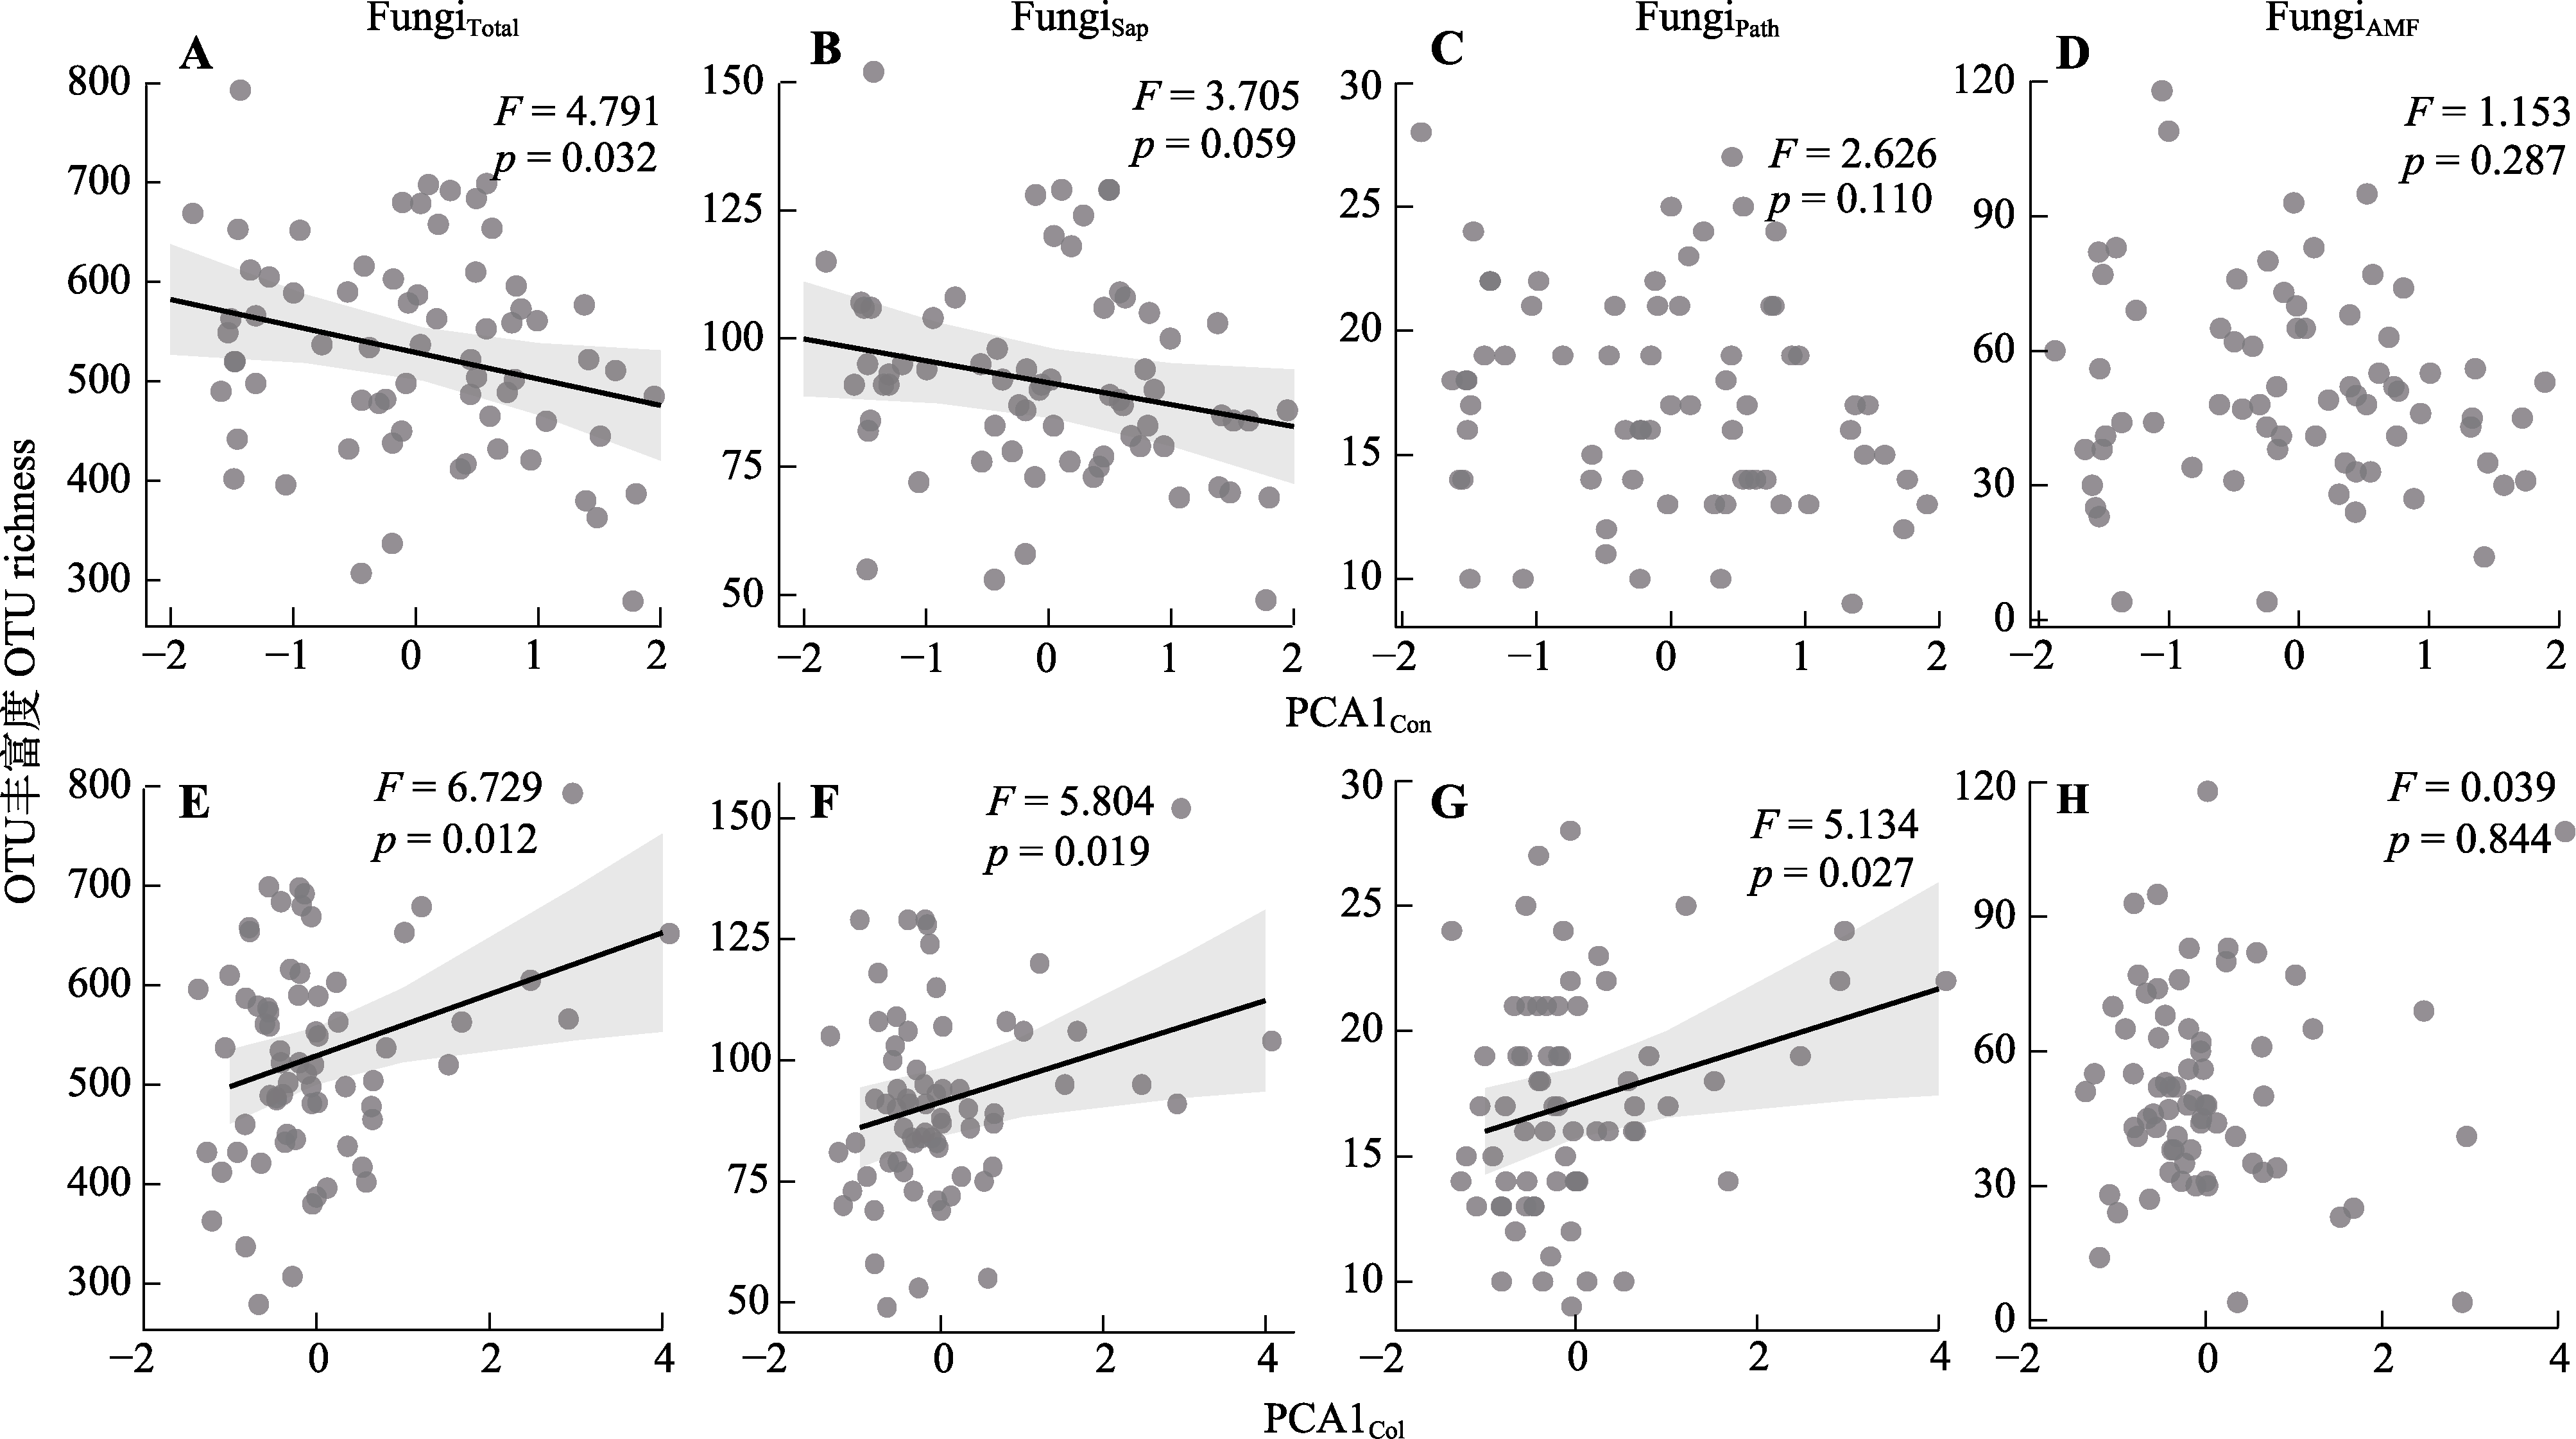
图4 植物资源获取策略对根际真菌运算分类单元(OTU)丰富度影响的混合效应模型。FungiTotal, 总体真菌的OTU丰富度; FungiSap, 腐生真菌的OTU丰富度; FungiPath, 病原真菌的OTU丰富度; FungiAMF, 丛枝菌根真菌的OTU丰富度。PCA1Col, 协作维度相关性状主成分分析第一轴的得分; PCA1Con, “快-慢”经济谱相关性状主成分分析第一轴的得分。实线代表线性混合效应模型的斜率值显著(p < 0.05或p ≈ 0.05), 阴影区域代表拟合的95%置信区间。
Fig. 4 Linear mixed-effects modelling of the effect of plant resource acquisition strategies on operational taxonomic units (OTU) richness of rhizosphere soil fungi. FungiTotal, OTU richness of overall fungi; FungiSap, OTU richness of saprophytic fungi; FungiPath, OTU richness of pathogenic fungi; FungiAMF, OTU richness of arbuscular mycorrhizal fungi. PCA1Col, scores on the first axis of principal component analysis for traits related to the collaboration dimension; PCA1Con, scores on the first axis of principal component analysis for traits related to the “fast-slow” economic spectrum. The solid line represents the significant slope value (p < 0.05 or p ≈ 0.05) for the linear mixed-effects model, and the corresponding shaded area represents the fitted 95% confidence interval.
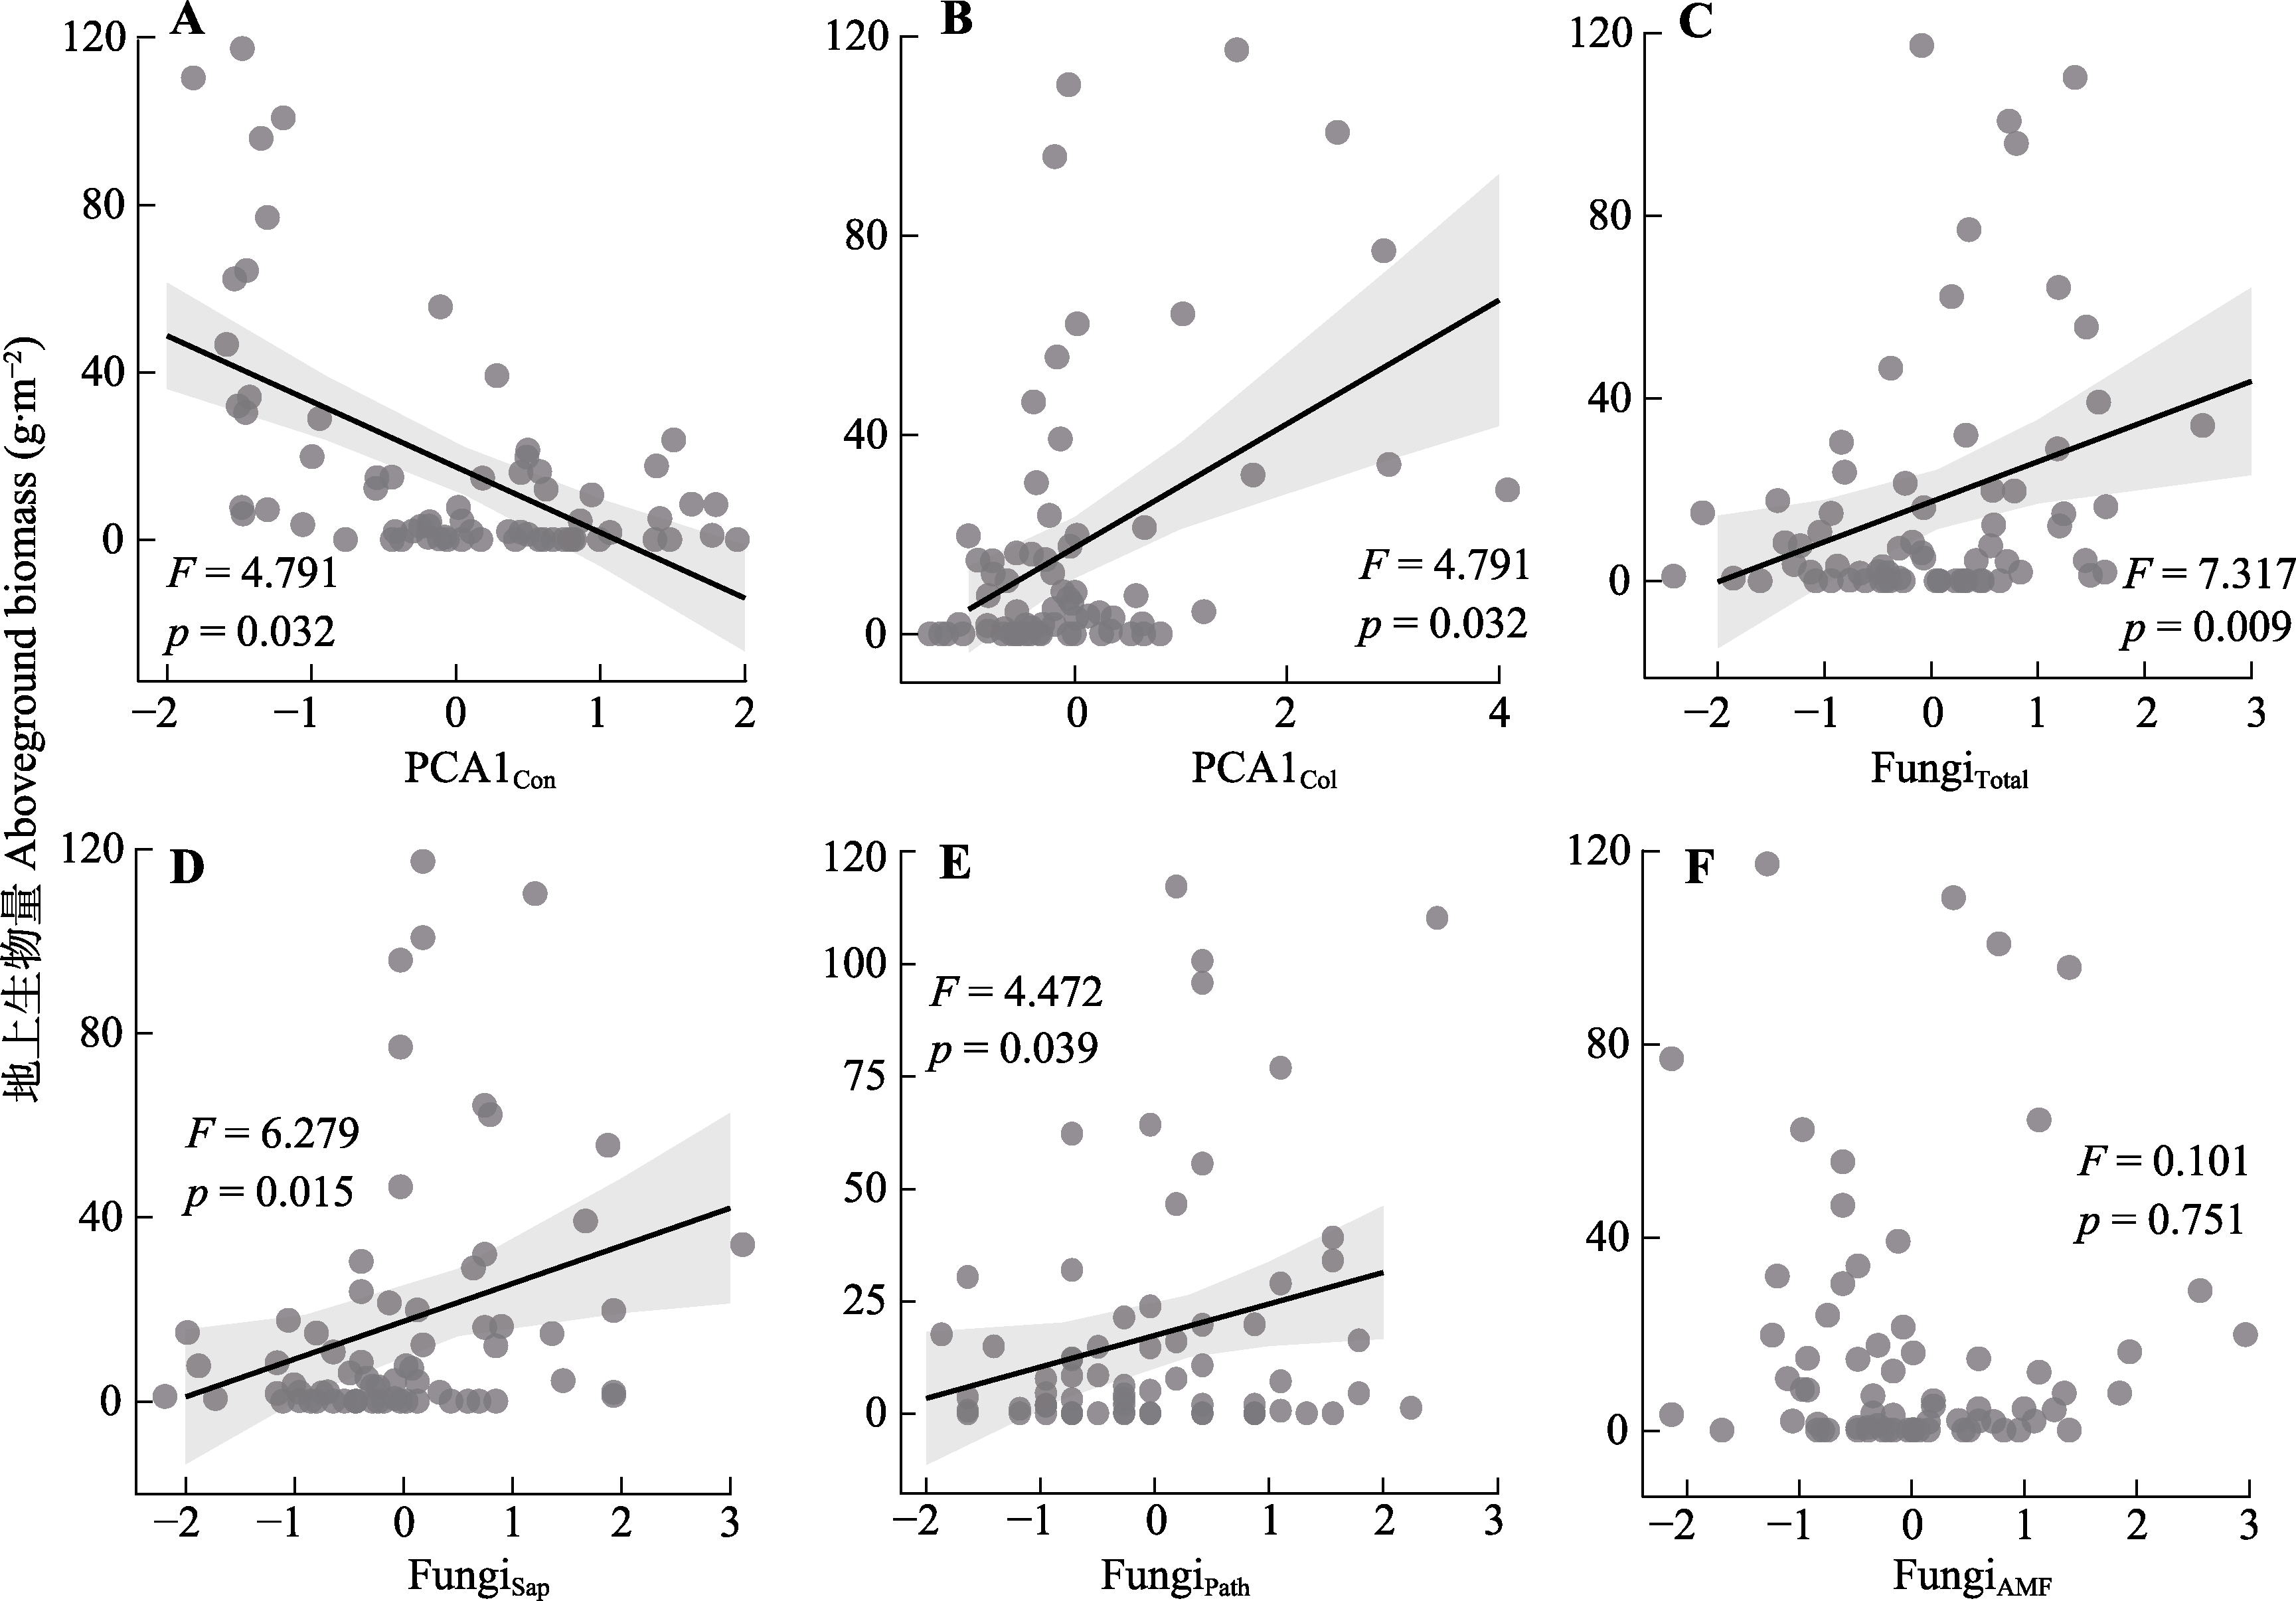
图5 植物资源获取策略以及根际土壤真菌多样性对地上生物量影响的混合效应模型。FungiTotal, 总体真菌的运算分类单元(OTU)丰富度; FungiSap, 腐生真菌的OTU丰富度; FungiPath, 病原真菌的OTU丰富度; FungiAMF, 丛枝菌根真菌的OTU丰富度。PCA1Col, 协作维度相关性状主成分分析第一轴的得分; PCA1Con, “快-慢”经济谱相关性状主成分分析第一轴的得分。
Fig. 5 Linear mixed-effects modelling of the effect of plant resource acquisition strategies and rhizosphere soil fungal diversity on aboveground biomass. FungiTotal, operational taxonomic units (OTU) richness of overall fungi; FungiSap, OTU richness of saprophytic fungi; FungiPath, OTU richness of pathogenic fungi; FungiAMF, OTU richness of arbuscular mycorrhizal fungi. PCA1Col, scores on the first axis of principal component analysis for traits related to the collaboration dimension; PCA1Con, scores on the first axis of principal component analysis for traits related to the “fast-slow” economic spectrum.
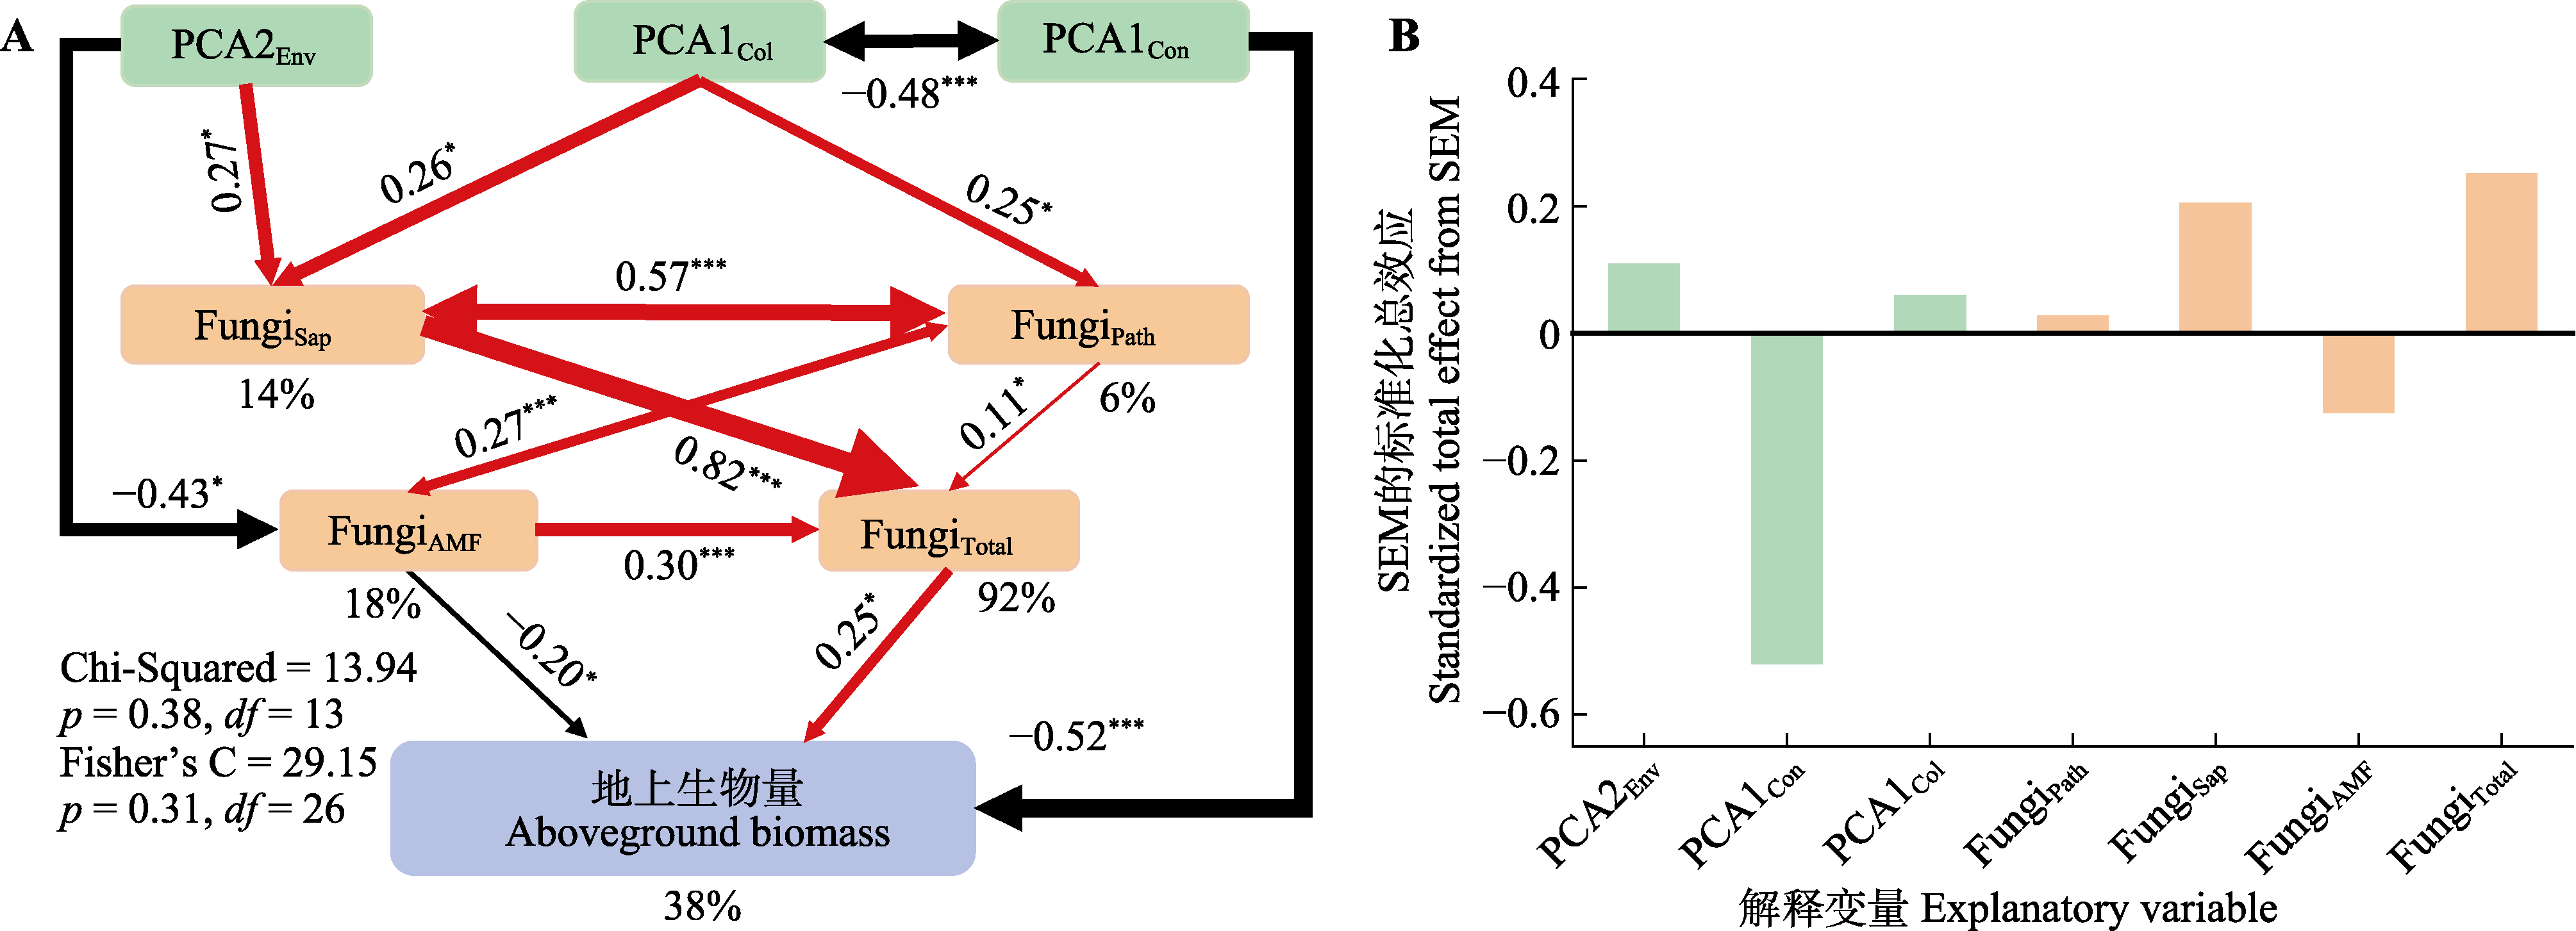
图6 植物资源获取策略以及根际土壤真菌多样性对地上生物量直接和间接效应的结构方程模型(SEM)。红色和黑色的箭头分别代表正效应和负效应, 箭头上的数字表示标准化的路径系数。箭头的粗细与这些路径系数的大小成正比。FungiTotal, 总体真菌的运算分类单元(OTU)丰富度; FungiSap, 腐生真菌的OTU丰富度; FungiPath, 病原真菌的OTU丰富度; FungiAMF, 丛枝菌根真菌的OTU丰富度; PCA1Col, 协作维度相关性状主成分分析第一轴的得分; PCA1Con, “快-慢”经济谱相关性状主成分分析第一轴的得分; PCA2Env, 土壤属性主成分分析第二轴的得分。显著性水平: †, p ≈ 0.05; *, p < 0.05; ***, p < 0.001。双向箭头表示变量之间存在显著的相关性。模型中各因变量的R2以百分比表示。
Fig. 6 Structural equation modelling (SEM) of the direct and indirect effect of plant resource acquisition strategies and rhizosphere soil fungal diversity on aboveground biomass. Red and black arrows represent positive and negative effects, respectively, and the numbers on the arrows represent standardized path coefficients. The arrow thickness is proportional to the magnitude of these path coefficients. FungiTotal, operational taxonomic units (OTU) richness of overall fungi; FungiSap, OTU richness of saprophytic fungi; FungiPath, OTU richness of pathogenic fungi; FungiAMF, OTU richness of arbuscular mycorrhizal fungi; PCA1Col, scores on the first axis of principal component analysis for traits related to the collaboration dimension; PCA1Con, scores on the first axis of principal component analysis for traits related to the “fast-slow” economic spectrum; PCA2Env, scores on the second axis of principal component analysis for soil properties. The significance levels are denoted as follows: †, p ≈ 0.05; *, p < 0.05; **, p < 0.01; ***, p < 0.001. Two-way arrows indicate significant correlations between variables. The R2 of each dependent variable in the model are expressed as percentages.
| [1] |
Berendsen RL, Pieterse CMJ, Bakker PAHM (2012). The rhizosphere microbiome and plant health. Trends in Plant Science, 17, 478-486.
DOI PMID |
| [2] | Bergmann J, Weigelt A, van der Plas F, Laughlin DC, Kuyper TW, Guerrero-Ramirez N, Valverde-Barrantes OJ, Bruelheide H, Freschet GT, Iversen CM, Kattge J, McCormack ML, Meier IC, Rillig MC, Roumet C, et al. (2020). The fungal collaboration gradient dominates the root economics space in plants. Science Advances, 6, eaba3756. DOI: 10.1126/sciadv.aba3756. |
| [3] |
Campos ML, Yoshida Y, Major IT, de Oliveira Ferreira D, Weraduwage SM, Froehlich JE, Johnson BF, Kramer DM, Jander G, Sharkey TD, Howe GA (2016). Rewiring of jasmonate and phytochrome B signalling uncouples plant growth-defense tradeoffs. Nature Communications, 7, 12570. DOI: 10.1038/ncomms12570.
PMID |
| [4] |
Chen L, Swenson NG, Ji NN, Mi XC, Ren HB, Guo LD, Ma KP (2019). Differential soil fungus accumulation and density dependence of trees in a subtropical forest. Science, 366, 124-128.
DOI PMID |
| [5] | Cortois R, Schröder-Georgi T, Weigelt A, van der Putten WH, de Deyn GB (2016). Plant-soil feedbacks: role of plant functional group and plant traits. Journal of Ecology, 104, 1608-1617. |
| [6] |
Crawford KM, Bauer JT, Comita LS, Eppinga MB, Johnson DJ, Mangan SA, Queenborough SA, Strand AE, Suding KN, Umbanhowar J, Bever JD (2019). When and where plant-soil feedback may promote plant coexistence: a meta-analysis. Ecology Letters, 22, 1274-1284.
DOI PMID |
| [7] |
Delory BM, Callaway RM, Semchenko M (2024). A trait-based framework linking the soil metabolome to plant-soil feedbacks. New Phytologist, 241, 1910-1921.
DOI PMID |
| [8] | Freschet GT, Pagès L, Iversen CM, Comas LH, Rewald B, Roumet C, Klimešová J, Zadworny M, Poorter H, Postma JA, Adams TS, Bagniewska-Zadworna A, Bengough AG, Blancaflor EB, Brunner I, et al. (2021). A starting guide to root ecology: strengthening ecological concepts and standardising root classification, sampling, processing and trait measurements. New Phytologist, 232, 973-1122. |
| [9] |
Gundale MJ, Kardol P (2021). Multi-dimensionality as a path forward in plant-soil feedback research. Journal of Ecology, 109, 3446-3465.
DOI URL |
| [10] |
Han MG, Chen Y, Sun LJ, Yu M, Li R, Li SF, Su JR, Zhu B (2023). Linking rhizosphere soil microbial activity and plant resource acquisition strategy. Journal of Ecology, 111, 875-888.
DOI URL |
| [11] |
Hennecke J, Bassi L, Mommer L, Albracht C, Bergmann J, Eisenhauer N, Guerra CA, Heintz-Buschart A, Kuyper TW, Lange M, Solbach MD, Weigelt A (2023). Responses of rhizosphere fungi to the root economics space in grassland monocultures of different age. New Phytologist, 240, 2035-2049.
DOI URL |
| [12] |
Hiiesalu I, Pärtel M, Davison J, Gerhold P, Metsis M, Moora M, Öpik M, Vasar M, Zobel M, Wilson SD (2014). Species richness of arbuscular mycorrhizal fungi: associations with grassland plant richness and biomass. New Phytologist, 203, 233-244.
DOI PMID |
| [13] |
Jani AD, Grossman JM, Smyth TJ, Hu SJ (2015). Influence of soil inorganic nitrogen and root diameter size on legume cover crop root decomposition and nitrogen release. Plant and Soil, 393, 57-68.
DOI URL |
| [14] |
Lefcheck JS (2016). piecewiseSEM: piecewise structural equation modelling in R for ecology, evolution, and systematics. Methods in Ecology and Evolution, 7, 573-579.
DOI URL |
| [15] |
Ma ZY, Liu HY, Mi ZR, Zhang ZH, Wang YH, Xu W, Jiang L, He JS (2017). Climate warming reduces the temporal stability of plant community biomass production. Nature Communications, 8, 15378. DOI: 10.1038/ncomms15378.
PMID |
| [16] |
Mangan SA, Schnitzer SA, Herre EA, Mack KML, Valencia MC, Sanchez EI, Bever JD (2010). Negative plant-soil feedback predicts tree-species relative abundance in a tropical forest. Nature, 466, 752-755.
DOI |
| [17] | Martínez-García LB, Korthals GW, Brussaard L, Mainardi G, de Deyn GB (2021). Litter quality drives nitrogen release, and agricultural management (organic vs. conventional) drives carbon loss during litter decomposition in agro-ecosystems. Soil Biology & Biochemistry, 153, 108115. DOI: 10.1016/j.soilbio.2020.108115. |
| [18] | Põlme S, Abarenkov K, Henrik Nilsson R, Lindahl BD, Clemmensen KE, Kauserud H, Nguyen N, Kjøller R, Bates ST, Baldrian P, Frøslev TG, Adojaan K, Vizzini A, Suija A, Pfister D, et al. (2020). FungalTraits: a user-friendly traits database of fungi and fungus-like stramenopiles. Fungal Diversity, 105, 1-16. |
| [19] |
Prieto I, Stokes A, Roumet C (2016). Root functional parameters predict fine root decomposability at the community level. Journal of Ecology, 104, 725-733.
DOI URL |
| [20] |
Reich PB (2014). The world-wide ‘fast-slow’ plant economics spectrum: a traits manifesto. Journal of Ecology, 102, 275-301.
DOI URL |
| [21] | Semchenko M, Leff JW, Lozano YM, Saar S, Davison J, Wilkinson A, Jackson BG, Pritchard WJ, de Long JR, Oakley S, Mason KE, Ostle NJ, Baggs EM, Johnson D, Fierer N, Bardgett RD (2018). Fungal diversity regulates plant-soil feedbacks in temperate grassland. Science Advances, 4, eaau4578. DOI: 10.1126/sciadv.aau457. |
| [22] |
van der Wal A, Geydan TD, Kuyper TW, de Boer W (2013). A thready affair: linking fungal diversity and community dynamics to terrestrial decomposition processes. FEMS Microbiology Reviews, 37, 477-494.
DOI PMID |
| [23] |
van Ruijven J, Ampt E, Francioli D, Mommer L (2020). Do soil-borne fungal pathogens mediate plant diversity-productivity relationships? Evidence and future opportunities. Journal of Ecology, 108, 1810-1821.
DOI URL |
| [24] |
Wang FP, Shi GX, Nicholas O, Yao BQ, Ji MF, Wang WY, Ma Z, Zhou HK, Zhao XQ (2018). Ecosystem nitrogen retention is regulated by plant community trait interactions with nutrient status in an alpine meadow. Journal of Ecology, 106, 1570-1581.
DOI URL |
| [25] |
Wang MX, Ge AH, Ma XZ, Wang XL, Xie QJ, Wang LK, Song XW, Jiang MC, Yang WB, Murray JD, Wang YY, Liu H, Cao XF, Wang ET (2024). Dynamic root microbiome sustains soybean productivity under unbalanced fertilization. Nature Communications, 15, 1668. DOI: 10.1038/s41467-024-45925-5.
PMID |
| [26] |
Weigelt A, Mommer L, Andraczek K, Iversen CM, Bergmann J, Bruelheide H, Fan Y, Freschet GT, Guerrero-Ramírez NR, Kattge J, Kuyper TW, Laughlin DC, Meier IC, van der Plas F, Poorter H, et al. (2021). An integrated framework of plant form and function: the belowground perspective. New Phytologist, 232, 42-59.
DOI PMID |
| [27] |
Williams A, Langridge H, Straathof AL, Muhamadali H, Hollywood KA, Goodacre R, de Vries FT (2022). Root functional traits explain root exudation rate and composition across a range of grassland species. Journal of Ecology, 110, 21-33.
DOI URL |
| [28] |
Wolters H, Jürgens G (2009). Survival of the flexible: hormonal growth control and adaptation in plant development. Nature Reviews Genetics, 10, 305-317.
DOI PMID |
| [29] |
Wright IJ, Reich PB, Cornelissen JHC, Falster DS, Garnier E, Hikosaka K, Lamont BB, Lee W, Oleksyn J, Osada N, Poorter H, Villar R, Warton DI, Westoby M (2005). Assessing the generality of global leaf trait relationships. New Phytologist, 166, 485-496.
DOI PMID |
| [30] |
Xi NX, Adler PB, Chen DX, Wu HY, Catford JA, van Bodegom PM, Bahn M, Crawford KM, Chu CJ (2021). Relationships between plant-soil feedbacks and functional traits. Journal of Ecology, 109, 3411-3423.
DOI URL |
| [31] |
Zhang L, Liu J, Xi JZ, Pang R, Gunina A, Zhou SR (2024). Competition for nitrogen between plants and microorganisms in grasslands: effect of nitrogen application rate and plant acquisition strategy. Biology and Fertility of Soils, 60, 227-236.
DOI |
| [32] |
Zhang L, Xu MG, Liu Y, Zhang FS, Hodge A, Feng G (2016). Carbon and phosphorus exchange may enable cooperation between an arbuscular mycorrhizal fungus and a phosphate-solubilizing bacterium. New Phytologist, 210, 1022-1032.
DOI PMID |
| [33] | Zhao N, Li SN, Lu SW, Wang XJ, Chen ZT, Xu XT (2023). High resistance to spring drought of grasslands under different degradation levels on a Leymus chinensis steppe. Global Ecology and Conservation, 43, e02471. DOI: 10.1016/j.gecco.2023.e02471. |
| [34] |
Zhou M, Guo YM, Sheng J, Yuan YJ, Zhang WH, Bai WM (2022). Using anatomical traits to understand root functions across root orders of herbaceous species in a temperate steppe. New Phytologist, 234, 422-434.
DOI PMID |
| [1] | 江康威, 吕程, 王亚菲, 李宏, 张芷晴, 王雨, 张青青, 吐尔逊娜依•热依木. 放牧干扰下丛枝菌根真菌群落对土壤多功能性的影响[J]. 植物生态学报, 2026, 50(3): 685-699. |
| [2] | 徐恩相, 周蕾, 章晓炜, 张国萍, 仲杜伟, 黄智, 刘派, 迟永刚. 基于不同生育阶段冠层光谱和碳通量的水稻产量估算[J]. 植物生态学报, 2026, 50(1): 82-93. |
| [3] | 刘伟, 郝毅晴, 孙佳美, 王璟, 范冰, 郝建玺, 金那申, 潘庆民. 呼伦贝尔退化草原土壤养分调控的原理与技术[J]. 植物生态学报, 2025, 49(1): 138-147. |
| [4] | 黄玲, 王榛, 马泽, 杨发林, 李岚, SEREKPAYEV Nurlan, NOGAYEV Adilbek, 侯扶江. 长期放牧和氮添加对黄土高原典型草原长芒草种群生长的影响[J]. 植物生态学报, 2024, 48(3): 317-330. |
| [5] | 袁鹤洋, 郝珉辉, 何怀江, 张春雨, 赵秀海. 长白山物种丰富度与物种组成对森林生产力的影响及其随演替的变化[J]. 植物生态学报, 2024, 48(12): 1602-1611. |
| [6] | 刘位会, 宋小艳, 才仁多杰, 丁路明, 王长庭. 退化程度对高寒草甸不同优势植物根系形态性状和生物量的影响[J]. 植物生态学报, 2024, 48(12): 1666-1682. |
| [7] | 赵艳超, 陈立同. 土壤养分对青藏高原高寒草地生物量响应增温的调节作用[J]. 植物生态学报, 2023, 47(8): 1071-1081. |
| [8] | 葛萍, 李昂, 王银柳, 姜良超, 牛国祥, 哈斯木其尔, 王彦兵, 薛建国, 赵威, 黄建辉. 草甸草原温室气体排放对氮添加量的非线性响应[J]. 植物生态学报, 2023, 47(11): 1483-1492. |
| [9] | 郝晴, 黄昌. 森林地上生物量遥感估算研究综述[J]. 植物生态学报, 2023, 47(10): 1356-1374. |
| [10] | 董六文, 任正炜, 张蕊, 谢晨笛, 周小龙. 功能多样性比物种多样性更好解释氮添加对高寒草地生物量的影响[J]. 植物生态学报, 2022, 46(8): 871-881. |
| [11] | 陈丽, 田新民, 任正炜, 董六文, 谢晨笛, 周小龙. 养分添加对天山高寒草地植物多样性和地上生物量的影响[J]. 植物生态学报, 2022, 46(3): 280-289. |
| [12] | 黄侩侩, 胡刚, 庞庆玲, 张贝, 何业涌, 胡聪, 徐超昊, 张忠华. 放牧对中国亚热带喀斯特山地灌草丛物种组成与群落结构的影响[J]. 植物生态学报, 2022, 46(11): 1350-1363. |
| [13] | 陈哲, 汪浩, 王金洲, 石慧瑾, 刘慧颖, 贺金生. 基于物候相机归一化植被指数估算高寒草地植物地上生物量的季节动态[J]. 植物生态学报, 2021, 45(5): 487-495. |
| [14] | 苗百岭, 梁存柱, 史亚博, 梁茂伟, 刘钟龄. 降水变化对内蒙古典型草原地上生物量的影响[J]. 植物生态学报, 2019, 43(7): 557-565. |
| [15] | 赵丹丹, 马红媛, 李阳, 魏继平, 王志春. 水分和养分添加对羊草功能性状和地上生物量的影响[J]. 植物生态学报, 2019, 43(6): 501-511. |
| 阅读次数 | ||||||
|
全文 |
|
|||||
|
摘要 |
|
|||||
Copyright © 2026 版权所有 《植物生态学报》编辑部
地址: 北京香山南辛村20号, 邮编: 100093
Tel.: 010-62836134, 62836138; Fax: 010-82599431; E-mail: apes@ibcas.ac.cn, cjpe@ibcas.ac.cn
备案号: 京ICP备16067583号-19
![]()