
植物生态学报 ›› 2008, Vol. 32 ›› Issue (1): 80-87.DOI: 10.3773/j.issn.1005-264x.2008.01.009 cstr: 32100.14.j.issn.1005-264x.2008.01.009
布仁仓( ), 常禹, 胡远满, 李秀珍, 贺红士
收稿日期:2006-09-08
接受日期:2006-12-20
出版日期:2008-09-08
发布日期:2008-01-30
作者简介:E-mail: burc@iae.ac.cn基金资助:
BU Ren-Cang(), CHANG Yu, HU Yuan-Man, LI Xiu-Zhen, HE Hong-Shi
Received:2006-09-08
Accepted:2006-12-20
Online:2008-09-08
Published:2008-01-30
摘要:
小兴安岭地区是我国重要的林区之一,预测该地区针叶树种的分布,在不同尺度上查找针叶树种分布最敏感的环境因子,是不同层次的林业部门制定森林恢复和植树造林方针的重要科学依据。该文以坡度、坡向、综合地形指数、海拔、坡位指数、年平均温度和年平均降水量作为环境因子,利用Logistic回归模型对红松(Pinus koraiensis)、兴安落叶松(Larix gmelinii)、冷杉(Abies nephrolepis)、红皮云杉(Picea koraiensis)、鱼鳞云杉(P. jezoensis)和樟子松(Pinus sylvestris var. mongolica)的分布进行了预测。并且采用相对运行特征(Relative operating characteristic, ROC),对模型进行了精度评价。其取值范围为0~1,如果ROC小于0.7,认为模型具有低精度;如果大于0.7且小于0.9,则模型具有较好的模拟精度;如果大于0.9,认为模型具有很高的预测精度。对每个树种的模型验证表明只有冷杉的ROC大于80%,红松、兴安落叶松和云杉的ROC在70%~80%之间,而樟子松的为67.9%。之后,把预测模型应用到丰林保护区,揭示局域尺度上树种分布最敏感的环境因子。经过树种分布预测图与环境因子之间的相关分析发现,在区域尺度(整个研究区)上,红松、冷杉、云杉和樟子松对年降水量最为敏感,而兴安落叶松对坡度最敏感。在局域尺度(丰林保护区)上,红松分布对坡度最敏感,冷杉和云杉对海拔最敏感,兴安落叶松对坡位最敏感。在不同尺度上,树种最敏感的环境因子的转移,引起了在不同尺度上树种分布类型的变化。红松在区域尺度上聚集分布(ROC=78.6%),而在局域尺度上其聚集程度有所减弱(ROC=74.4%),红松的分布范围增加。在区域尺度上,云杉和冷杉聚集分布,但在局域尺度上,它们的分布接近随机分布类型(ROC<60%),它们在丰林保护区内分布面积较大。与以上3个树种相反,兴安落叶松的ROC从71.7%增加到了82.0%,在区域尺度上聚集分布的兴安落叶松,在局域尺度上更加聚集,其分布范围局限于某个特定环境(谷底)。总的来说,在区域尺度上,多数树种分布对气候因子最为敏感,在局域尺度上,对地理因子最为敏感。不同树种对不同环境因子的敏感性,揭示了树种空间分布格局和分异规律。
布仁仓, 常禹, 胡远满, 李秀珍, 贺红士. 小兴安岭针叶树种在不同尺度上对环境因子的敏感性分析. 植物生态学报, 2008, 32(1): 80-87. DOI: 10.3773/j.issn.1005-264x.2008.01.009
BU Ren-Cang, CHANG Yu, HU Yuan-Man, LI Xiu-Zhen, HE Hong-Shi. SENSITIVITY OF CONIFEROUS TREES TO ENVIRONMENTAL FACTORS AT DIFFERENT SCALES IN THE SMALL XING'AN MOUNTAINS, CHINA. Chinese Journal of Plant Ecology, 2008, 32(1): 80-87. DOI: 10.3773/j.issn.1005-264x.2008.01.009
| 模拟图 Simulation map | 林相图 Reality | ||
|---|---|---|---|
| 存在 Presence | 无 Absence | 合计 Total | |
| 存在 Presence | A | B | A+B |
| 无 Absence | C | D | C+D |
| 合计 Total | A+C | B+D | A+B+C+D |
表1 模型和林相图对比下树种的列联表
Table 1 Two-by-two contingency table showing the number of grid cells in the inventory map of species distribution (Reality) and a simulated map from logistic model
| 模拟图 Simulation map | 林相图 Reality | ||
|---|---|---|---|
| 存在 Presence | 无 Absence | 合计 Total | |
| 存在 Presence | A | B | A+B |
| 无 Absence | C | D | C+D |
| 合计 Total | A+C | B+D | A+B+C+D |
| 树种 Species | 常数 Constant | 坡位指数 TPI | 综合地形指数 CTI | 年平均温度 AAT | 年平均降水 AAP | 坡度 Slope | 坡向 Aspect | 海拔 DEM |
|---|---|---|---|---|---|---|---|---|
| 红松 Pinus koraiensis | -22.335 | -0.001 | -0.095 | 0.431 | 0.034 | 0.086 | -0.023 | 0.002 |
| 冷杉 Abies nephrolepis | -29.142 | -0.012 | -0.077 | -0.353 | 0.047 | 0.078 | -0.366 | 0.003 |
| 兴安落叶松 Larix gmelinii | 0.434 | -0.005 | 0.018 | -0.812 | 0.003 | -0.185 | 0.119 | -0.007 |
| 红皮云杉和鱼鳞云杉 Picea koraiensis & P. jezoensis | -22.107 | -0.012 | -0.060 | -0.014 | 0.034 | 0.036 | -0.144 | 0.004 |
| 樟子松 Pinus sylvestris var. mongolica | 15.722 | -0.006 | 0.007 | 1.501 | -0.048 | -0.065 | 0.127 | 0.016 |
表2 Logistic回归模型的估计系数
Table 2 The estimated coefficients of Logistic model for each species
| 树种 Species | 常数 Constant | 坡位指数 TPI | 综合地形指数 CTI | 年平均温度 AAT | 年平均降水 AAP | 坡度 Slope | 坡向 Aspect | 海拔 DEM |
|---|---|---|---|---|---|---|---|---|
| 红松 Pinus koraiensis | -22.335 | -0.001 | -0.095 | 0.431 | 0.034 | 0.086 | -0.023 | 0.002 |
| 冷杉 Abies nephrolepis | -29.142 | -0.012 | -0.077 | -0.353 | 0.047 | 0.078 | -0.366 | 0.003 |
| 兴安落叶松 Larix gmelinii | 0.434 | -0.005 | 0.018 | -0.812 | 0.003 | -0.185 | 0.119 | -0.007 |
| 红皮云杉和鱼鳞云杉 Picea koraiensis & P. jezoensis | -22.107 | -0.012 | -0.060 | -0.014 | 0.034 | 0.036 | -0.144 | 0.004 |
| 樟子松 Pinus sylvestris var. mongolica | 15.722 | -0.006 | 0.007 | 1.501 | -0.048 | -0.065 | 0.127 | 0.016 |
| 树种 Species | 区域尺度 Regional scale | 局域尺度 Local scale | |||||
|---|---|---|---|---|---|---|---|
| 百分比 Proportion (%) | ROC (%) | 百分比 Proportion (%) | ROC (%) | ||||
| 红松 Pinus koraiensis | 11.1 | 78.6 | 82.3 | 74.4 | |||
| 冷杉 Abies nephrolepis | 21.7 | 85.3 | 80.0 | 58.4 | |||
| 兴安落叶松 Larix gmelinii | 40.3 | 71.7 | 12.5 | 82.0 | |||
| 红皮云杉和鱼鳞云杉 Picea koraiensis & P. jezoensis | 23.6 | 79.6 | 61.8 | 59.8 | |||
| 樟子松 Pinus sylvestris var. mongolica | 0.63 | 67.9 | ** | ** | |||
表3 树种百分比和ROC值
Table 3 The proportion of species in the landscapes and its ROC value of corresponding Logistic models
| 树种 Species | 区域尺度 Regional scale | 局域尺度 Local scale | |||||
|---|---|---|---|---|---|---|---|
| 百分比 Proportion (%) | ROC (%) | 百分比 Proportion (%) | ROC (%) | ||||
| 红松 Pinus koraiensis | 11.1 | 78.6 | 82.3 | 74.4 | |||
| 冷杉 Abies nephrolepis | 21.7 | 85.3 | 80.0 | 58.4 | |||
| 兴安落叶松 Larix gmelinii | 40.3 | 71.7 | 12.5 | 82.0 | |||
| 红皮云杉和鱼鳞云杉 Picea koraiensis & P. jezoensis | 23.6 | 79.6 | 61.8 | 59.8 | |||
| 樟子松 Pinus sylvestris var. mongolica | 0.63 | 67.9 | ** | ** | |||
| 树种 Species | 坡位指数 TPI | 综合地形指数 CTI | 年平均温度 AAT | 年平均降水 AAP | 坡度 Slope | 坡向 Aspect | 海拔 DEM |
|---|---|---|---|---|---|---|---|
| 红松 Pinus koraiensis | 0.08 | -0.05 | -0.06 | 0.02 | 0.09 | 0.01 | 0.06 |
| 冷杉 Abies nephrolepis | 0.04 | -0.04 | -0.07 | 0.02 | 0.07 | -0.01 | 0.08 |
| 兴安落叶松 Larix gmelinii | -0.09 | 0.06 | 0.05 | -0.02 | -0.08 | -0.00 | -0.06 |
| 红皮云杉和鱼鳞云杉 Picea koraiensis & P. jezoensis | -0.01 | -0.02 | -0.05 | 0.02 | 0.05 | -0.01 | 0.06 |
| 樟子松 Pinus sylvestris var. mongolica | - | - | - | - | - | - | - |
表5 局域尺度上环境因子和树种分布的相关系数
Table 5 The correlation coefficients between the maps derived by Logistic models and the maps of environmental factors in Fenglin Natural Reserve at local scale
| 树种 Species | 坡位指数 TPI | 综合地形指数 CTI | 年平均温度 AAT | 年平均降水 AAP | 坡度 Slope | 坡向 Aspect | 海拔 DEM |
|---|---|---|---|---|---|---|---|
| 红松 Pinus koraiensis | 0.08 | -0.05 | -0.06 | 0.02 | 0.09 | 0.01 | 0.06 |
| 冷杉 Abies nephrolepis | 0.04 | -0.04 | -0.07 | 0.02 | 0.07 | -0.01 | 0.08 |
| 兴安落叶松 Larix gmelinii | -0.09 | 0.06 | 0.05 | -0.02 | -0.08 | -0.00 | -0.06 |
| 红皮云杉和鱼鳞云杉 Picea koraiensis & P. jezoensis | -0.01 | -0.02 | -0.05 | 0.02 | 0.05 | -0.01 | 0.06 |
| 樟子松 Pinus sylvestris var. mongolica | - | - | - | - | - | - | - |
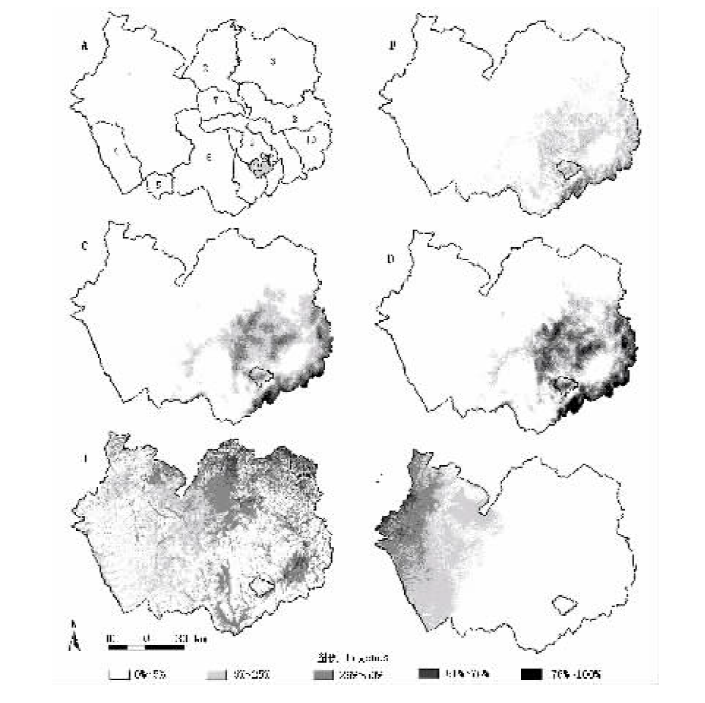
图1 研究区(A)以及红松(B)、云杉(C)、冷杉(D)、兴安落叶松(E)和樟子松(F)潜在分布图 1. 沾河 Zhanhe 2. 红星 Hongxing 3. 乌伊岭 Wuyiling 4. 通北Tongbei 5. 绥棱Suiling 6. 友好Youhao 7. 上甘岭Shangganling 8. 汤旺河Tangwnaghe 9. 五营Wuying 10. 新青Xinqing 11. 丽林Lilin 12. 丰林 Fenglin
Fig.1 The map of study region (A) and potential distributions of Pinus koraiensis (B), Picea koraiensis & P. jezoensis (C), Abies nephrolepis (D), Larix gmelinii (E) and Pinus sylvestris var. mongolica (F)
| 树种 Species | 坡位指数 TPI | 综合地形指数 CTI | 年平均温度 AAT | 年平均降水 AAP | 坡度 Slope | 坡向 Aspect | 海拔 DEM |
|---|---|---|---|---|---|---|---|
| 红松 Pinus koraiensis | 0.25 | -0.38 | -0.29 | 0.73 | 0.66 | 0.01 | 0.44 |
| 冷杉 Abies nephrolepis | 0.11 | -0.30 | -0.49 | 0.81 | 0.53 | -0.06 | 0.57 |
| 兴安落叶松 Larix gmelinii | -0.37 | 0.61 | 0.19 | -0.27 | -0.83 | 0.01 | -0.45 |
| 红皮云杉和鱼鳞云杉 Picea koraiensis & P. jezoensis | 0.01 | -0.26 | -0.46 | 0.83 | 0.46 | -0.03 | 0.58 |
| 樟子松 Pinus sylvestris var. mongolica | -0.04 | 0.12 | 0.12 | -0.70 | -0.27 | 0.06 | 0.05 |
表4 区域尺度上环境因子和树种分布的相关系数
Table 4 The correlation coefficients between the map simulated by Logistic model and the map of environmental factors for each species at regional scale
| 树种 Species | 坡位指数 TPI | 综合地形指数 CTI | 年平均温度 AAT | 年平均降水 AAP | 坡度 Slope | 坡向 Aspect | 海拔 DEM |
|---|---|---|---|---|---|---|---|
| 红松 Pinus koraiensis | 0.25 | -0.38 | -0.29 | 0.73 | 0.66 | 0.01 | 0.44 |
| 冷杉 Abies nephrolepis | 0.11 | -0.30 | -0.49 | 0.81 | 0.53 | -0.06 | 0.57 |
| 兴安落叶松 Larix gmelinii | -0.37 | 0.61 | 0.19 | -0.27 | -0.83 | 0.01 | -0.45 |
| 红皮云杉和鱼鳞云杉 Picea koraiensis & P. jezoensis | 0.01 | -0.26 | -0.46 | 0.83 | 0.46 | -0.03 | 0.58 |
| 樟子松 Pinus sylvestris var. mongolica | -0.04 | 0.12 | 0.12 | -0.70 | -0.27 | 0.06 | 0.05 |
| [1] | Berg Å, Gärdenfors U, von Proschwitz T (2004). Logistic regression models for predicting occurrence of terrestrial molluscs in southern Sweden—importance of environmental data quality and model complexity. Ecography, 27, 83-93. |
| [2] | Brotons L, Thuiller W, Araújo MB, Hirzel AH (2004). Presence-absence versus presence-only modelling methods for predicting bird habitat suitability. Ecography, 27, 437-448. |
| [3] | Calado G, Duarte P (2000). Modelling growth of Ruppia cirrhosa. Aquatic Botany, 68, 29-44. |
| [4] | Calef MP, McGuire AD, Epstein HE, Rupp TS, Shugart HH (2005). Analysis of vegetation distribution in Interior Alaska and sensitivity to climate change using a logistic regression approach. Journal of Biogeography, 32, 863-878. |
| [5] | Cerná L, Chytry M (2005). Supervised classification of plant communities with artificial neural networks. Journal of Vegetation Science, 16, 407-414. |
| [6] | Cumming GS (2002). Comparing climate and vegetation as limiting factors for species ranges of African ticks. Ecology, 83, 255-268. |
| [7] | Dobson AJ (2002). An Introduction to Generalized Linear Models 2nd edn. Chapman & Hall/CRC, Boca Raton, 255. |
| [8] | Fielding AH, Bell J (1997). A review of methods for the assessment of prediction errors in conservation presence/absence models. Environmental Conservation, 24, 38-49. |
| [9] | Gessler PE, Moore ID, McKenzie NJ, Ryan PJ (1995). Soil-landscape modeling and spatial prediction of soil attributes. International Journal of Geographic Information System, 9, 421-432. |
| [10] | Guisan A, Zimmermann NE (2000). Predictive habitat distribution models in ecology. Ecological Modelling, 135, 147-186. |
| [11] | Iverson LR, Prasad AM (1998). Predicting abundance of 80 tree species following climate change in the eastern United States. Ecological Monographs, 68, 465-485. |
| [12] | Jenness J (2005). Topographic Position Index (tpi-jen.avx) extension for ArcView 3.x. Jenness Enterprises. http://www.jennessent.com/arcview/tpi.htm. Cited 25 Jun 2005 |
| [13] | Kerr JT, Packer L (1997). Habitat heterogeneity as a determinant of mammal species richness in high-energy regions. Nature, 385, 252-254. |
| [14] | Liu C, Berry PM, Dawson TP, Pearson RG (2005). Selecting thresholds of occurrence in the prediction of species distributions. Ecography, 28, 385-393. |
| [15] | Ma JL (马建路), Liu DJ (刘德君)(1994). A study on correlativity between community types for natural Korean pine forest and site factors in Xiangxing'an Mountains. Journal of Northeast Forestry University (东北林业大学学报), 22(5), 7-13. (in Chinese with English abstract) |
| [16] | Meng M (孟猛), Ni J (倪健), Zhang ZG (张治国) (2004). Aridity index and its application in geo-ecological study. Acta Phytoecologica Sinica (植物生态学报), 28, 853-861. (in Chinese with English abstract) |
| [17] | Moore ID, Gessler PE, Nielsen GA, Petersen GA (1993). Terrain attributes: estimation methods and scale effects. In: Jakeman AJ, Beck MB, McAleer M eds. Modeling Change in Environmental Systems. Wiley, London, 189-214. |
| [18] | Nielsen SE, Johnson CJ, Heard DC, Boyce MS (2005). Can models of presence-absence be used to scale abundance? Two case studies considering extremes in life history. Ecography, 28, 197-208. |
| [19] | Roberts DW, Cooper SV (1989). Concepts and techniques of vegetation mapping. In: Fergusod DE, Morgan P, Tohnson FD eds. Land Classifications Based on Vegetation: Applications for Resource Management. USDA Forest Service General Technical Report INT-257, Ogden, UT, 90-96. |
| [20] | Schwarz M, Zimmermann NE (2005). A new GLM-based method for mapping tree cover continuous fields using regional MODIS reflectance data. Remote Sensing of Environment, 95, 428-443. |
| [21] | Tarboton DG (1997). A new method for the determination of flow directions and upslope areas in grid digital elevation models. Water Resources Research, 33, 309-319. |
| [22] | Thuiller W, Brotons L, Araújo MB, Lavorel S (2004). Effects of restricting environmental range of data to project current and future species distributions. Ecography, 27, 165-172. |
| [23] | Tognelli MF, Kelt DA (2004). Analysis of determinants of mammalian species richness in South America using spatial autoregressive models. Ecography, 27, 427-436. |
| [24] | van den Berg MS, Joosse W, Coops H (2003). A statistical model predicting the occurrence and dynamics of submerged macrophytes in shallow lakes in the Netherlands. Hydrobiologia, 506, 611-623. |
| [25] | van Nes EH, Scheffer M, van den Berg MS, Coops H (2002). Dominance of charophytes in eutrophic shallow lakes-when should we expect it to be an alternative stable state? Aquatic Botany, 72, 275-296. |
| [26] | Xu WD (徐文铎) (1983). A study on the relation between keystone and common species distribution and hydrothermal factors in Northeast China. Acta Botanica Sinica (植物学报), 10, 254-262. (in Chinese with English abstract) |
| [27] | Zhou HZ (周洪泽), Fang CZ (方春子), Wang H (王宏)(2000). Study on forest site classification and suitability of main tree species in Dongfanghong Forest Farm. Journal of Northeast Forestry University (东北林业大学学报), 28(5), 10-14. (in Chinese with English abstract) |
| [1] | 吴光进, 郭垚鑫, 任成杰, 王俊, 岳明, 赵发珠. 秦岭北麓不同植被类型土壤有机碳含量分布及其影响因素[J]. 植物生态学报, 2026, 50(预发表): 1-. |
| [2] | 田地, 迟小龙, 石亮, 刘宵含, 赵常提, 吴梅, 张玉忠, 高永亮. 塞罕坝地区优势造林树种叶片化学计量特征及其环境驱动[J]. 植物生态学报, 2026, 50(2): 362-373. |
| [3] | 韦鑫, 江蓝, 郑晨成, 朱静, 陈博, 李文周, 赖淑瑜, 刘金福, 何中声. 戴云山南坡海拔梯度上木本植物性系统分布特征及其影响因素[J]. 植物生态学报, 2026, 50(1): 150-159. |
| [4] | 韩菲, 王袼, 武帅楷, 林茂, 董宽虎, $\boxed{\hbox{王常慧}}$, 苏原. 极端降水对不同草原土壤总硝化及总氮矿化速率及其敏感性的影响[J]. 植物生态学报, 2025, 49(5): 697-709. |
| [5] | 葛小彩, 李锦隆, 孙俊, 武盼盼, 胡丹丹, 程栋梁, 钟全林. 武夷山亚高山草甸土壤呼吸组分特征及影响因素[J]. 植物生态学报, 2025, 49(3): 502-512. |
| [6] | 黄美红, 牛梦秋, 杨鹏飞, 林洁, 廖周瑜, 陈建国, 向建英. 不同温度和埋藏深度对高山垫状植物山生福禄草种子出苗及幼苗生长的影响[J]. 植物生态学报, 2025, 49(12): 2092-2104. |
| [7] | 竹万宽, 许宇星, 黄润霞, 杜阿朋, 王志超. 雷州半岛桉树人工林生态系统水分利用效率旱雨季差异及其控制因素[J]. 植物生态学报, 2025, 49(12): 2015-2029. |
| [8] | 付照琦, 胡旭, 田沁瑞, 葛艳灵, 周红娟, 吴小云, 陈立欣. 晋西黄土区2种典型森林树种夜间液流特征及对环境因子的响应[J]. 植物生态学报, 2024, 48(9): 1128-1142. |
| [9] | 王袼, 胡姝娅, 李阳, 陈晓鹏, 李红玉, 董宽虎, 何念鹏, 王常慧. 不同类型草原土壤净氮矿化速率的温度敏感性[J]. 植物生态学报, 2024, 48(4): 523-533. |
| [10] | 盘远方, 潘良浩, 邱思婷, 邱广龙, 苏治南, 史小芳, 范航清. 中国沿海红树林树高变异与环境适应机制[J]. 植物生态学报, 2024, 48(4): 483-495. |
| [11] | 王丽丽, 宋晓彤, 谷际岐, 邵小明. 西藏尖叶对齿藓形态特征与环境变化的关系及响应策略[J]. 植物生态学报, 2024, 48(10): 1351-1360. |
| [12] | 赵孟娟, 金光泽, 刘志理. 阔叶红松林3种典型蕨类叶功能性状的垂直变异[J]. 植物生态学报, 2023, 47(8): 1131-1143. |
| [13] | 李安艳, 黄先飞, 田源斌, 董继兴, 郑菲菲, 夏品华. 贵州草海草-藻型稳态转换过程中叶绿素a的变化及其影响因子[J]. 植物生态学报, 2023, 47(8): 1171-1181. |
| [14] | 代景忠, 白玉婷, 卫智军, 张楚, 辛晓平, 闫玉春, 闫瑞瑞. 羊草功能性状对施肥的动态响应[J]. 植物生态学报, 2023, 47(7): 943-953. |
| [15] | 杨丽琳, 邢万秋, 王卫光, 曹明珠. 新安江源区杉木树干液流速率变化及其对环境因子的响应[J]. 植物生态学报, 2023, 47(4): 571-583. |
| 阅读次数 | ||||||
|
全文 |
|
|||||
|
摘要 |
|
|||||
Copyright © 2026 版权所有 《植物生态学报》编辑部
地址: 北京香山南辛村20号, 邮编: 100093
Tel.: 010-62836134, 62836138; Fax: 010-82599431; E-mail: apes@ibcas.ac.cn, cjpe@ibcas.ac.cn
备案号: 京ICP备16067583号-19

