
植物生态学报 ›› 2025, Vol. 49 ›› Issue (2): 356-366.DOI: 10.17521/cjpe.2024.0042 cstr: 32100.14.cjpe.2024.0042
• 研究论文 • 上一篇
陈文义1,2, 王智勇1,2, 周梦岩1, 麻文俊1, 王军辉1, 罗志斌1,3,4, 周婧1,*( )
)
收稿日期:2024-02-07
接受日期:2024-08-23
出版日期:2025-02-20
发布日期:2025-02-20
通讯作者:
*周婧: (gaha2008@126.com)基金资助:
CHEN Wen-Yi1,2, WANG Zhi-Yong1,2, ZHOU Meng-Yan1, MA Wen-Jun1, WANG Jun-Hui1, LUO Zhi-Bin1,3,4, ZHOU Jing1,*()
Received:2024-02-07
Accepted:2024-08-23
Online:2025-02-20
Published:2025-02-20
Supported by:摘要:
为了探究幼龄楸树(Catalpa bungei)主干、枝条、叶、粗根、细根、整株、地上部分和地下部分各组分生物量分配规律并建立相应的异速生长模型, 在3个相邻省份4个取样点的3-8年幼龄期楸树人工林中, 选取41株胸径(D)范围为3.2-24.8 cm的样木, 采用全称质量法测量楸树各组分生物量并分析其分配规律。分别以D、树高(H)及其复合形式D2H为预测变量, 利用简单幂函数的形式, 构建楸树主干、枝条、叶、粗根、细根、整株、地上部分和地下部分的生物量模型并验证其准确性。幼龄期楸树各组分生物量存在明显异速生长关系。地上部分生物量平均占比为80.54%, 其中主干生物量平均占比为49.29%, 远高于地下部分, 而细根生物量仅占整株的0.29%。在D ≤ 10 cm时, 随D增大, 枝条生物量占比逐渐增大, 而粗根生物量占比减小, 导致地上和地下生物量差距增大; 10 cm < D < 25 cm时, 各组分生物量占比变化放缓。在构建的各组分生物量模型中, 3个预测变量预测精度排序为D > D2H > H, 以D为单一预测变量拟合的主干、枝条、叶、粗根、整株、地上部分和地下部分异速生长模型精度较高, 以D2H为预测变量拟合的细根异速生长模型精度较高; 以不同径级楸树进行抽样, 验证模型准确性的结果显示, 各组分最优预测变量所构建的异速生长模型估测准确度高。幼龄期楸树各组分生物量平均占比顺序为: 主干>枝条>粗根>叶>细根; 随着楸树D增大, 地上部分生物量分配比例呈上升趋势。综合评估异速生长模型的拟合效果可知, D是预测楸树除细根外其他各组分生物量的最可靠变量, D2H是估算细根生物量的可靠变量。利用构建的异速生长模型可预测幼龄楸树的生长规律, 为选育优良楸树无性系提供重要参考。
陈文义, 王智勇, 周梦岩, 麻文俊, 王军辉, 罗志斌, 周婧. 幼龄楸树生物量分配规律与异速生长模型. 植物生态学报, 2025, 49(2): 356-366. DOI: 10.17521/cjpe.2024.0042
CHEN Wen-Yi, WANG Zhi-Yong, ZHOU Meng-Yan, MA Wen-Jun, WANG Jun-Hui, LUO Zhi-Bin, ZHOU Jing. Biomass allocation and allometric growth model of young Catalpa bungei. Chinese Journal of Plant Ecology, 2025, 49(2): 356-366. DOI: 10.17521/cjpe.2024.0042
| 样地 Sample site | 株数 Number of plants | 胸径 D (cm) | 年龄 Age (a) | 造林密度 Afforestation density (ind.·hm-2) | 年降水量 Mean annual precipitation (mm) | 年平均气温 Mean annual air temperature (℃) | 土壤类型 Soil type | ||||
|---|---|---|---|---|---|---|---|---|---|---|---|
| 0-5 | 5-10 | 10-15 | 15-20 | 20-25 | |||||||
| 山东菏泽 Heze, Shandong | 9 | 1 | 2 | 2 | 3 | 1 | 5 | 833 | 782.6 ± 69.5 | 15.58 ± 0.05 | 冲积土 Fluvisol |
| 河南永城 Yongcheng, Henan | 8 | 1 | 2 | 3 | 2 | 0 | 4 | 833 | 888.1 ± 72.6 | 16.67 ± 0.11 | 冲积土 Fluvisol |
| 湖北襄阳 Xiangyang, Hubei | 12 | 1 | 3 | 3 | 2 | 3 | 5 | 833 | 908.6 ± 100.4 | 16.40 ± 0.09 | 始成土 Inceptisol |
| 湖北石首 Shishou, Hubei | 12 | 2 | 2 | 3 | 2 | 3 | 3, 8 | 833 | 1 222.8 ± 77.8 | 17.77 ± 0.13 | 淋溶土 Alfisol |
| 总计 Total | 41 | 5 | 9 | 11 | 9 | 7 | - | - | - | - | - |
| 建模组 Modeling group | 28 | 3 | 7 | 7 | 6 | 5 | - | - | - | - | - |
| 验证组 Testing group | 13 | 2 | 2 | 4 | 3 | 2 | - | - | - | - | - |
表1 不同胸径等级楸树样本量以及样地环境条件
Table 1 Sample size of Catalpa bungei with different D grades and environmental conditions of the sample sites
| 样地 Sample site | 株数 Number of plants | 胸径 D (cm) | 年龄 Age (a) | 造林密度 Afforestation density (ind.·hm-2) | 年降水量 Mean annual precipitation (mm) | 年平均气温 Mean annual air temperature (℃) | 土壤类型 Soil type | ||||
|---|---|---|---|---|---|---|---|---|---|---|---|
| 0-5 | 5-10 | 10-15 | 15-20 | 20-25 | |||||||
| 山东菏泽 Heze, Shandong | 9 | 1 | 2 | 2 | 3 | 1 | 5 | 833 | 782.6 ± 69.5 | 15.58 ± 0.05 | 冲积土 Fluvisol |
| 河南永城 Yongcheng, Henan | 8 | 1 | 2 | 3 | 2 | 0 | 4 | 833 | 888.1 ± 72.6 | 16.67 ± 0.11 | 冲积土 Fluvisol |
| 湖北襄阳 Xiangyang, Hubei | 12 | 1 | 3 | 3 | 2 | 3 | 5 | 833 | 908.6 ± 100.4 | 16.40 ± 0.09 | 始成土 Inceptisol |
| 湖北石首 Shishou, Hubei | 12 | 2 | 2 | 3 | 2 | 3 | 3, 8 | 833 | 1 222.8 ± 77.8 | 17.77 ± 0.13 | 淋溶土 Alfisol |
| 总计 Total | 41 | 5 | 9 | 11 | 9 | 7 | - | - | - | - | - |
| 建模组 Modeling group | 28 | 3 | 7 | 7 | 6 | 5 | - | - | - | - | - |
| 验证组 Testing group | 13 | 2 | 2 | 4 | 3 | 2 | - | - | - | - | - |
| 胸径 D (cm) | 主干 Trunk (kg·plant-1) | 枝条 Branch (kg·plant-1) | 叶 Leaf (kg·plant-1) | 粗根 Coarse root (kg·plant-1) | 细根 Fine root (kg·plant-1) | |||||
|---|---|---|---|---|---|---|---|---|---|---|
| 范围 Range | 平均值 Mean | 范围 Range | 平均值 Mean | 范围 Range | 平均值 Mean | 范围 Range | 平均值 Mean | 范围 Range | 平均值 Mean | |
| 0-5 | 0.83-6.56 | 2.52Ad | 0.15-5.46 | 1.55ABc | 0.11-0.55 | 0.27Bd | 0.51-3.21 | 1.39ABd | 0.01-0.04 | 0.02Bc |
| 5-10 | 3.47-17.30 | 8.35Ad | 1.12-6.15 | 3.23Bc | 0.28-3.41 | 1.30BCcd | 1.63-10.95 | 3.71Bcd | 0.01-0.07 | 0.05Cc |
| 10-15 | 14.45-37.18 | 26.49Ac | 7.33-20.09 | 13.04Bc | 1.29-6.92 | 4.06Dbc | 4.75-14.74 | 8.60Cc | 0.04-0.15 | 0.11Ec |
| 15-20 | 41.87-73.16 | 55.63Ab | 16.95-76.11 | 32.92Bb | 1.79-16.09 | 7.21CDab | 8.40-25.44 | 16.52Cb | 0.10-0.27 | 0.19Db |
| 20-25 | 53.91-116.49 | 89.22Aa | 35.50-73.64 | 56.43Ba | 2.87-19.19 | 9.61Da | 19.78-42.27 | 31.02Ca | 0.13-0.56 | 0.30Da |
表2 不同径级楸树主干、枝条、叶、粗根、细根生物量
Table 2 Biomass of trunk, branch, leaf, coarse root and fine root of different diameter classes of Catalpa bungei
| 胸径 D (cm) | 主干 Trunk (kg·plant-1) | 枝条 Branch (kg·plant-1) | 叶 Leaf (kg·plant-1) | 粗根 Coarse root (kg·plant-1) | 细根 Fine root (kg·plant-1) | |||||
|---|---|---|---|---|---|---|---|---|---|---|
| 范围 Range | 平均值 Mean | 范围 Range | 平均值 Mean | 范围 Range | 平均值 Mean | 范围 Range | 平均值 Mean | 范围 Range | 平均值 Mean | |
| 0-5 | 0.83-6.56 | 2.52Ad | 0.15-5.46 | 1.55ABc | 0.11-0.55 | 0.27Bd | 0.51-3.21 | 1.39ABd | 0.01-0.04 | 0.02Bc |
| 5-10 | 3.47-17.30 | 8.35Ad | 1.12-6.15 | 3.23Bc | 0.28-3.41 | 1.30BCcd | 1.63-10.95 | 3.71Bcd | 0.01-0.07 | 0.05Cc |
| 10-15 | 14.45-37.18 | 26.49Ac | 7.33-20.09 | 13.04Bc | 1.29-6.92 | 4.06Dbc | 4.75-14.74 | 8.60Cc | 0.04-0.15 | 0.11Ec |
| 15-20 | 41.87-73.16 | 55.63Ab | 16.95-76.11 | 32.92Bb | 1.79-16.09 | 7.21CDab | 8.40-25.44 | 16.52Cb | 0.10-0.27 | 0.19Db |
| 20-25 | 53.91-116.49 | 89.22Aa | 35.50-73.64 | 56.43Ba | 2.87-19.19 | 9.61Da | 19.78-42.27 | 31.02Ca | 0.13-0.56 | 0.30Da |
| 胸径 D (cm) | 整株 Total tree (kg·plant -1) | 地上 Aboveground (kg·plant -1) | 地下 Belowground (kg·plant-1) | 根冠比 Root to shoot ratio | ||||
|---|---|---|---|---|---|---|---|---|
| 范围 Range | 平均值 Mean | 范围 Range | 平均值 Mean | 范围 Range | 平均值 Mean | 范围 Range | 平均值 Mean | |
| 0-5 | 1.69-15.79 | 5.76 | 1.17-12.57 | 4.34 | 0.52-3.22 | 1.42 | 0.26-0.64 | 0.42a |
| 5-10 | 7.61-34.82 | 16.63 | 4.87-23.82 | 12.87 | 1.63-11.00 | 3.76 | 0.15-0.56 | 0.32a |
| 10-15 | 35.13-68.06 | 52.29 | 28.74-55.48 | 43.58 | 4.79-14.90 | 8.71 | 0.14-0.28 | 0.20b |
| 15-20 | 77.64-180.77 | 112.47 | 62.55-111.58 | 95.76 | 8.63-25.68 | 16.71 | 0.08-0.24 | 0.18b |
| 20-25 | 129.19-248.95 | 186.59 | 101.02-209.32 | 155.27 | 20.08-42.40 | 31.32 | 0.15-0.28 | 0.20b |
表3 不同径级楸树整株、地上部分和地下部分生物量
Table 3 Biomass of total tree, above- and below-ground parts of different diameter classes of Catalpa bungei
| 胸径 D (cm) | 整株 Total tree (kg·plant -1) | 地上 Aboveground (kg·plant -1) | 地下 Belowground (kg·plant-1) | 根冠比 Root to shoot ratio | ||||
|---|---|---|---|---|---|---|---|---|
| 范围 Range | 平均值 Mean | 范围 Range | 平均值 Mean | 范围 Range | 平均值 Mean | 范围 Range | 平均值 Mean | |
| 0-5 | 1.69-15.79 | 5.76 | 1.17-12.57 | 4.34 | 0.52-3.22 | 1.42 | 0.26-0.64 | 0.42a |
| 5-10 | 7.61-34.82 | 16.63 | 4.87-23.82 | 12.87 | 1.63-11.00 | 3.76 | 0.15-0.56 | 0.32a |
| 10-15 | 35.13-68.06 | 52.29 | 28.74-55.48 | 43.58 | 4.79-14.90 | 8.71 | 0.14-0.28 | 0.20b |
| 15-20 | 77.64-180.77 | 112.47 | 62.55-111.58 | 95.76 | 8.63-25.68 | 16.71 | 0.08-0.24 | 0.18b |
| 20-25 | 129.19-248.95 | 186.59 | 101.02-209.32 | 155.27 | 20.08-42.40 | 31.32 | 0.15-0.28 | 0.20b |
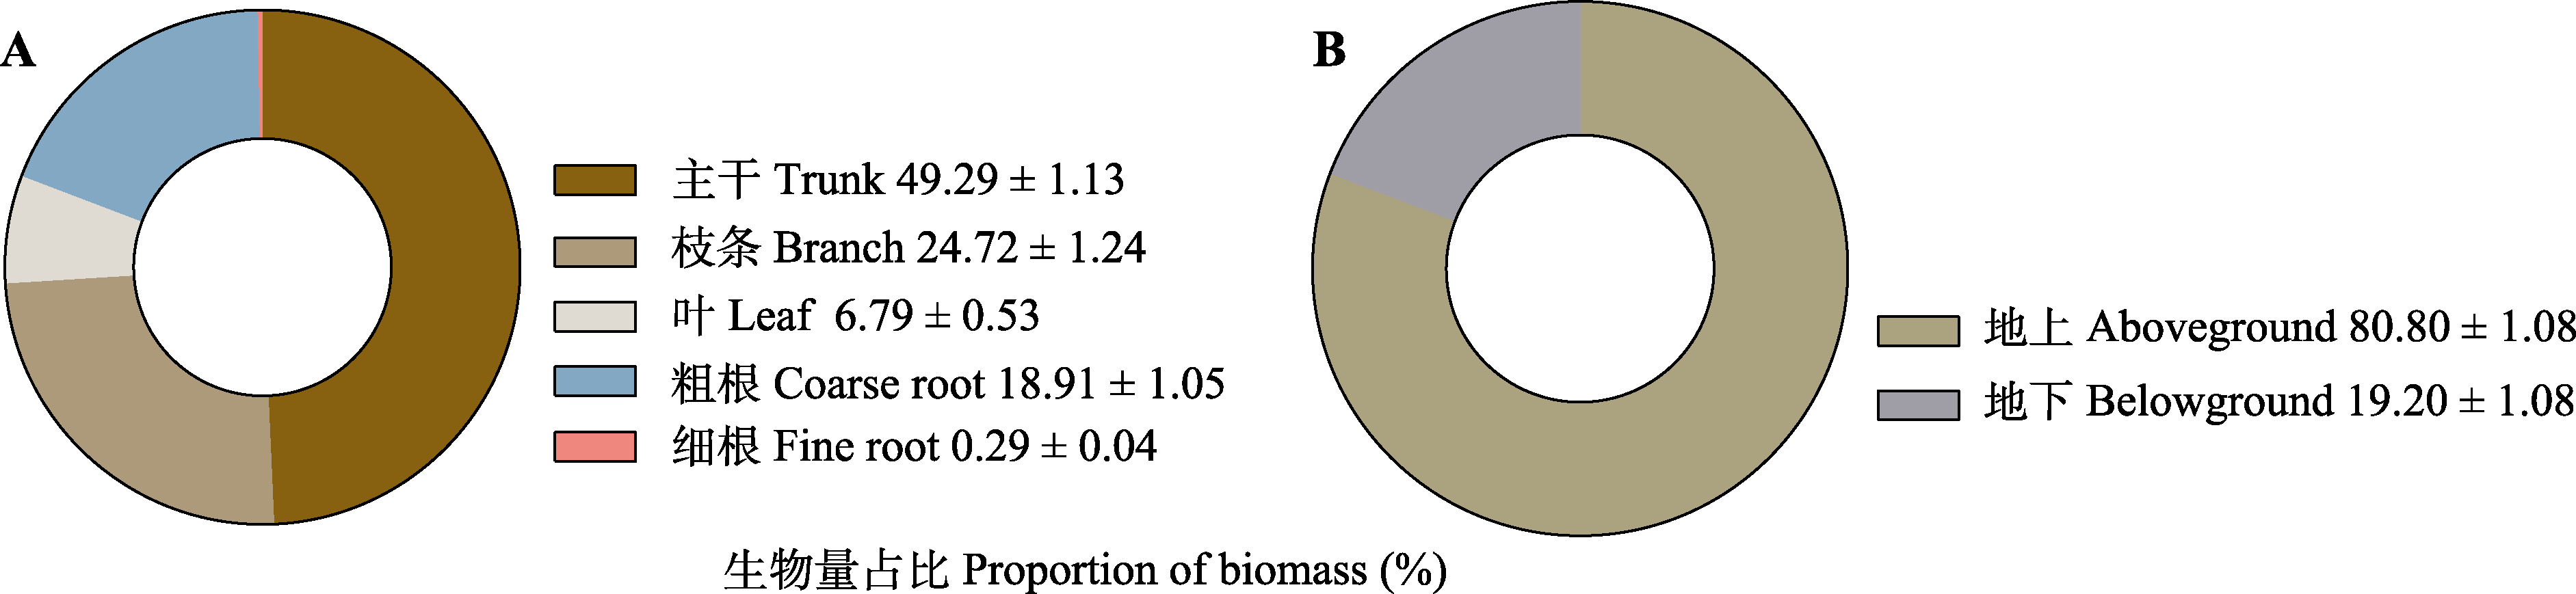
图1 楸树各组分生物量占比平均值。图例中标出了具体计算结果, 格式为平均值±标准误。
Fig. 1 Average biomass proportion of various components of Catalpa bungei. The results (mean ± SE) are highlighted in the legend.
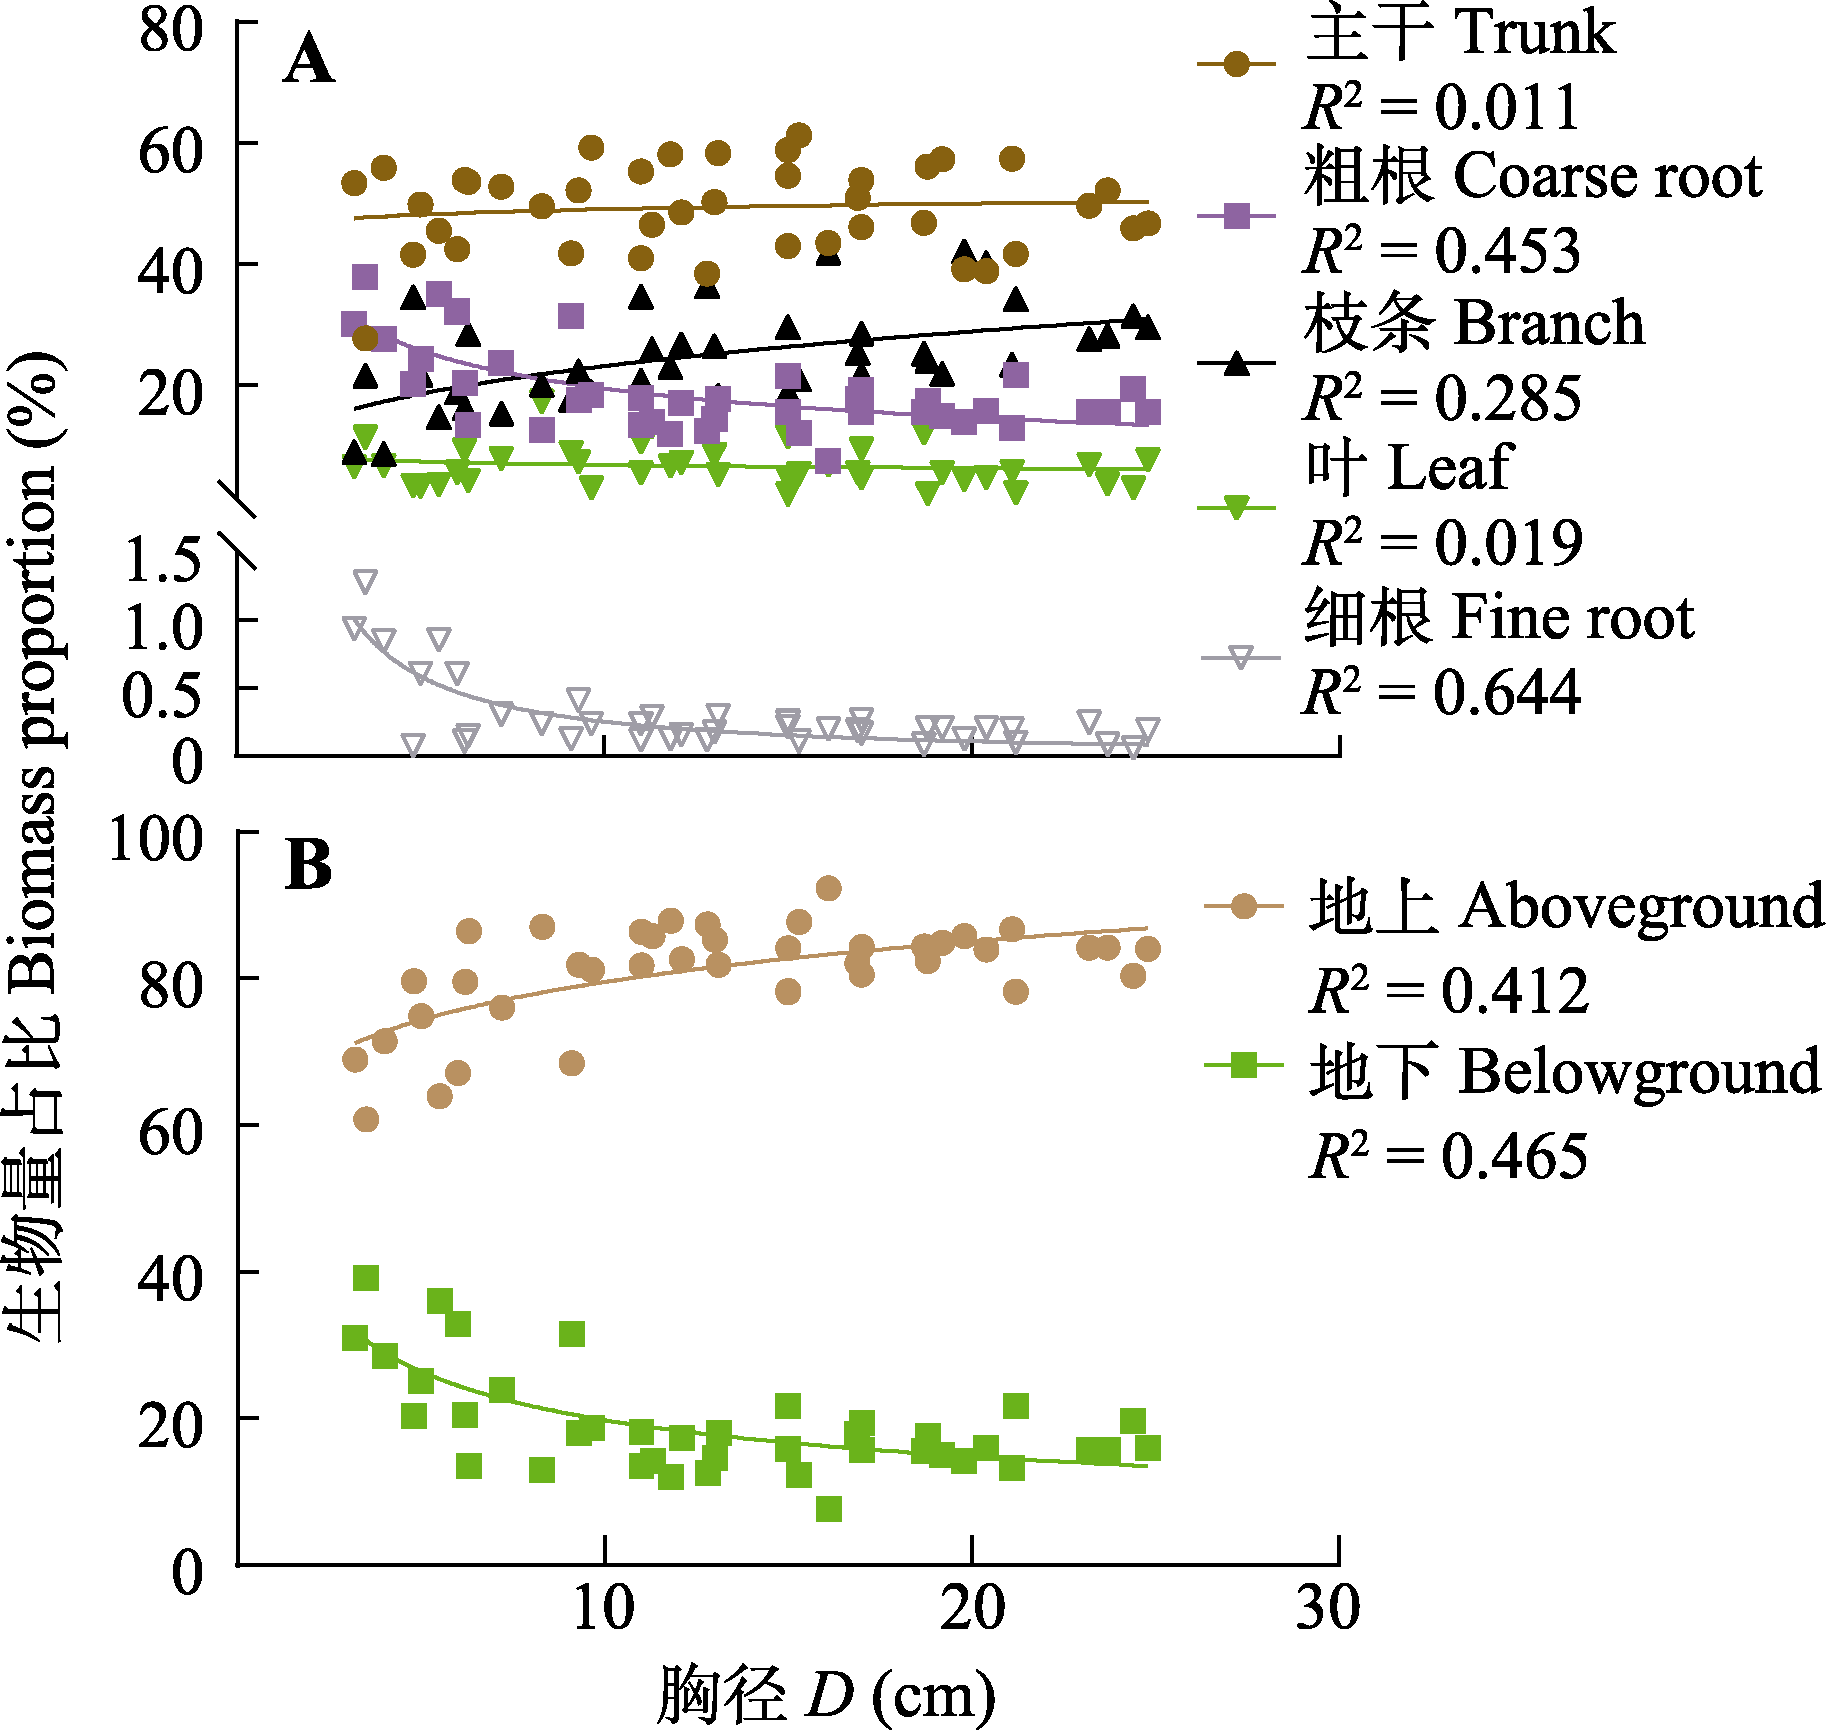
图2 幼龄楸树不同组分生物量比例随胸径的变化。
Fig. 2 Changes of biomass proportion of various components of young Catalpa bungei with increasing diameter at breast height (D).
| 组分生物量 Component biomass | 降水量 Precipitation | 气温 Air temperature | 年龄 Age |
|---|---|---|---|
| 整株 Total tree | -0.029 | -0.110 | 0.496** |
| 地上部分 Aboveground | -0.054 | -0.129 | 0.487** |
| 地下部分 Belowground | 0.043 | -0.071 | 0.566** |
| 主干 Trunk | -0.015 | -0.115 | 0.507** |
| 枝条 Branch | -0.085 | -0.126 | 0.427** |
| 叶 Leaf | -0.215 | -0.157 | 0.141 |
| 粗根 Coarse root | 0.048 | -0.066 | 0.562** |
| 细根 Fine root | 0.054 | -0.110 | 0.481** |
表4 生物量与降水量、气温及楸树年龄间相关系数
Table 4 Correlation coefficient between component biomass of Catalpa bungei., precipitation, air temperature and the tree age
| 组分生物量 Component biomass | 降水量 Precipitation | 气温 Air temperature | 年龄 Age |
|---|---|---|---|
| 整株 Total tree | -0.029 | -0.110 | 0.496** |
| 地上部分 Aboveground | -0.054 | -0.129 | 0.487** |
| 地下部分 Belowground | 0.043 | -0.071 | 0.566** |
| 主干 Trunk | -0.015 | -0.115 | 0.507** |
| 枝条 Branch | -0.085 | -0.126 | 0.427** |
| 叶 Leaf | -0.215 | -0.157 | 0.141 |
| 粗根 Coarse root | 0.048 | -0.066 | 0.562** |
| 细根 Fine root | 0.054 | -0.110 | 0.481** |
| 组分生物量 Component biomass | 回归模型 Regression model | a | b | R2 | RMSE | AICc |
|---|---|---|---|---|---|---|
| 主干 Trunk | ln W = a + bln D | -2.521 | 2.257 | 0.949 3 | 0.296 8 | -62.04 |
| ln W = a + b ln H | -3.978 | 3.400 | 0.748 9 | 0.660 2 | -17.27 | |
| ln W = a + b ln (D2H) | -3.123 | 0.881 | 0.935 2 | 0.335 3 | -55.21 | |
| 枝条 Branch | ln W = a + bln D | -4.439 | 2.716 | 0.902 7 | 0.507 4 | -32.01 |
| ln W = a + b ln H | -5.898 | 3.948 | 0.663 0 | 0.944 1 | 2.76 | |
| ln W = a + bln (D2H) | -5.113 | 1.053 | 0.876 9 | 0.570 6 | -25.44 | |
| 叶 Leaf | ln W = a + bln D | -4.502 | 2.203 | 0.839 2 | 0.548 6 | -27.64 |
| ln W = a + bln H | -5.761 | 3.239 | 0.630 6 | 0.831 5 | -4.35 | |
| ln W = a + bln (D2H) | -5.061 | 0.856 | 0.818 8 | 0.582 4 | -24.29 | |
| 粗根 Coarse root | ln W = a + bln D | -2.629 | 1.894 | 0.903 0 | 0.353 2 | -52.30 |
| ln W = a + bln H | -3.895 | 2.875 | 0.722 8 | 0.597 2 | -22.89 | |
| ln W = a + bln (D2H) | -3.146 | 0.741 | 0.893 6 | 0.369 9 | -49.72 | |
| 细根 Fine root | ln W = a + bln D | -6.298 | 1.565 | 0.777 4 | 0.476 6 | -35.52 |
| ln W = a + bln H | -7.786 | 2.591 | 0.740 3 | 0.514 8 | -31.21 | |
| ln W = a + bln (D2H) | -6.805 | 0.624 | 0.798 4 | 0.453 5 | -38.30 | |
| 整株 Total tree | ln W = a + bln D | -1.836 | 2.264 | 0.946 0 | 0.307 8 | -60.00 |
| ln W = a + bln H | -3.203 | 3.364 | 0.726 3 | 0.692 7 | -14.58 | |
| ln W = a + bln (D2H) | -2.424 | 0.882 | 0.927 1 | 0.357 5 | -51.62 | |
| 地上 Aboveground | ln W = a + bln D | -2.313 | 2.368 | 0.943 6 | 0.329 2 | -56.23 |
| ln W = a + bln H | -3.715 | 3.505 | 0.718 8 | 0.735 2 | -11.24 | |
| ln W = a + bln (D2H) | -2.923 | 0.921 | 0.923 1 | 0.384 4 | -47.56 | |
| 地下 Belowground | ln W = a + bln D | -2.602 | 1.889 | 0.903 8 | 0.350 6 | -52.70 |
| ln W = a + bln H | -3.863 | 2.866 | 0.723 4 | 0.594 5 | -23.14 | |
| ln W = a + bln (D2H) | -3.117 | 0.739 | 0.894 4 | 0.367 3 | -50.11 |
表5 楸树整株及各组分的异速生长模型
Table 5 Allometric growth models of whole Catalpa bungei and each component
| 组分生物量 Component biomass | 回归模型 Regression model | a | b | R2 | RMSE | AICc |
|---|---|---|---|---|---|---|
| 主干 Trunk | ln W = a + bln D | -2.521 | 2.257 | 0.949 3 | 0.296 8 | -62.04 |
| ln W = a + b ln H | -3.978 | 3.400 | 0.748 9 | 0.660 2 | -17.27 | |
| ln W = a + b ln (D2H) | -3.123 | 0.881 | 0.935 2 | 0.335 3 | -55.21 | |
| 枝条 Branch | ln W = a + bln D | -4.439 | 2.716 | 0.902 7 | 0.507 4 | -32.01 |
| ln W = a + b ln H | -5.898 | 3.948 | 0.663 0 | 0.944 1 | 2.76 | |
| ln W = a + bln (D2H) | -5.113 | 1.053 | 0.876 9 | 0.570 6 | -25.44 | |
| 叶 Leaf | ln W = a + bln D | -4.502 | 2.203 | 0.839 2 | 0.548 6 | -27.64 |
| ln W = a + bln H | -5.761 | 3.239 | 0.630 6 | 0.831 5 | -4.35 | |
| ln W = a + bln (D2H) | -5.061 | 0.856 | 0.818 8 | 0.582 4 | -24.29 | |
| 粗根 Coarse root | ln W = a + bln D | -2.629 | 1.894 | 0.903 0 | 0.353 2 | -52.30 |
| ln W = a + bln H | -3.895 | 2.875 | 0.722 8 | 0.597 2 | -22.89 | |
| ln W = a + bln (D2H) | -3.146 | 0.741 | 0.893 6 | 0.369 9 | -49.72 | |
| 细根 Fine root | ln W = a + bln D | -6.298 | 1.565 | 0.777 4 | 0.476 6 | -35.52 |
| ln W = a + bln H | -7.786 | 2.591 | 0.740 3 | 0.514 8 | -31.21 | |
| ln W = a + bln (D2H) | -6.805 | 0.624 | 0.798 4 | 0.453 5 | -38.30 | |
| 整株 Total tree | ln W = a + bln D | -1.836 | 2.264 | 0.946 0 | 0.307 8 | -60.00 |
| ln W = a + bln H | -3.203 | 3.364 | 0.726 3 | 0.692 7 | -14.58 | |
| ln W = a + bln (D2H) | -2.424 | 0.882 | 0.927 1 | 0.357 5 | -51.62 | |
| 地上 Aboveground | ln W = a + bln D | -2.313 | 2.368 | 0.943 6 | 0.329 2 | -56.23 |
| ln W = a + bln H | -3.715 | 3.505 | 0.718 8 | 0.735 2 | -11.24 | |
| ln W = a + bln (D2H) | -2.923 | 0.921 | 0.923 1 | 0.384 4 | -47.56 | |
| 地下 Belowground | ln W = a + bln D | -2.602 | 1.889 | 0.903 8 | 0.350 6 | -52.70 |
| ln W = a + bln H | -3.863 | 2.866 | 0.723 4 | 0.594 5 | -23.14 | |
| ln W = a + bln (D2H) | -3.117 | 0.739 | 0.894 4 | 0.367 3 | -50.11 |
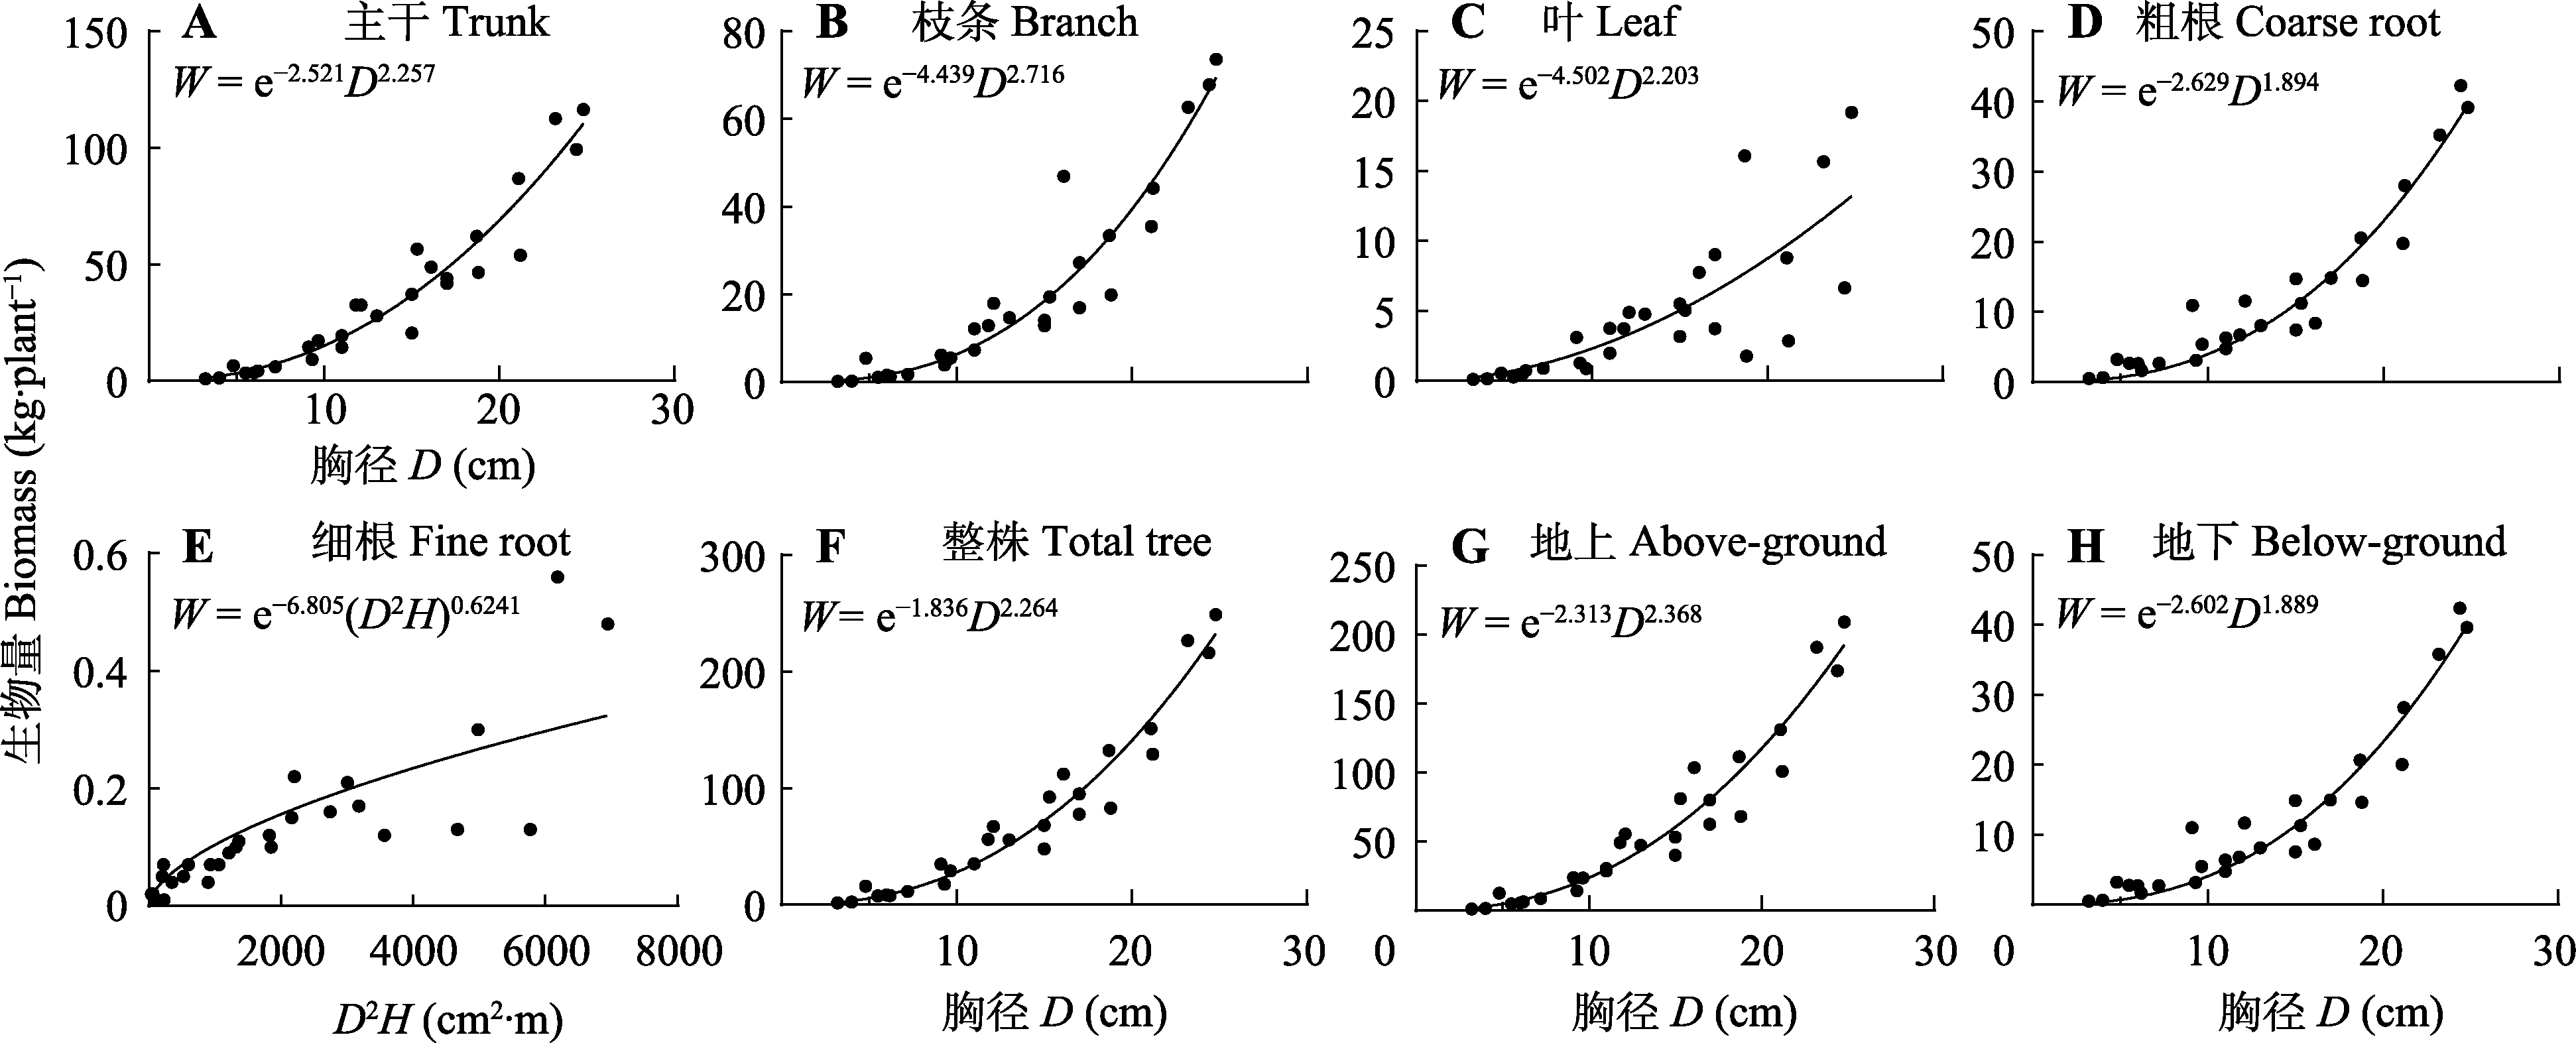
图3 幼龄楸树的最优异速生长模型。D, 胸径; H, 树高; W, 生物量。
Fig. 3 Optimal allometric growth model for young Catalpa bungei. D, diameter at breast height; H, tree height; W, biomass.
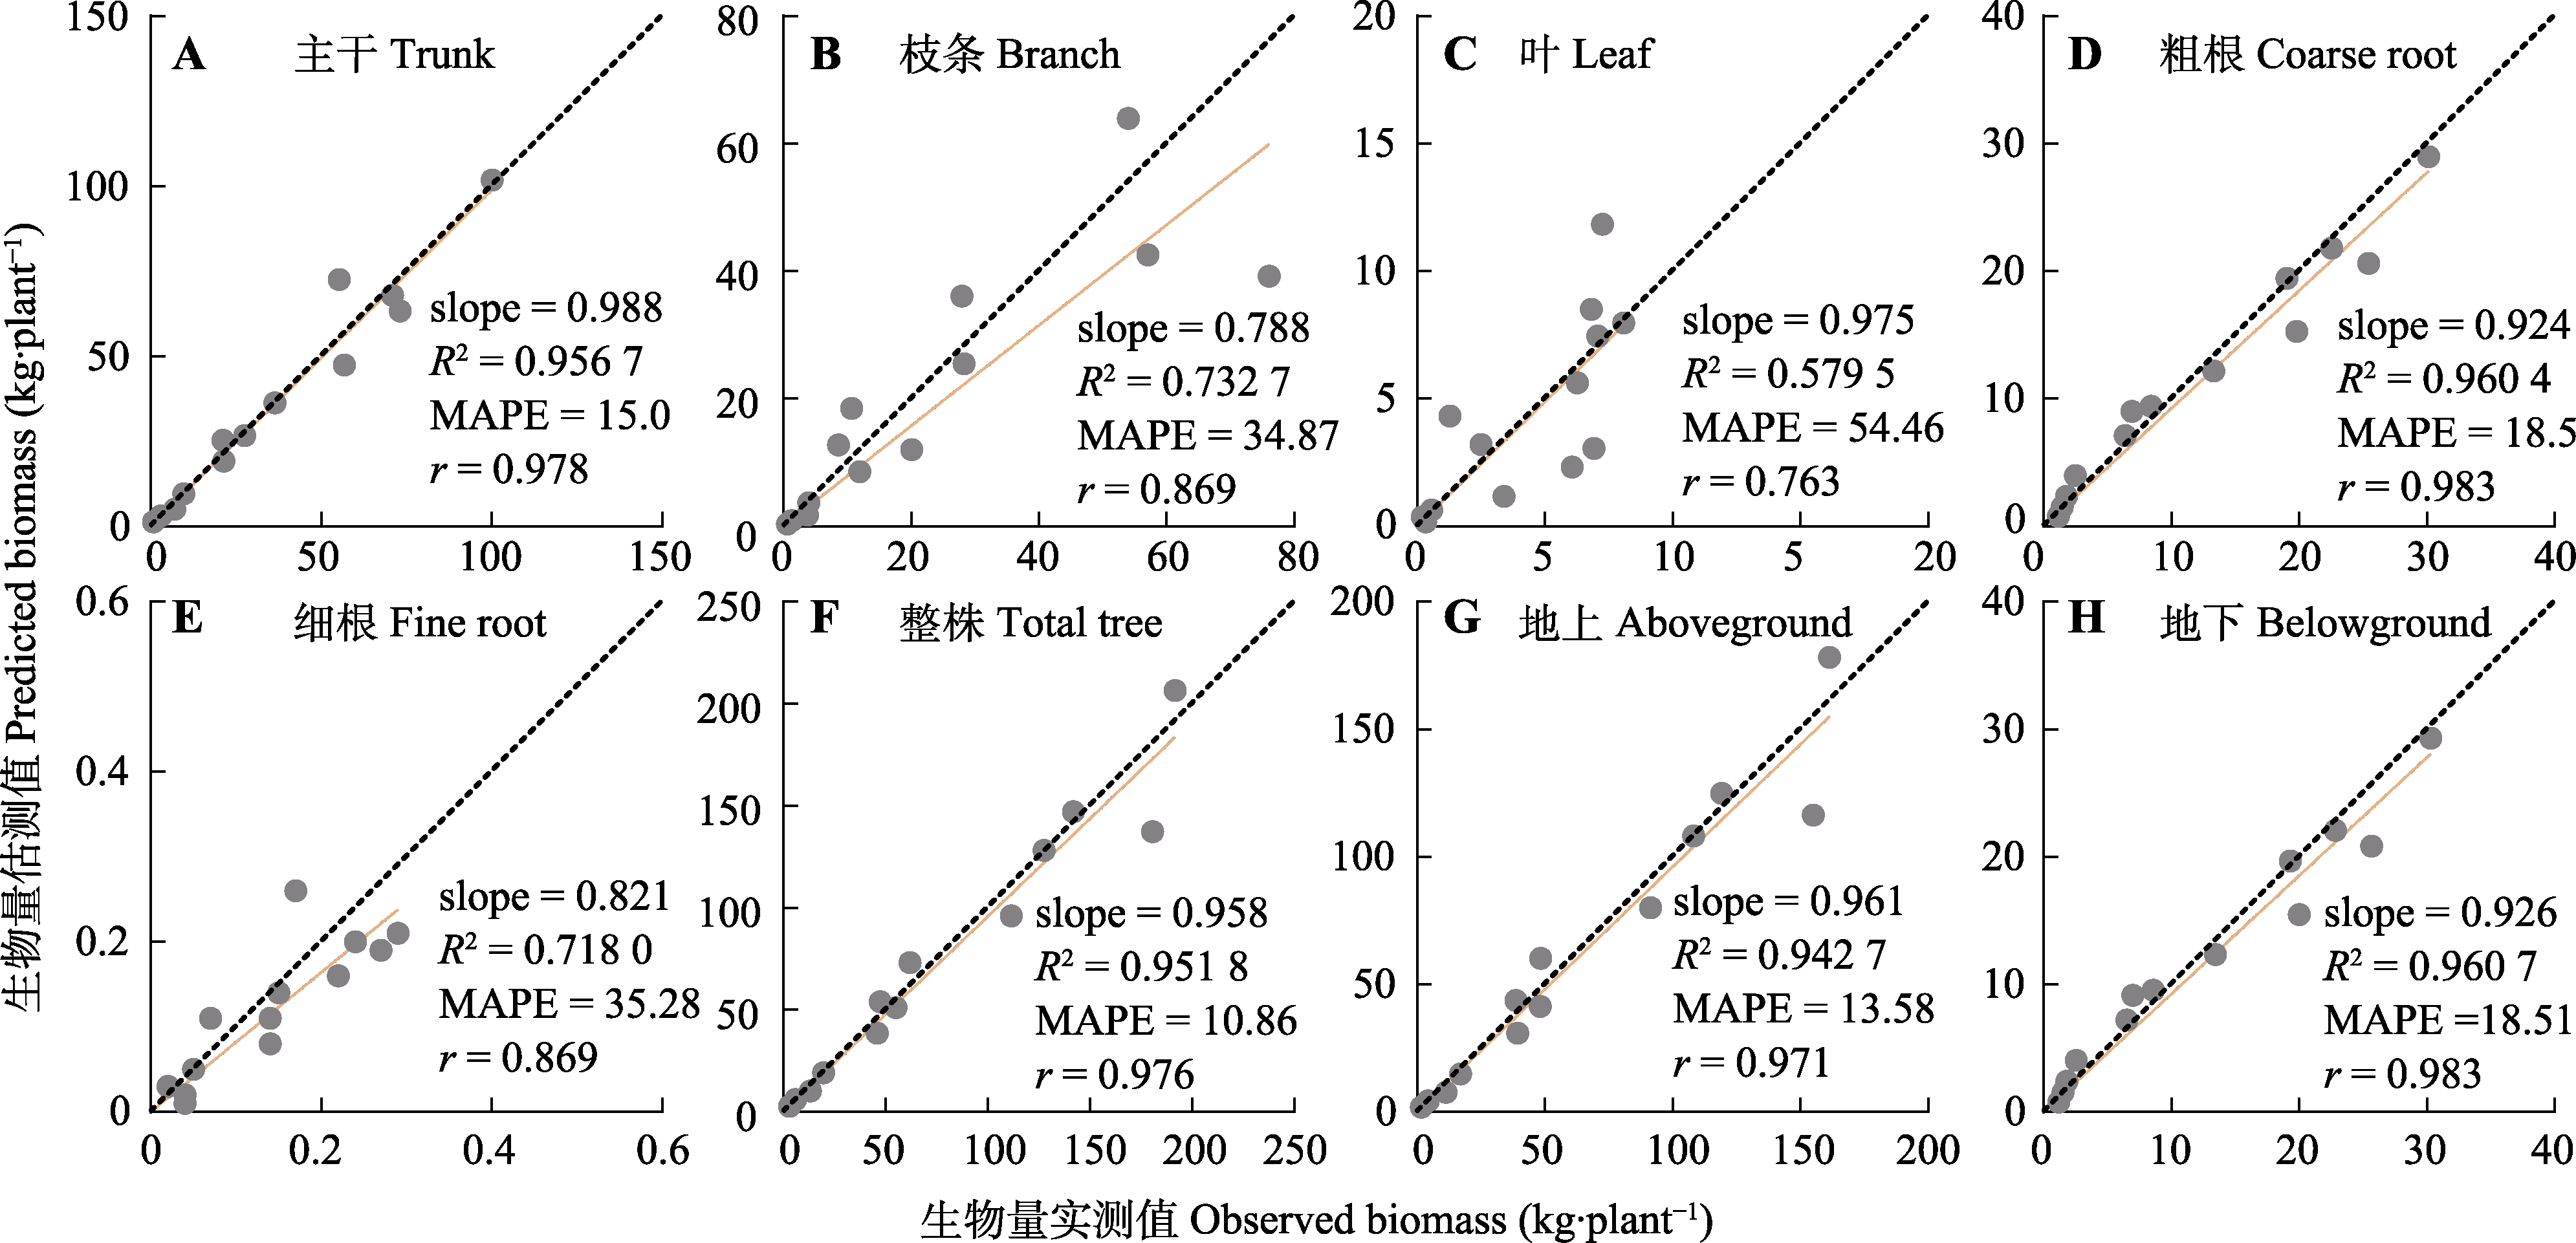
图4 最优异速生长模型估测值与实测值的关系。图中实线为估测值与实测值线性拟合的结果, slope为拟合直线的斜率; 黑色虚线表示1:1的关系。MAPE, 平均绝对百分比误差。
Fig. 4 Relationships between the biomass observed and predicted by the optimal growth models. The solid line in the figure is the result of linear fitting between the predicted value and the observed value; slope, the slope of the fitted line. The black dashed line indicates a 1:1 relationship. MAPE, mean absolute percentage error.
| [1] | Ammer C, Wagner S (2005). An approach for modelling the mean fine-root biomass of Norway spruce stands. Trees, 19, 145-153. |
| [2] | Aneseyee AB, Soromessa T, Elias E, Feyisa GL (2021). Allometric equations for selected Acacia species (Vachellia and Senegalia genera) of Ethiopia. Carbon Balance and Management, 16, 34. DOI: 10.1186/s13021-021-00196-1. |
| [3] |
Bowman DMJS, Brienen RJW, Gloor E, Phillips OL, Prior LD (2013). Detecting trends in tree growth: not so simple. Trends in Plant Science, 18, 11-17.
DOI PMID |
| [4] | Chang L, Liu K, Wang LG, Yang XL, Sun H (2022). First report of Phytophthora nicotianae causing stem canker of Catalpa bungei (Chinese Catalpa) in China. Plant Disease, 106, 1309. DOI: 10.1094/PDIS-08-21-1778-PDN. |
| [5] | Chen C, Ko SH, Lam TY (2021). Modeling biomass allocation strategy of young planted Zelkova serrata trees in Taiwan with component ratio method and seemingly unrelated regressions. Scientific Reports, 11, 7536. DOI: 10.1038/ s41598-021-87129-7. |
| [6] | Chen JL, Fang X, Wu AC, Xiang WH, Lei PF, Ouyang S (2024). Allometric equations for estimating biomass of natural shrubs and young trees of subtropical forests. New Forests, 55, 15-46. |
| [7] | Chen Q (2015). Modeling aboveground tree woody biomass using national-scale allometric methods and airborne lidar. ISPRS Journal of Photogrammetry and Remote Sensing, 106, 95-106. |
| [8] | Chen W, Zhang Q, Cihlar J, Bauhus J, Price DT (2004). Estimating fine-root biomass and production of boreal and cool temperate forests using aboveground measurements: a new approach. Plant and Soil, 265, 31-46. |
| [9] | Chen XY, Wang YJ, Li HW, Zhai BQ, Chang J, Wei HM (2021). Preliminary report of demonstration forest test of improved seed of Catalpa bungei. Journal of Henan Forestry Science and Technology, 41(3), 19-21. |
| [陈晓燕, 王燕军, 李红伟, 翟宝黔, 常娟, 魏洪敏 (2021). 楸树良种示范林试验初报. 河南林业科技, 41(3), 19-21.] | |
| [10] | Chojnacky DC, Heath LS, Jenkins JC (2014). Updated generalized biomass equations for North American tree species. Forestry, 87, 129-151. |
| [11] | Dong LH, Zhang LJ, Li FR (2015). Developing additive systems of biomass equations for nine hardwood species in Northeast China. Trees, 29, 1149-1163. |
| [12] |
Dybzinski R, Farrior C, Wolf A, Reich PB, Pacala SW (2011). Evolutionarily stable strategy carbon allocation to foliage, wood, and fine roots in trees competing for light and nitrogen: an analytically tractable, individual-based model and quantitative comparisons to data. The American Naturalist, 177, 153-166.
DOI PMID |
| [13] | Guan ZZ, Lin D, Chen D, Guo Y, Lu Y, Han Q, Li N, Su Y, Li J, Wang J, Ma W, Qiu Q, He Q (2022). Soil microbial communities response to different fertilization regimes in young Catalpa bungei plantation. Frontiers in Microbiology, 13, 948875. DOI: 10.3389/fmicb.2022.948875. |
| [14] | Han WX, Fang JY (2008). Review on the mechanism models of allometric scaling laws: 3/4 vs. 2/3 power. Chinese Journal of Plant Ecology, 32, 951-960. |
|
[韩文轩, 方精云 (2008). 幂指数异速生长机制模型综述. 植物生态学报, 32, 951-960.]
DOI |
|
| [15] | Holland R, Castro G, Chavana-Bryant C, Levy R, Moat J, Robson T, Wilkinson T, Wilkes P, Yang WX, Disney M (2024). Giant sequoia (Sequoiadendron giganteum) in the UK: carbon storage potential and growth rates. Royal Society Open Science, 11, 230603. DOI: 10.1098/rsos.230603. |
| [16] | Hossain M, Saha C, Abdullah SMR, Saha S, Siddique MRH (2016). Allometric biomass, nutrient and carbon stock models for Kandelia candel of the Sundarbans, Bangladesh. Trees, 30, 709-717. |
| [17] | Inagaki Y, Nakanishi A, Tange T (2020). A simple method for leaf and branch biomass estimation in Japanese cedar plantations. Trees, 34, 349-356. |
| [18] |
Ishihara MI, Utsugi H, Tanouchi H, Aiba M, Kurokawa H, Onoda Y, Nagano M, Umehara T, Ando M, Miyata R, Hiura T (2015). Efficacy of generic allometric equations for estimating biomass: a test in Japanese natural forests. Ecological Applications, 25, 1433-1446.
PMID |
| [19] | Jara MC, Henry M, Réjou-Méchain M, Wayson C, Zapata-Cuartas M, Piotto D, Guier FA, Lombis HC, López EC, Lara RC, Rojas KC, Pasquel JD, Montoya AD, Vega JF, Galo AJ, et al. (2015). Guidelines for documenting and reporting tree allometric equations. Annals of Forest Science, 72, 763-768. |
| [20] |
Jucker T, Caspersen J, Chave J, Antin C, Barbier N, Bongers F, Dalponte M, van Ewijk KY, Forrester DI, Haeni M, Higgins SI, Holdaway RJ, Iida Y, Lorimer C, Marshall PL, et al. (2017). Allometric equations for integrating remote sensing imagery into forest monitoring programmes. Global Change Biology, 23, 177-190.
DOI PMID |
| [21] | Kachamba DJ, Eid T, Gobakken T (2016). Above- and belowground biomass models for trees in the miombo woodlands of Malawi. Forests, 7, 38. DOI: 10.3390/f7020038. |
| [22] | Kaushal R, Islam S, Tewari S, Tomar JMS, Thapliyal S, Madhu M, Trinh TL, Singh T, Singh A, Durai J (2022). An allometric model-based approach for estimating biomass in seven Indian bamboo species in western Himalayan foothills, India. Scientific Reports, 12, 7527. DOI: 10.1038/s41598-022-11394-3. |
| [23] | Konôpka B, Murgaš V, Pajtík J, Šebeň V, Barka I (2023). Tree biomass and leaf area allometric relations for Betula pendula Roth based on samplings in the western carpathians. Plants, 12, 1607. DOI: 10.3390/plants12081607. |
| [24] | Li C, Barclay H, Roitberg B, Lalonde R (2020). Forest productivity enhancement and compensatory growth: a review and synthesis. Frontiers in Plant Science, 11, 575211. DOI: 10.3389/fpls.2020.575211. |
| [25] | Li W (2014). Biomass Allocation Patterns and Allometric Models of Larix gmelinii. Master degree dissertation, Northeast Forestry University, Harbin. 2-45. |
| [李巍 (2014). 兴安落叶松生物量分配格局和异速生长模型. 硕士学位论文, 东北林业大学, 哈尔滨. 2-45.] | |
| [26] | Lin KM, Lyu MK, Jiang MH, Chen YM, Li YQ, Chen GS, Xie JS, Yang YS (2017). Improved allometric equations for estimating biomass of the three Castanopsis carlesii H. forest types in subtropical China. New Forests, 48, 115-135. |
| [27] | Lister AJ, Andersen H, Frescino T, Gatziolis D, Healey S, Heath LS, Liknes GC, McRoberts R, Moisen GG, Nelson M, Riemann R, Schleeweis K, Schroeder TA, Westfall J, Wilson BT (2020). Use of remote sensing data to improve the efficiency of national forest inventories: a case study from the United States national forest inventory. Forests, 11, 1364. DOI: 10.3390/f11121364. |
| [28] | Ma WJ, Yi F, Xiao Y, Yang GJ, Chen FJ, Wang JH (2020). Isolation of leaf mesophyll protoplasts optimized by orthogonal design for transient gene expression in Catalpa bungei. Scientia Horticulturae, 274, 109684. DOI: 10.1016/j.scienta.2020.109684. |
| [29] | Meng SW, Zhou G, Liu WH, Yu J, Zhou H, Liu QJ (2024). Species-specific and generalized allometric equations for improving aboveground biomass estimations of 33 understory woody species in northeastern China forest ecosystems. Canadian Journal of Forest Research, 54, 524-542. |
| [30] | Mensah S, Kakaï RG, Seifert T (2016). Patterns of biomass allocation between foliage and woody structure: the effects of tree size and specific functional traits. Annals of Forest Research, 59, 49-60. |
| [31] | Moussa M, Mahamane L (2018). Allometric models for estimating aboveground biomass and carbon in Faidherbia albida and Prosopis africana under agroforestry parklands in drylands of Niger. Journal of Forestry Research, 29, 1703-1717. |
| [32] | Pan Y, Birdsey RA, Phillips OL, Jackson RB (2013). The structure, distribution, and biomass of the world’s forests. Annual Review of Ecology, Evolution, and Systematics, 44, 593-622. |
| [33] |
Paul KI, Roxburgh SH, Chave J, England JR, Zerihun A, Specht A, Lewis T, Bennett LT, Baker TG, Adams MA, Huxtable D, Montagu KD, Falster DS, Feller M, Sochacki S, et al. (2016). Testing the generality of above-ground biomass allometry across plant functional types at the continent scale. Global Change Biology, 22, 2106-2124.
DOI PMID |
| [34] | Peichl M, Arain MA (2007). Allometry and partitioning of above- and belowground tree biomass in an age-sequence of white pine forests. Forest Ecology and Management, 253, 68-80. |
| [35] |
Poorter H, Jagodzinski AM, Ruiz-Peinado R, Kuyah S, Luo YJ, Oleksyn J, Usoltsev VA, Buckley TN, Reich PB, Sack L (2015). How does biomass distribution change with size and differ among species? An analysis for 1200 plant species from five continents. New Phytologist, 208, 736-749.
DOI PMID |
| [36] | Qiu FY, Xiao FM, Wu YF, He XS (2019). Growth and biomass distribution of the middle-age and young Phoebe bournei. Hubei Foresty Science and Technology, 48(3), 12-15. |
| [邱凤英, 肖复明, 伍艳芳, 何小三 (2019). 中幼龄闽楠生长及生物量分配特征研究. 湖北林业科技, 48(3), 12-15.] | |
| [37] | Quan JE, Ni RY, Wang YG, Sun JJ, Ma MY, Bi HT (2022). Effects of different growth regulators on the rooting of Catalpa bignonioides softwood cuttings. Life, 12, 1231. DOI: 10.3390/life12081231. |
| [38] | Roxburgh SH, Paul KI, Clifford D, England JR, Raison RJ (2015). Guidelines for constructing allometric models for the prediction of woody biomass: How many individuals to harvest? Ecosphere, 6, 1-27. |
| [39] | Schindler Z, Seifert T, Sheppard JP, Morhart C (2023). Allometric models for above-ground biomass, carbon and nutrient content of wild cherry (Prunus avium L.) trees in agroforestry systems. Annals of Forest Science, 80, 28. DOI: 10.1186/s13595-023-01196-6. |
| [40] | Shahabedini S, Ghahramany L, Pulido F, Khosravi S, Moreno G (2018). Estimating leaf biomass of pollarded lebanon oak in open silvopastoral systems using allometric equations. Trees, 32, 99-108. |
| [41] | Solomon N, Birhane E, Tadesse T, Treydte AC, Meles K (2017). Carbon stocks and sequestration potential of dry forests under community management in Tigray, Ethiopia. Ecological Processes, 6, 20. DOI: 10.1186/s13717-017-0088-2. |
| [42] |
Strand AE, Pritchard SG, McCormack ML, Davis MA, Oren R (2008). Irreconcilable differences: fine-root life spans and soil carbon persistence. Science, 319, 456-458.
DOI PMID |
| [43] | Sun TT, Ren RH, Xing MM, Duan QX, Zhao L, Yan WW, Fang Y, Zhang SY, Dong H, Wang MR, Heng QM, Chen WY, Xu T, Kou LL, Li KP, et al. (2024). Morphological and physiological plasticity of Catalpa bungei roots under partial root-zone drought as affected by nitrogen forms. New Forests, 55, 383-402. |
| [44] | Tobin B, Black K, Osborne B, Reidy B, Bolger T, Nieuwenhuis M (2006). Assessment of allometric algorithms for estimating leaf biomass, leaf area index and litter fall in different-aged Sitka spruce forests. Forestry, 79, 453-465. |
| [45] | Wang CK (2006). Biomass allometric equations for 10 co-occurring tree species in Chinese temperate forests. Forest Ecology and Management, 222, 9-16. |
| [46] | Wang JC, Qin XM, Xu SQ, Zhao MY, Shu PQ, Xu FJ, Ma JY, Sun Y, Dong H, Guo ZY, Long DP, Ma WJ, Lu YZ, Xie XM, Chen YL, Chu J, Wang JH, Zhang Y (2021). Nitrogen availability affects stem development and response to differential root-zone drought stress in Catalpa bungei. Environmental and Experimental Botany, 186, 104429. DOI: 10.1016/j.envexpbot.2021.104429. |
| [47] | Xiang WH, Liu SH, Deng XW, Shen AH, Lei XD, Tian DL, Zhao MF, Peng CH (2011). General allometric equations and biomass allocation of Pinus massoniana trees on a regional scale in southern China. Ecological Research, 26, 697-711. |
| [48] | Xiao Y, Ma WJ, Lu N, Wang Z, Wang N, Zhai WJ, Kong LS, Qu GZ, Wang QX, Wang JH (2019). Genetic variation of growth traits and genotype-by-environment interactions in clones of Catalpa bungei and Catalpa fargesii f. duclouxii. Forests, 10, 57. DOI: 10.3390/f10010057. |
| [49] | Xiao Y, Wang JH, Yun HL, Yang GJ, Ma JW, Ma WJ, Qu GZ (2021). Genetic evaluation and combined selection for the simultaneous improvement of growth and wood properties in Catalpa bungei clones. Forests, 12, 868. DOI: 10.3390/f12070868. |
| [50] | Xie L, Fu L, Widagdo FRA, Dong L, Li F (2022). Improving the accuracy of tree biomass estimations for three coniferous tree species in Northeast China. Trees, 36, 451-469. |
| [51] | Zeng WS, Chen XY, Yang XY (2021). Developing national and regional individual tree biomass models and analyzing impact of climatic factors on biomass estimation for poplar plantations in China. Trees, 35, 93-102. |
| [52] | Zhao HB, Zhou GY, Li ZJ, Qiu ZJ, Wu ZM, Wang X (2022). Biomass allocation and allometric growth models of four common tree species in southern subtropical evergreen broad-leaved forest. Scientia Silvae Sinicae, 58(2), 23-31. |
| [赵厚本, 周光益, 李兆佳, 邱治军, 吴仲民, 王旭 (2022). 南亚热带常绿阔叶林4个常见树种的生物量分配特征与异速生长模型. 林业科学, 58(2), 23-31.] | |
| [53] | Zhao JN (2020). Growth Regularity and Cultivation Technology of Catalpa bungei Plantation. Master degree dissertation, South China Agricultural University, Guangzhou. |
| [赵江宁 (2020). 楸树人工林生长规律与关键培育技术研究. 硕士学位论文, 华南农业大学, 广州.] | |
| [54] | Zheng CH, Mason EG, Jia LM, Wei SP, Sun CW, Duan J (2015). A single-tree additive biomass model of Quercus variabilis Blume forests in North China. Trees, 29, 705-716. |
| [1] | 梁逸娴, 王传宽, 臧妙涵, 上官虹玉, 刘逸潇, 全先奎. 落叶松径向生长和生物量分配对气候变暖的响应[J]. 植物生态学报, 2024, 48(4): 459-468. |
| [2] | 耿雪琪, 唐亚坤, 王丽娜, 邓旭, 张泽凌, 周莹. 氮添加增加中国陆生植物生物量并降低其氮利用效率[J]. 植物生态学报, 2024, 48(2): 147-157. |
| [3] | 陶琼, 缪宁, 岳喜明, 罗建琼, 薛盼盼, 王晖. 川西亚高山岷江冷杉幼苗生物量积累与分配的影响因子[J]. 植物生态学报, 2024, 48(11): 1459-1470. |
| [4] | 刘艳杰, 刘玉龙, 王传宽, 王兴昌. 东北温带森林5个羽状复叶树种叶成本-效益关系比较[J]. 植物生态学报, 2023, 47(11): 1540-1550. |
| [5] | 王娇, 关欣, 张伟东, 黄苛, 朱睦楠, 杨庆朋. 杉木幼苗生物量分配格局对氮添加的响应[J]. 植物生态学报, 2021, 45(11): 1231-1240. |
| [6] | 邢磊, 段娜, 李清河, 刘成功, 李慧卿, 孙高洁. 白刺不同物候期的生物量分配规律[J]. 植物生态学报, 2020, 44(7): 763-771. |
| [7] | 张娜, 朱阳春, 李志强, 卢信, 范如芹, 刘丽珠, 童非, 陈静, 穆春生, 张振华. 淹水和干旱生境下铅对芦苇生长、生物量分配和光合作用的影响[J]. 植物生态学报, 2018, 42(2): 229-239. |
| [8] | 高景, 王金牛, 徐波, 谢雨, 贺俊东, 吴彦. 不同雪被厚度下典型高山草地早春植物叶片性状、株高及生物量分配的研究[J]. 植物生态学报, 2016, 40(8): 775-787. |
| [9] | 陈青青, 李德志. 根系隔离条件下的谷子亲缘识别[J]. 植物生态学报, 2015, 39(12): 1188-1197. |
| [10] | 潘少安, 彭国全, 杨冬梅. 从叶内生物量分配策略的角度理解叶大小的优化[J]. 植物生态学报, 2015, 39(10): 971-979. |
| [11] | 肖遥,陶冶,张元明. 古尔班通古特沙漠4种荒漠草本植物不同生长期的生物量分配与叶片化学计量特征[J]. 植物生态学报, 2014, 38(9): 929-940. |
| [12] | 毛伟, 李玉霖, 崔夺, 赵学勇, 张铜会, 李玉强. 沙质草地不同生活史植物的生物量分配对氮素和水分添加的响应[J]. 植物生态学报, 2014, 38(2): 125-133. |
| [13] | 徐波, 王金牛, 石福孙, 高景, 吴宁. 青藏高原东缘野生暗紫贝母生物量分配格局对高山生态环境的适应[J]. 植物生态学报, 2013, 37(3): 187-196. |
| [14] | 吴茜, 丁佳, 闫慧, 张守仁, 方腾, 马克平. 模拟降水变化和土壤施氮对浙江古田山5个树种幼苗生长和生物量的影响[J]. 植物生态学报, 2011, 35(3): 256-267. |
| [15] | 解蕊, 李俊清, 赵雪, 李楠. 林冠环境对亚高山针叶林下缺苞箭竹生物量分配和克隆形态的影响[J]. 植物生态学报, 2010, 34(6): 753-760. |
| 阅读次数 | ||||||
|
全文 |
|
|||||
|
摘要 |
|
|||||
Copyright © 2026 版权所有 《植物生态学报》编辑部
地址: 北京香山南辛村20号, 邮编: 100093
Tel.: 010-62836134, 62836138; Fax: 010-82599431; E-mail: apes@ibcas.ac.cn, cjpe@ibcas.ac.cn
备案号: 京ICP备16067583号-19
![]()