
Chin J Plan Ecolo ›› 2017, Vol. 41 ›› Issue (4): 387-395.DOI: 10.17521/cjpe.2016.0184
• Orginal Article • Next Articles
Lei ZHANG1, Lin-lin WANG2, Shi-Rong LIU3,*( ), Peng-Sen SUN3, Zhen YU4, Shu-Tao HUANG5, Xu- Dong ZHANG1
Received:2016-05-31
Accepted:2017-01-03
Online:2017-04-10
Published:2017-05-19
Contact:
Shi-Rong LIU
Lei ZHANG, Lin-lin WANG, Shi-Rong LIU, Peng-Sen SUN, Zhen YU, Shu-Tao HUANG, Xu- Dong ZHANG. An evaluation of four threshold selection methods in species occurrence modelling with random forest: Case studies with Davidia involucrata and Cunninghamia lanceolata[J]. Chin J Plan Ecolo, 2017, 41(4): 387-395.
Add to citation manager EndNote|Ris|BibTeX
URL: https://www.plant-ecology.com/EN/10.17521/cjpe.2016.0184
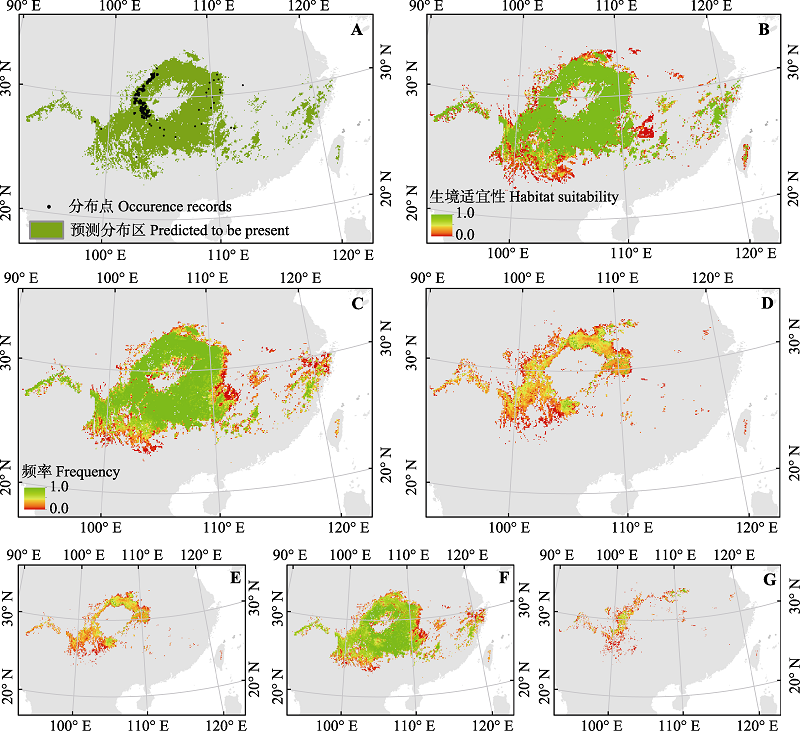
Fig. 1 Binary (A) and probability (B) distribution maps of Davidia involucrata under current climate produced by the same model-building dataset. Frequency of the presence of Davidia involucrata calculated across 45 predictions under current (C) and future (D) climates and the frequency of stable (E), lost (F) and gained (G) habitats under future climate.
| 精度指标 Accuracy measure | 公式 Formula |
|---|---|
| 总准确度 Overall accuracy | (a +d)/n |
| 敏感度 Sensitivity | a/(a + c) |
| 特异度 Specificity | d/(b + d) |
| Kappa | $\frac{\left( a\text{+}d \right)-\text{ }\!\![\!\!\text{ }\left( a\text{+}c \right)\left( a\text{+}b \right)\text{+}\left( b\text{+}d \right)\left( c\text{+}d \right)\text{ }\!\!]\!\!\text{ /}n}{n-\text{ }\!\![\!\!\text{ }\left( a\text{+}c \right)\left( a\text{+}b \right)\text{+(}b\text{+}d\text{)(}c\text{+}d\text{) }\!\!]\!\!\text{ /}n}$ |
| 真实技巧统计法 True skill statistic (TSS) | Sensitivity + Specificit -1 |
Table 1 Measures of predictive accuracy
| 精度指标 Accuracy measure | 公式 Formula |
|---|---|
| 总准确度 Overall accuracy | (a +d)/n |
| 敏感度 Sensitivity | a/(a + c) |
| 特异度 Specificity | d/(b + d) |
| Kappa | $\frac{\left( a\text{+}d \right)-\text{ }\!\![\!\!\text{ }\left( a\text{+}c \right)\left( a\text{+}b \right)\text{+}\left( b\text{+}d \right)\left( c\text{+}d \right)\text{ }\!\!]\!\!\text{ /}n}{n-\text{ }\!\![\!\!\text{ }\left( a\text{+}c \right)\left( a\text{+}b \right)\text{+(}b\text{+}d\text{)(}c\text{+}d\text{) }\!\!]\!\!\text{ /}n}$ |
| 真实技巧统计法 True skill statistic (TSS) | Sensitivity + Specificit -1 |
| 阈值选择方法 Threshold method | 阈值 Threshold | Kappa | 真实技巧统计法 TSS | 总准确度 Overall accuracy | 敏感度 Sensitivity | 特异度 Specificity | |
|---|---|---|---|---|---|---|---|
| 珙桐 Davidia involucrata | 默认值0.5 Default 0.5 | 0.500 (0.000)a | 0.871 (0.024)a | 0.871 (0.024)a | 0.935 (0.012)a | 0.976 (0.019)a | 0.894 (0.025)a |
| 最大总准确度 Maximizing overall accuracy (MaxAcc) | 0.476 (0.187)ab | 0.872 (0.025)a | 0.872 (0.025)a | 0.936 (0.012)a | 0.975 (0.021)a | 0.897 (0.027)a | |
| 最大Kappa Maximizing Kappa (MaxKappa) | 0.364 (0.185)b | 0.872 (0.025)a | 0.872 (0.025)a | 0.936 (0.012)a | 0.976 (0.020)a | 0.895 (0.027)a | |
| 最大真实技巧统计法 Maximizing true skill statistic (MaxTSS) | 0.364 (0.185)b | 0.872 (0.025)a | 0.872 (0.025)a | 0.936 (0.012)a | 0.976 (0.020)a | 0.895 (0.027)a | |
| 随机森林分类 Random forest classification tree (RFCT) | - | 0.869 (0.030)a | 0.869 (0.030)a | 0.935 (0.015)a | 0.982 (0.022)a | 0.888 (0.031)a | |
| 杉木 Cunninghamia lanceolata | 默认值0.5 Default 0.5 | 0.500 (0.000)a | 0.903 (0.010)a | 0.903 (0.010)a | 0.951 (0.005)a | 0.962 (0.010)a | 0.941 (0.009)a |
| 最大总准确度 Maximizing overall accuracy (MaxAcc) | 0.540 (0.078)a | 0.908 (0.011)a | 0.908 (0.011)a | 0.954 (0.006)a | 0.958 (0.013)a | 0.950 (0.009)a | |
| 最大Kappa Maximizing Kappa (MaxKappa) | 0.540 (0.078)a | 0.908 (0.011)a | 0.908 (0.011)a | 0.954 (0.006)a | 0.958 (0.013)a | 0.950 (0.009)a | |
| 最大TSS Maximizing true skill statistic (MaxTSS) | 0.541 (0.076)a | 0.908 (0.011)a | 0.908 (0.011)a | 0.954 (0.006)a | 0.958 (0.013)a | 0.950 (0.009)a | |
| 随机森林分类 Random forest classification tree (RFCT) | - | 0.905 (0.010)a | 0.905 (0.010)a | 0.952 (0.005)a | 0.961 (0.010)a | 0.943 (0.007)a |
Table 2 Thresholds selected by four threshold criteria and model accuracies determined by five measures
| 阈值选择方法 Threshold method | 阈值 Threshold | Kappa | 真实技巧统计法 TSS | 总准确度 Overall accuracy | 敏感度 Sensitivity | 特异度 Specificity | |
|---|---|---|---|---|---|---|---|
| 珙桐 Davidia involucrata | 默认值0.5 Default 0.5 | 0.500 (0.000)a | 0.871 (0.024)a | 0.871 (0.024)a | 0.935 (0.012)a | 0.976 (0.019)a | 0.894 (0.025)a |
| 最大总准确度 Maximizing overall accuracy (MaxAcc) | 0.476 (0.187)ab | 0.872 (0.025)a | 0.872 (0.025)a | 0.936 (0.012)a | 0.975 (0.021)a | 0.897 (0.027)a | |
| 最大Kappa Maximizing Kappa (MaxKappa) | 0.364 (0.185)b | 0.872 (0.025)a | 0.872 (0.025)a | 0.936 (0.012)a | 0.976 (0.020)a | 0.895 (0.027)a | |
| 最大真实技巧统计法 Maximizing true skill statistic (MaxTSS) | 0.364 (0.185)b | 0.872 (0.025)a | 0.872 (0.025)a | 0.936 (0.012)a | 0.976 (0.020)a | 0.895 (0.027)a | |
| 随机森林分类 Random forest classification tree (RFCT) | - | 0.869 (0.030)a | 0.869 (0.030)a | 0.935 (0.015)a | 0.982 (0.022)a | 0.888 (0.031)a | |
| 杉木 Cunninghamia lanceolata | 默认值0.5 Default 0.5 | 0.500 (0.000)a | 0.903 (0.010)a | 0.903 (0.010)a | 0.951 (0.005)a | 0.962 (0.010)a | 0.941 (0.009)a |
| 最大总准确度 Maximizing overall accuracy (MaxAcc) | 0.540 (0.078)a | 0.908 (0.011)a | 0.908 (0.011)a | 0.954 (0.006)a | 0.958 (0.013)a | 0.950 (0.009)a | |
| 最大Kappa Maximizing Kappa (MaxKappa) | 0.540 (0.078)a | 0.908 (0.011)a | 0.908 (0.011)a | 0.954 (0.006)a | 0.958 (0.013)a | 0.950 (0.009)a | |
| 最大TSS Maximizing true skill statistic (MaxTSS) | 0.541 (0.076)a | 0.908 (0.011)a | 0.908 (0.011)a | 0.954 (0.006)a | 0.958 (0.013)a | 0.950 (0.009)a | |
| 随机森林分类 Random forest classification tree (RFCT) | - | 0.905 (0.010)a | 0.905 (0.010)a | 0.952 (0.005)a | 0.961 (0.010)a | 0.943 (0.007)a |
| 阈值方法 Threshold | 当前适生区 Total habitat area (×103 km2) | 总生境变 化比例 Total range change (%) | 新生境 比例 Habitat gained (%) | 生境消失 比例 Habitat lost (%) | 东向迁移 距离 Eastward shift (km) | 北向迁移 距离 Northward shift (km) | 高程迁移 距离 Uphill shift (m) | |
|---|---|---|---|---|---|---|---|---|
| 珙桐 Davidia involucrata | Default 0.5 | 762.8 (34.6)a | -95.9 (3.8)a | 0.6 (0.9)a | 96.6 (3.0)a | 70.7 (133.2)a | 252.3 (43.5)a | -341 (211)a |
| MaxAcc | 761.1 (69.1)a | -94.8 (6.4)a | 1.0 (1.3)a | 95.8 (5.1)a | 69.3 (164.5)a | 228.4 (80.5)a | -336 (244)a | |
| MaxKappa | 780.1 (69.5)ab | -94.3 (6.6)ab | 1.1 (1.4)ab | 95.4 (5.3)ab | 50.9 (164.4)a | 241.7 (41.7)a | -341 (255)a | |
| MaxTSS | 780.1 (69.5)ab | -94.3 (6.6)ab | 1.1 (1.4)ab | 95.4 (5.3)ab | 50.9 (164.4)a | 241.7 (41.7)a | -341 (255)a | |
| RFCT | 804.3 (27.9)b | -60.1 (1.9)b | 7.9 (1.1)b | 68.0 (1.8)b | -236.0 (33.9)b | 134.5 (9.0)b | 242 (63)b | |
| 杉木 Cunninghamia lanceolata | Default 0.5 | 1β401.5 (14.4)a | -0.3 (0.1)ab | 0.1 (0.0)ab | 0.4 (0.1)ab | -129.1 (22.1)a | 68.5 (14.9)ab | 243.3 (37.5)a |
| MaxAcc | 1β367.4 (67.9)a | -0.4 (0.2)b | 0.1 (0.1)ab | 0.5 (0.1)b | -107.6 (48.2)ab | 57.6 (32.6)b | 238.7 (33.4)ab | |
| MaxKappa | 1β367.4 (67.9)a | -0.4 (0.2)b | 0.1 (0.1)ab | 0.5 (0.1)b | -107.6 (48.2)ab | 57.6 (32.6)b | 238.7 (33.4)ab | |
| MaxTSS | 1β365.7 (65.8)a | -0.4 (0.2)b | 0.1 (0.1)b | 0.5 (0.1)b | -108.0 (48.4)ab | 57.3 (32.5)b | 238.9 (33.5)ab | |
| RFCT | 1β391.2 (11.0)a | -0.3 (0.1)a | 0.1 (0.0)a | 0.4 (0.1)a | -82.0 (26.8)b | 81.5 (12.2)a | 183.0 (38.8)b |
Table 3 Potential habitat suitable areas and changes in the distribution range of tree species (change in area and shift in distance and direction of mean centers of suitable habitat) for the normal period 2070-2099 (2080s) relative to current baseline (1961-1990).
| 阈值方法 Threshold | 当前适生区 Total habitat area (×103 km2) | 总生境变 化比例 Total range change (%) | 新生境 比例 Habitat gained (%) | 生境消失 比例 Habitat lost (%) | 东向迁移 距离 Eastward shift (km) | 北向迁移 距离 Northward shift (km) | 高程迁移 距离 Uphill shift (m) | |
|---|---|---|---|---|---|---|---|---|
| 珙桐 Davidia involucrata | Default 0.5 | 762.8 (34.6)a | -95.9 (3.8)a | 0.6 (0.9)a | 96.6 (3.0)a | 70.7 (133.2)a | 252.3 (43.5)a | -341 (211)a |
| MaxAcc | 761.1 (69.1)a | -94.8 (6.4)a | 1.0 (1.3)a | 95.8 (5.1)a | 69.3 (164.5)a | 228.4 (80.5)a | -336 (244)a | |
| MaxKappa | 780.1 (69.5)ab | -94.3 (6.6)ab | 1.1 (1.4)ab | 95.4 (5.3)ab | 50.9 (164.4)a | 241.7 (41.7)a | -341 (255)a | |
| MaxTSS | 780.1 (69.5)ab | -94.3 (6.6)ab | 1.1 (1.4)ab | 95.4 (5.3)ab | 50.9 (164.4)a | 241.7 (41.7)a | -341 (255)a | |
| RFCT | 804.3 (27.9)b | -60.1 (1.9)b | 7.9 (1.1)b | 68.0 (1.8)b | -236.0 (33.9)b | 134.5 (9.0)b | 242 (63)b | |
| 杉木 Cunninghamia lanceolata | Default 0.5 | 1β401.5 (14.4)a | -0.3 (0.1)ab | 0.1 (0.0)ab | 0.4 (0.1)ab | -129.1 (22.1)a | 68.5 (14.9)ab | 243.3 (37.5)a |
| MaxAcc | 1β367.4 (67.9)a | -0.4 (0.2)b | 0.1 (0.1)ab | 0.5 (0.1)b | -107.6 (48.2)ab | 57.6 (32.6)b | 238.7 (33.4)ab | |
| MaxKappa | 1β367.4 (67.9)a | -0.4 (0.2)b | 0.1 (0.1)ab | 0.5 (0.1)b | -107.6 (48.2)ab | 57.6 (32.6)b | 238.7 (33.4)ab | |
| MaxTSS | 1β365.7 (65.8)a | -0.4 (0.2)b | 0.1 (0.1)b | 0.5 (0.1)b | -108.0 (48.4)ab | 57.3 (32.5)b | 238.9 (33.5)ab | |
| RFCT | 1β391.2 (11.0)a | -0.3 (0.1)a | 0.1 (0.0)a | 0.4 (0.1)a | -82.0 (26.8)b | 81.5 (12.2)a | 183.0 (38.8)b |
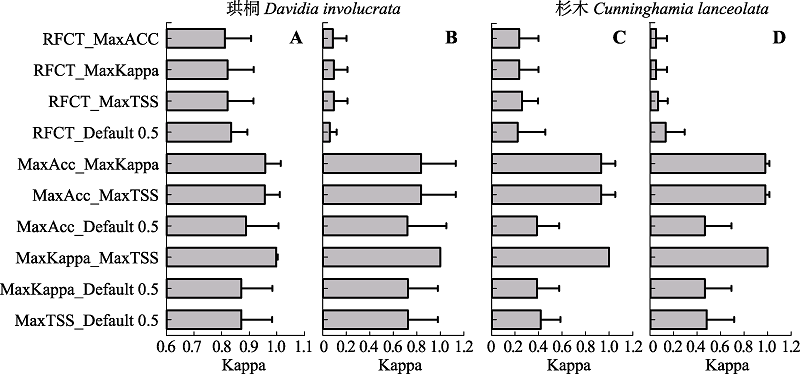
Fig. 2 Pairwise Kappa correlation of habitat maps of four threshold selection method under current (A, C) and future (B, D) climates. Error bars represent standard errors. The abbreviations of threshold methods are the same as in Table 2.
| [1] | Bailey SA, Haines-Young RH, Watkins C (2002). Species presence in fragmented landscapes: Modelling of species requirements at the national level.Biological Conservation, 108, 307-316. |
| [2] | Barbet-Massin M, Jiguet F, Alber CH, Thuiller W (2012). Selecting pseudo-absences for species distribution models: How, where and how many?Methods in Ecology and Evolution, 3, 327-338. |
| [3] | Breiman L, Cutler A (. Cited: 2016-02-18. |
| [4] | Carpenter G, Gillison A, Winter J (1993). DOMAIN: A flexible modelling procedure for mapping potential distributions of plants and animals.Biodiversity and Conservation, 2, 667-680. |
| [5] | Editorial Committee of Vegetation Map of China, Chinese Academy of Sciences (2001). 1:1,000,000 Vegetation Distribution Map of China. Science Press, Beijing. (in Chinese)[中国科学院植被图编辑委员会 (2001). 1:1,000,000中国植被图. 科学出版社, 北京.] |
| [6] | Engler R, Guisan A, Rechsteiner L (2004). An improved approach for predicting the distribution of rare and endangered species from occurrence and pseudo-absence data.Journal of Applied Ecology, 41, 263-274. |
| [7] | Fielding AH, Haworth PF (1995). Testing the generality of bird-habitat models.Conservation Biology, 9, 1466-1481. |
| [8] | Fielding AH, Bell JF (1997). A review of methods for the assessment of prediction errors in conservation presence/ absence models.Environmental Conservation, 24, 38-49. |
| [9] | Freeman EA, Moisen GG (2008). A comparison of the performance of threshold criteria for binary classification in terms of predicted prevalence and Kappa.Ecological Modelling, 217, 48-58. |
| [10] | Guisan A, Zimmermann NE (2000). Predictive habitat distribution models in ecology.Ecological Modeling, 135, 147-186. |
| [11] | Guo Q, Liu Y (2010). ModEco: An integrated software package for ecological niche modeling.Ecography, 33, 637-642. |
| [12] | Hirzel AH, Hausser J, Perrin N (. Cited: 2016-02-18. |
| [13] | Jimenez-Valverde A, Lobo J (2007). Threshold criteria for conversion of probability of species presence to either-or presence-absence.Acta Oecologica, 31, 361-369. |
| [14] | Jin JX, Jiang H, Peng W, Zhang LJ, Lu XH, Xu JH, Zhang XY, Wang Y (2013). Evaluating the impact of soil factors on the potential distribution ofPhyllostachys edulis (bamboo) in China based on the species distribution model. Chinese Journal of Plant Ecology, 37, 631-640. (in Chinese with English abstract)[金佳鑫, 江洪, 彭威, 张林静, 卢学鹤, 徐建辉, 张秀英, 王颖 (2013). 基于物种分布模型评价土壤因子对我国毛竹潜在分布的影响. 植物生态学报, 37, 631-640.] |
| [15] | Liaw A, Wiener M (2002). Classification and regression by randomForest.R News, 2(3), 18-22. |
| [16] | Liu C, White M, Newell G (2013). Selecting thresholds for the prediction of species occurrence with presence-only data.Journal of Biogeography, 40, 778-789. |
| [17] | Liu C, Berry PM, Dawson TP, Pearson RG (2005). Selecting thresholds of occurrence in the prediction of species distributions.Ecography, 28, 385-393. |
| [18] | Nenzén H, Araújo M (2011). Choice of threshold alters projections of species range shifts under climate change.Ecological Modelling, 222, 3346-3354. |
| [19] | Norris D (2014). Model thresholds are more important than presence location type: Understanding the distribution of lowland tapir (Tapirus terrestris) in a continuous Atlantic forest of southeast Brazil. Tropical Conservation Science, 7, 529-547. |
| [20] | O’Hanley JR (2009). NeuralEnsembles: A neural network based ensemble forecasting program for habitat and bioclimatic suitability analysis.Ecography, 32, 89-93. |
| [21] | R Core Team (. Cited: 2016-02-18. |
| [22] | Robertson M, Caithness N, Villet M (2001). A PCA-based modelling technique for predicting environmental suitability for organisms from presence records.Diversity and Distributions, 7, 15-27. |
| [23] | Shao H, Tian JQ, Guo K, Sun OJ (2009). Effects of sample size and species traits on performance of bioclim in predicting geographical distribution of tree species—A case study with 12 deciduous Quercus species indigenous to china. Chinese Journal of Plant Ecology, 33, 870-877. (in Chinese with English abstract)[邵慧, 田佳倩, 郭柯, 孙建新 (2009). 样本容量和物种特征对BIOCLIM模型模拟物种分布准确度的影响——以12个中国特有落叶栎树种为例. 植物生态学报, 33, 870-877.] |
| [24] | terBraak CJF, Looman CWN (1986). Weighted averaging, logistic regression and the Gaussian response model.Plant Ecology, 65, 3-11. |
| [25] | Thuiller W (2004). Patterns and uncertainties of species’ range shifts under climate change.Global Change Biology, 10, 2020-2027. |
| [26] | Wang J, Ni J (2006). Review of modelling the distribution of plant species.Chinese Journal of Plant Ecology, 30, 1040-1053. (in Chinese with English abstract)[王娟, 倪健 (2006). 植物种分布的模拟研究进展. 植物生态学报, 30, 1040-1053.] |
| [27] | Zhang L, Liu S, Sun P, Wang T, Wang G, Zhang X, Wang L (2015). Consensus forecasting of species distributions: The effects of niche model performance and niche properties.PLOS ONE, 10, e0120056. doi:10.1371/journal.pone.0120056. |
| [28] | Zhang L, Liu SR, Sun PS, Wang TL (2011a). Comparative evaluation of multiple models of the effects of climate change on the potential distribution of Pinus massoniana. Chinese Journal of Plant Ecology, 35, 1091-1105. (in Chinese with English abstract)[张雷, 刘世荣, 孙鹏森, 王同立 (2011a). 气候变化对马尾松潜在分布影响预估的多模型比较. 植物生态学报, 35, 1091-1105.] |
| [29] | Zhang L, Liu SR, Sun PS, Wang TL (2011b). Predicting the potential distribution of Phyllostachys edulis with DOMAIN and NeuralEnsembles models. Scientia Silvae Sinicae, 47(7), 20-26. (in Chinese with English abstract)[张雷, 刘世荣, 孙鹏森, 王同立 (2011b). 基于DOMAIN和NeuralEnsembles模型预估中国毛竹潜在分布. 林业科学, 47(7), 20-26.] |
| [30] | Zhang L, Wang LL, Zhang XD, Liu SR, Sun PS, Wang TL (2014). The basic principle of random forest and its applications in ecology: A case study of Pinus yunnanensis.Acta Ecologica Sinica, 34, 650-659. (in Chinese with English abstract)[张雷, 王琳琳, 张旭东, 刘世荣, 孙鹏森, 王同立 (2014). 随机森林算法基本思想及其在生态学中的应用——以云南松分布模拟为例. 生态学报, 34, 650-659.] |
| [1] | CAO Zhen, LIU Yong-Ying, SONG Shi-Kai, ZHANG Li-Na, GAO De. Drivers of the small-island effect in moss assemblages on terrestrial habitat islands: a case study in mountaintops of the Middle Taihang Mountains, China [J]. Chin J Plant Ecol, 2023, 47(1): 65-76. |
| [2] | ZHU Ming-Yang, LIN Lin, SHE Yu-Long, XIAO Cheng-Cai, ZHAO Tong-Xing, HU Chun-Xiang, ZHAO Chang-You, WANG Wen-Li. Radial growth and its low-temperature threshold of Abies georgei var. smithii at different altitudes in Jiaozi Mountain, Yunnan, China [J]. Chin J Plant Ecol, 2022, 46(9): 1038-1049. |
| [3] | LIU Chao, LI Ping, WU Yun-Tao, PAN Sheng-Nan, JIA Zhou, LIU Ling-Li. Estimation of grassland aboveground biomass using digital photograph and canopy structure measurements [J]. Chin J Plant Ecol, 2022, 46(10): 1280-1288. |
| [4] | ZHOU Kai-Ling, ZHAO Yu-Jin, BAI Yong-Fei. Study on forest plant diversity monitoring based on Sentinel-2A satellite data in northeast China [J]. Chin J Plant Ecol, 2022, 46(10): 1251-1267. |
| [5] | ZHAO Yan-Ping, WANG Zhong-Wu, WENDU Rigen, ZHAO Yu-Jin, BAI Yong-Fei. Remotely sensed monitoring method of grassland plant functional diversity and its relationship with productivity based on Sentinel-2 satellite data [J]. Chin J Plant Ecol, 2022, 46(10): 1234-1250. |
| [6] | XUE Peng-Fei, LI Wen-Long, ZHU Gao-Feng, ZHOU Hua-Kun, LIU Chen-Li, YAN He-Piao. Changes in the pattern of an alpine wetland landscape in Maqu County in the first meander of the Yellow River [J]. Chin J Plant Ecol, 2021, 45(5): 467-475. |
| [7] | ZHANG Wen-Qiang, LUO Ge-Ping, ZHENG Hong-Wei, WANG Hao, HAMDI Rafiq, HE Hui-Li, CAI Peng, CHEN Chun-Bo. Analysis of vegetation index changes and driving forces in inland arid areas based on random forest model: a case study of the middle part of northern slope of the north Tianshan Mountains [J]. Chin J Plant Ecol, 2020, 44(11): 1113-1126. |
| [8] | ZHANG Xue-Jiao, GAO Xian-Ming, JI Cheng-Jun, KANG Mu-Yi, WANG Ren-Qing, YUE Ming, ZHANG Feng, TANG Zhi-Yao. Response of abundance distribution of five species of Quercus to climate change in northern China [J]. Chin J Plant Ecol, 2019, 43(9): 774-782. |
| [9] | GAO Lin, WANG Xiao-Fei, GU Xing-Fa, TIAN Qing-Jiu, JIAO Jun-Nan, WANG Pei-Yan, LI Dan. Exploring the influence of soil types underneath the canopy in winter wheat leaf area index remote estimating [J]. Chin J Plant Ecol, 2017, 41(12): 1273-1288. |
| [10] | Rui-Ying ZHANG, Yong PANG, Zeng-Yuan LI, Yu-Hai BAO. Canopy closure estimation in a temperate forest using airborne LiDAR and LANDSAT ETM+ data [J]. Chin J Plant Ecol, 2016, 40(2): 102-115. |
| [11] | Qiu-Fang ZHANG, Chun-Ping LÜ, Zhao-Xian BEI, Jin-Sheng XIE, Mao-Kui LÜ, Wei-Sheng LIN, Yue-Min CHEN, Yu-Sheng YANG. Effects of simulated warming outdoor on lipid peroxidation and protective enzyme activities in the subtropical species Cunninghamia lanceolata [J]. Chin J Plan Ecolo, 2016, 40(12): 1230-1237. |
| [12] | TANG Hai-Ping,CHEN Jiao,XUE Hai-Li. Ecological thresholds: Concept, Methods and research outlooks [J]. Chin J Plan Ecolo, 2015, 39(9): 932-940. |
| [13] | WANG Dian, YUAN Fang, WANG Bao-Shan, CHEN Min. Response of plant biofuel hybrid Pennisetum to NaCl stress and its salinity threshold [J]. Chin J Plant Ecol, 2012, 36(6): 572-577. |
| [14] | ZHAO Jing-Jing, LIU Liang-Yun. Effects of phenological change on ecosystem productivity of temperate deciduous broad- leaved forests in North America [J]. Chin J Plant Ecol, 2012, 36(5): 363-371. |
| [15] | SONG Chun-Qiao, YOU Song-Cai, KE Ling-Hong, LIU Gao-Huan, ZHONG Xin-Ke. Spatio-temporal variation of vegetation phenology in the Northern Tibetan Plateau as detected by MODIS remote sensing [J]. Chin J Plant Ecol, 2011, 35(8): 853-863. |
| Viewed | ||||||
|
Full text |
|
|||||
|
Abstract |
|
|||||
Copyright © 2022 Chinese Journal of Plant Ecology
Tel: 010-62836134, 62836138, E-mail: apes@ibcas.ac.cn, cjpe@ibcas.ac.cn