
Chin J Plant Ecol ›› 2021, Vol. 45 ›› Issue (4): 420-428.DOI: 10.17521/cjpe.2020.0326
Special Issue: 光合作用
• Research Articles • Previous Articles
YE Zi-Piao1, YU Feng2,3, AN Ting1, WANG Fu-Biao1, KANG Hua-Jing2,3,4,*
Received:2020-10-09
Accepted:2021-01-16
Online:2021-04-20
Published:2021-03-09
Contact:
KANG Hua-Jing
Supported by:YE Zi-Piao, YU Feng, AN Ting, WANG Fu-Biao, KANG Hua-Jing. Investigation on CO2-response model of stomatal conductance for plants[J]. Chin J Plant Ecol, 2021, 45(4): 420-428.
Add to citation manager EndNote|Ris|BibTeX
URL: https://www.plant-ecology.com/EN/10.17521/cjpe.2020.0326
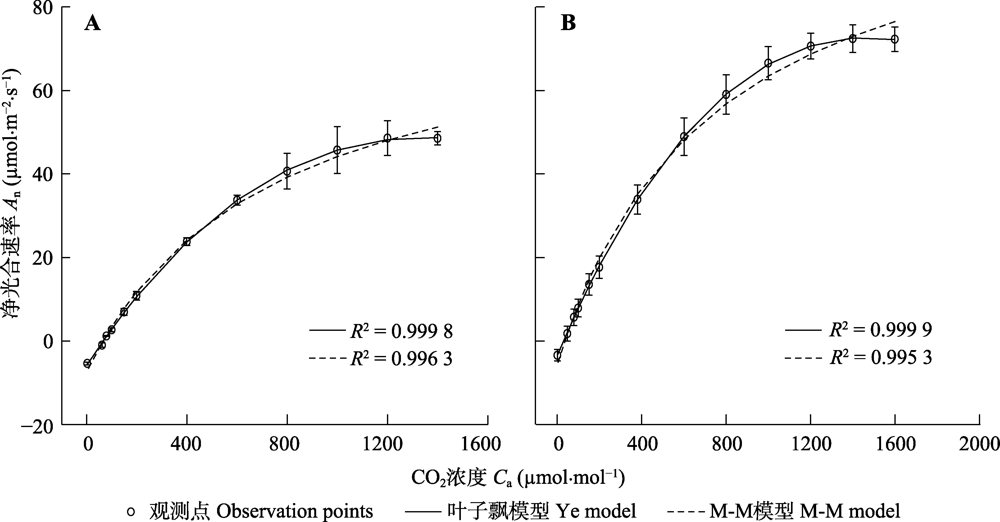
Fig. 1 CO2-response curves of photosynthesis for air CO2 concentrations for soybean (A) and wheat (B)(mean ± SE, n= 5). An, net photosynthetic rate; Ca, air CO2 concentration.
| 参数 Parameter | 物种 Species | |||||
|---|---|---|---|---|---|---|
| 大豆 Soybean | 小麦 Wheat | |||||
| 叶模型 Ye model | M-M模型 M-M model | 观测值 Observed data | 叶模型 Ye model | M-M模型 M-M model | 观测值 Observed data | |
| 初始斜率 α | 0.101 ± 0.019 b | 0.128 ± 0.014 a | - | 0.101 ± 0.001 b | 0.132 ± 0.001 a | - |
| 最大羧化速率Anmax (mol·m-2·s-1) | 48.61 ± 5.52 b | 93.71 ± 17.67 a | 49.00 ± 4.33 b | 68.13 ± 1.62 b | 127.03 ± 4.42 a | 68.02 ± 1.45 b |
| 饱和CO2浓度Ci,TPU (μmol·mol-1) | 1 328.28 ± 79.07 a | - | 1 332.72 ± 66.52 a | 1 596.73 ± 31.88 a | - | 1 599.46 ± 0.25 a |
| CO2补偿点 Γ (μmol·mol-1) | 66.32 ± 4.04 a | 66.02 ± 4.48 a | 70.32 ± 2.33 a | 63.82 ± 1.59 b | 64.91 ± 1.26 a | 65.18 ± 1.13 ab |
| 光下呼吸速率Rp (μmol·m-2·s-1) | 6.22 ± 0.62 b | 7.58 ± 0.19 a | 5.39 ± 0.32 b | 6.29 ± 0.22 b | 8.06 ± 0.15 a | 6.22 ± 0.26 b |
| 确定系数 R2 | 0.999 8 | 0.996 3 | - | 0.999 9 | 0.995 3 | - |
Table 1 Observed data and results fitted by Ye model and M-M model for An-Ca curves of soybean and wheat (mean ± SE, n= 5)
| 参数 Parameter | 物种 Species | |||||
|---|---|---|---|---|---|---|
| 大豆 Soybean | 小麦 Wheat | |||||
| 叶模型 Ye model | M-M模型 M-M model | 观测值 Observed data | 叶模型 Ye model | M-M模型 M-M model | 观测值 Observed data | |
| 初始斜率 α | 0.101 ± 0.019 b | 0.128 ± 0.014 a | - | 0.101 ± 0.001 b | 0.132 ± 0.001 a | - |
| 最大羧化速率Anmax (mol·m-2·s-1) | 48.61 ± 5.52 b | 93.71 ± 17.67 a | 49.00 ± 4.33 b | 68.13 ± 1.62 b | 127.03 ± 4.42 a | 68.02 ± 1.45 b |
| 饱和CO2浓度Ci,TPU (μmol·mol-1) | 1 328.28 ± 79.07 a | - | 1 332.72 ± 66.52 a | 1 596.73 ± 31.88 a | - | 1 599.46 ± 0.25 a |
| CO2补偿点 Γ (μmol·mol-1) | 66.32 ± 4.04 a | 66.02 ± 4.48 a | 70.32 ± 2.33 a | 63.82 ± 1.59 b | 64.91 ± 1.26 a | 65.18 ± 1.13 ab |
| 光下呼吸速率Rp (μmol·m-2·s-1) | 6.22 ± 0.62 b | 7.58 ± 0.19 a | 5.39 ± 0.32 b | 6.29 ± 0.22 b | 8.06 ± 0.15 a | 6.22 ± 0.26 b |
| 确定系数 R2 | 0.999 8 | 0.996 3 | - | 0.999 9 | 0.995 3 | - |
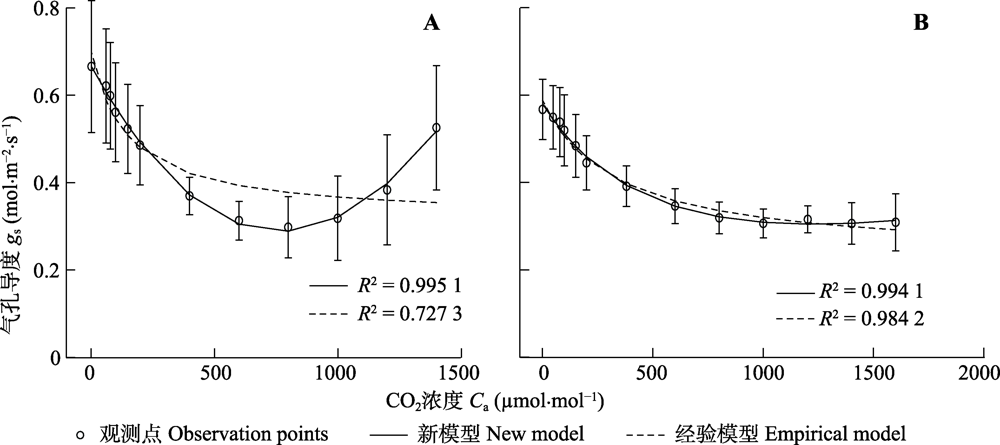
Fig. 2 CO2-response curves of stomatal conductance for air CO2 concentrations for soybean (A) and wheat (B)(mean ± SE, n= 5). Ca, air CO2 concentration;gs, stomatal conductance.
| 参数 Parameter | 物种 Species | |||||
|---|---|---|---|---|---|---|
| 大豆 Soybean | 小麦 Wheat | |||||
| 新模型 New model | 经验模型 Empirical model | 观测值 Observed data | 新模型 New model | 经验模型 Empirical model | 观测值 Observed data | |
| 初始斜率 αi | (1.42 ± 0.68) × 10 -3 | - | - | (7.22 ± 1.43) × 10 -4 | - | - |
| 系数 βi(mol·mol-1) | (6.14 ± 0.33) × 10 -4 | - | - | (2.34 ± 0.73) × 10 -4 | - | - |
| 系数 γi (mol·mol-1) | (7.02 ± 0.68) × 10 -4 | - | - | (2.08 ± 0.35) × 10 -3 | - | - |
| 最大气孔导度 gs-max (mol·m-2·s-1) | 0.686 ± 0.154 a | 0.615 ± 0.161 a | 0.666 ± 0.151 a | 0.481 ± 0.023 a | 0.438 ± 0.013 a | 0.471 ± 0.023 a |
| 常数 Cs0(mol·mol-1) | - | 6 725.12 ± 3 765.30 | - | - | 2 781.66 ± 792.63 | - |
| 最小气孔导度 gs-min (mol·m-2·s-1) | 0.271 ± 0.062 a | - | 0.279 ± 0.066 a | 0.297 ± 0.018 a | - | 0.293 ± 0.020 a |
| CO2浓度 Cs-min (μmol·mol-1) | 741.45 ± 143.22 a | - | 732.78 ± 133.14 a | 1 112.43 ± 149.31 a | - | 1 200.34 ± 200.38 a |
| 确定系数 R2 | 0.995 1 | 0.727 3 | - | 0.994 1 | 0.984 2 | - |
Table 2 Observed data and results fitted by new model and empirical model for gs-Cacurves of soybean and wheat (mean ± SE, n= 5)
| 参数 Parameter | 物种 Species | |||||
|---|---|---|---|---|---|---|
| 大豆 Soybean | 小麦 Wheat | |||||
| 新模型 New model | 经验模型 Empirical model | 观测值 Observed data | 新模型 New model | 经验模型 Empirical model | 观测值 Observed data | |
| 初始斜率 αi | (1.42 ± 0.68) × 10 -3 | - | - | (7.22 ± 1.43) × 10 -4 | - | - |
| 系数 βi(mol·mol-1) | (6.14 ± 0.33) × 10 -4 | - | - | (2.34 ± 0.73) × 10 -4 | - | - |
| 系数 γi (mol·mol-1) | (7.02 ± 0.68) × 10 -4 | - | - | (2.08 ± 0.35) × 10 -3 | - | - |
| 最大气孔导度 gs-max (mol·m-2·s-1) | 0.686 ± 0.154 a | 0.615 ± 0.161 a | 0.666 ± 0.151 a | 0.481 ± 0.023 a | 0.438 ± 0.013 a | 0.471 ± 0.023 a |
| 常数 Cs0(mol·mol-1) | - | 6 725.12 ± 3 765.30 | - | - | 2 781.66 ± 792.63 | - |
| 最小气孔导度 gs-min (mol·m-2·s-1) | 0.271 ± 0.062 a | - | 0.279 ± 0.066 a | 0.297 ± 0.018 a | - | 0.293 ± 0.020 a |
| CO2浓度 Cs-min (μmol·mol-1) | 741.45 ± 143.22 a | - | 732.78 ± 133.14 a | 1 112.43 ± 149.31 a | - | 1 200.34 ± 200.38 a |
| 确定系数 R2 | 0.995 1 | 0.727 3 | - | 0.994 1 | 0.984 2 | - |
| [1] | Allen LH, Kakani VG, Vu JCV, Boote KJ (2011). Elevated CO2 increases water use efficiency by sustaining photosynthesis of water-limited maize and Sorghum. Journal of Plant Physiology, 168,1909-1918. |
| [2] | Ball JT, Woodrow IE, Berry JA (1987). A model predicting stomatal conductance and its contribution to the control of photosynthesis under different environmental conditions //Biggens J. Progress in Photosynthesis Research. Martinus Nijhoff Publishers,Dordrecht. 221-224. |
| [3] |
Batke SP, Yiotis C, Elliott-Kingston C, Holohan A, McElwain J (2020). Plant responses to decadal scale increments in atmospheric CO2 concentration: comparing two stomatal conductance sampling methods. Planta, 251, 52. DOI: 10.1007/s00425-020-03343-z.
DOI URL |
| [4] |
Bonan GB (2008). Forests and climate change: forcings, feedbacks, and the climate benefits of forests. Science, 320, 1444-1449.
DOI URL |
| [5] | Buckley TN, Mott KA (2013). Modelling stomatal conductance in response to environmental factors. Plant, Cell & Environment, 36, 1691-1699. |
| [6] | Cheng XF, Zhang FY, Chai SX ( 2010). Stomatal response of spring wheat and related affecting factors under different irrigation treatments. Chinese Journal of Applied Ecology, 21, 36-40. |
| [ 成雪峰, 张凤云, 柴守玺 ( 2010). 春小麦对不同灌水处理的气孔反应及其影响因子. 应用生态学报, 21, 36-40.] | |
| [7] | Ding LK, Kan F, Li L, Yue N, Zhou LL, Wei GX ( 2019). Response model of maize to light and CO2 concentration in semi-arid area of central Gansu Province . Jiangsu Agricultural Sciences, 47, 86-91. |
| [ 丁林凯, 阚飞, 李玲, 岳宁, 周琳琳, 魏国孝 ( 2019). 陇中半干旱区玉米对光和CO2浓度的响应模型. 江苏农业科学, 47, 86-91.] | |
| [8] |
Drake JE, Power SA, Duursma RA, Medlyn BE, Aspinwall MJ, Choat B, Creek D, Eamus D, Maier C, Pfautsch S, Smith RA, Tjoelker MG, Tissue DT (2017). Stomatal and non-stomatal limitations of photosynthesis for four tree species under drought: a comparison of model formulations. Agricultural and Forest Meteorology, 247, 454-466.
DOI URL |
| [9] |
Farquhar GD, Caemmerer S, Berry JA (1980). A biochemical model of photosynthetic CO2 assimilation in leaves of C3 species. Planta, 149, 78-90.
DOI PMID |
| [10] | Flexas J, Díaz-Espejo A, Conesa MA, Coopman RE, Douthe C, Gago J, Gallé A, Galmés J, Medrano H, Ribas-Carbo M, Tomàs M, Niinemets Ü (2016). Mesophyll conductance to CO2 and Rubisco as targets for improving intrinsic water use efficiency in C3 plants. Plant, Cell & Environment, 39, 965-982. |
| [11] | Gao GL, Feng Q, Liu XD, Li W ( 2020). Simulating the leaf stomatal conductance of the desert riparian Tamarix ramosissima Ledeb. based on three empirical models. Acta Ecologica Sinica, 40, 3486-3494. |
| [ 高冠龙, 冯起, 刘贤德, 李伟 ( 2020). 三种经验模型模拟荒漠河岸柽柳叶片气孔导度. 生态学报, 40, 3486-3494.] | |
| [12] | Guo BH, Wang RS, Xiao HJ ( 2018). Response of leaf water potential and stomatal conductance of sea-buckthorn to water stress during seedling stage. Journal of Nuclear Agricultural Sciences, 32, 609-616. |
| [ 郭冰寒, 王若水, 肖辉杰 ( 2018). 沙棘苗期叶水势与气孔导度对水分胁迫的响应. 核农学报, 32, 609-616.] | |
| [13] | Guo FY, Ha R, Ma YP, Cao B ( 2019). Effects of elevated CO2 concentration on photosynthesis characteristics and biomass allocation of Lycium barbarum seedlings. Acta Botanica Boreali-Occidentalia Sinica, 39, 302-309. |
| [ 郭芳芸, 哈蓉, 马亚平, 曹兵 ( 2019). CO2浓度升高对宁夏枸杞苗木光合特性及生物量分配影响. 西北植物学报, 39, 302-309.] | |
| [14] |
Guo RP, Lin ZH, Mo XG, Yang CL (2010). Responses of crop yield and water use efficiency to climate change in the North China Plain. Agricultural Water Management, 97, 1185-1194.
DOI URL |
| [15] | Harley PC, Thomas RB, Reynolds JF, Strain BR (1992). Modelling photosynthesis of cotton grown in elevated CO2. Plant, Cell & Environment, 15, 271-282. |
| [16] |
Jarvis PG (1976). The interpretation of the variations in leaf water potential and stomatal conductance found in canopies in the field. Philosophical Transactions of the Royal Society of London B, Biological Sciences, 273, 593-610.
DOI URL |
| [17] |
Köhler IH, MacDonald AJ, Schnyder H (2016). Last-century increases in intrinsic water-use efficiency of grassland communities have occurred over a wide range of vegetation composition, nutrient inputs, and soil pH. Plant Physiology, 170, 881-890.
DOI PMID |
| [18] | Leuning R (1990). Modelling stomatal behavior and photosynthesis of Eucalyptus grandis. Australian Journal of Plant Physiology, 17, 159-175. |
| [19] | Leuning R (1995). A critical appraisal of a combined stomatal- photosynthesis model for C3 plants. Plant, Cell & Environment, 18, 339-355. |
| [20] |
Li F, Liu L, Zhang H, Wang QT, Guo LL, Hao LH, Zhang XX, Cao X, Liang WJ, Zheng YP ( 2018). Effects of CO2 concentrations on stomatal traits and gas exchange in leaves of soybean . Acta Agronomica Sinica, 44, 1212-1220.
DOI URL |
| [ 李菲, 刘亮, 张浩, 王清涛, 郭丽丽, 郝立华, 张茜茜, 曹旭, 梁伟佳, 郑云普 ( 2018). CO2浓度对大豆叶片气孔特征和气体交换参数的影响. 作物学报, 44, 1212-1220.] | |
| [21] | Li LX, Liu JM, Huang XL, Wang JC, Luo C, Liu JJ, Xiong X ( 2017). Response characteristic of Cinnamomum migaoseedling’s photosynthesis to CO2 in different conditions of nitrogen . Journal of Northeast Agricultural University, 48, 29-36. |
| [ 李丽霞, 刘济明, 黄小龙, 王军才, 骆畅, 柳嘉佳, 熊雪 ( 2017). 不同氮素条件米槁幼苗光合作用对CO2响应特征. 东北农业大学学报, 48, 29-36.] | |
| [22] | Li YX, Lou YS, Zhang FC ( 2011). Comparison of stomatal conductance models for winter wheat. Chinese Journal of Agrometeorology, 32, 106-110. |
| [ 李永秀, 娄运生, 张富存 ( 2011). 冬小麦气孔导度模型的比较. 中国农业气象, 32, 106-110.] | |
| [23] | Liu Y, Lei SG, Cheng LS, Cheng W, Bian ZF ( 2018). Effects of soil water content on stomatal conductance, transpiration, and photosynthetic rate of Caragana korshinskii under the influence of coal mining subsidence . Acta Ecologica Sinica, 38, 3069-3077. |
| [ 刘英, 雷少刚, 程林森, 程伟, 卞正富 ( 2018). 采煤塌陷影响下土壤含水量变化对柠条气孔导度、蒸腾与光合作用速率的影响. 生态学报, 38, 3069-3077.] | |
| [24] |
Medlyn BE, Duursma RA, Eamus D, Ellsworth DS, Prentice IC, Barton CVM, Crous KY, Angelis PDE, Freeman M, Wingate L (2011). Reconciling the optimal and empirical approaches to modelling stomatal conductance. Global Change Biology, 17, 2134-2144.
DOI URL |
| [25] | Miner GL, Bauerle WL (2017). Seasonal variability of the parameters of the Ball-Berry model of stomatal conductance in maize (Zea mays L.) and sunflower (Helianthus annuus L.) under well-watered and water-stressed conditions. Plant, Cell & Environment, 40, 1874-1886. |
| [26] |
Ren B, Li J, Tong XJ, Mu YM, Meng P, Zhang JS ( 2018). Simulation on photosynthetic-CO2 response of Quercus variabilis and Robinia pseudoacacia in the southern foot of the Taihang Mountain, China . Chinese Journal of Applied Ecology, 29, 1-10.
DOI PMID |
|
[ 任博, 李俊, 同小娟, 母艳梅, 孟平, 张劲松 ( 2018). 太行山南麓栓皮栎和刺槐光合作用-CO2响应模拟. 应用生态学报, 29, 1-10.]
PMID |
|
| [27] | Su WH, Zhang GF ( 2002). The effect of soil and air temperature on photosynthesis and transpiration of Primula sinopurpurea . Acta Botanica Boreali-Occidentalia Sinica, 22, 824-830. |
| [ 苏文华, 张光飞 ( 2002). 土壤温度与气温对紫花雪山报春光合作用和蒸腾作用的影响. 西北植物学报, 22, 824-830.] | |
| [28] | Tang XL, Cao YH, Zhou BZ, Zhou Y, Gu LH ( 2017). Comparison of light response modeling of photosynthesis in Castanopsis sclerophyllaleaves under different CO2 concentrations . Chinese Journal of Ecology, 36, 2060-2067. |
| [ 唐星林, 曹永慧, 周本智, 周燕, 顾连宏 ( 2017). 不同CO2浓度下苦槠(Castanopsis sclerophylla)叶片光合光响应模型模拟比较. 生态学杂志, 36, 2060-2067.] | |
| [29] |
Tao FL, Hayashi Y, Zhang Z, Sakamoto T, Yokozawa M (2008). Global warming, rice production and water use in China: developing a probabilistic assessment. Agricultural and Forest Meteorology, 148, 94-110.
DOI URL |
| [30] | Tuzet A, Perrier A, Leuning R (2003). A coupled model of stomatal conductance, photosynthesis and transpiration. Plant, Cell & Environment, 26, 1097-1116. |
| [31] | Wang HZ, Han L, Xu YL, Niu JL ( 2015). Model analysis of the stomatal conductance response to light in Populus pruinosa at different temperatures in the Taklimakan desert . Ecology and Environmental Sciences, 24, 741-748. |
| [ 王海珍, 韩路, 徐雅丽, 牛建龙 ( 2015). 不同温度下灰胡杨叶片气孔导度对光强响应的模型分析. 生态环境学报, 24, 741-748.] | |
| [32] | Wang JL ( 2009). Response of photosynthetic rate and stomatal conductance of oat to light intensity and CO2 concentration and its modeling . Acta Agriculturae Boreali-Sinica, 24, 134-137. |
| [ 王建林 ( 2009). 燕麦叶片光合速率、气孔导度对光强和CO2的响应与模拟. 华北农学报, 24, 134-137.] | |
| [33] | Wang JL, Wen XF ( 2010). Modeling the response of stomatal conductance to variable CO2 concentration and its physiological mechanism . Acta Ecologica Sinica, 30, 4815-4820. |
| [ 王建林, 温学发 ( 2010). 气孔导度对CO2浓度变化的模拟及其生理机制. 生态学报, 30, 4815-4820.] | |
| [34] |
Wang JL, Wen XF, Zhao FH, Fang QX, Yang XM ( 2012). Effects of doubled CO2 concentration on leaf photosynthesis, transpiration and water use efficiency of eight crop species . Chinese Journal of Plant Ecology, 36, 438-446.
DOI URL |
| [ 王建林, 温学发, 赵风华, 房全孝, 杨新民 ( 2012). CO2浓度倍增对8种作物叶片光合作用、蒸腾作用和水分利用效率的影响. 植物生态学报, 36, 438-446.] | |
| [35] | Wang QL, Zhou GS ( 2018). Comparisons between common stomatal conductance models under progressive drought in spring maize. Acta Ecologica Sinica, 38, 6846-6856. |
| [ 王秋玲, 周广胜 ( 2018). 春玉米持续干旱过程中常用气孔导度模型的比较研究. 生态学报, 38, 6846-6856.] | |
| [36] | Xing HL, Zhou WB, Hao WP, Li L, Wang C, Ma HY, Wang YS ( 2020). Inhibition of nitrogen increasing on maize growth under water stress. Chinese Journal of Agrometeorology, 41, 240-252. |
| [ 邢换丽, 周文彬, 郝卫平, 李丽, 王超, 马海洋, 王耀生 ( 2020). 水分胁迫下氮素增加对玉米生长的抑制作用. 中国农业气象, 41, 240-252.] | |
| [37] |
Ye ZP (2007). A new model for relationship between irradiance and the rate of photosynthesis in Oryza sativa. Photosynthetica, 45, 637-640.
DOI URL |
| [38] | Ye ZP ( 2010). A review on modeling of responses of photosynthesis to light and CO2 . Chinese Journal of Plant Ecology, 34, 727-740. |
| [ 叶子飘 ( 2010). 光合作用对光和CO2响应模型的研究进展. 植物生态学报, 34, 727-740.] | |
| [39] |
Ye ZP, Yu Q (2008). A coupled model of stomatal conductance and photosynthesis for winter wheat. Photosynthetica, 46, 637-640.
DOI URL |
| [40] | Ye ZP, Yu Q ( 2009a). Mechanism model of stomatal conductance. Chinese Journal of Plant Ecology, 33, 772-782. |
| [ 叶子飘, 于强 ( 2009a). 植物气孔导度的机理模型. 植物生态学报, 33, 772-782.] | |
| [41] | Ye ZP, Yu Q ( 2009b). A comparison of response curves of winter wheat photosynthesis to flag leaf intercellular and air CO2 concentrations . Chinese Journal of Ecology, 28, 2233-2238. |
| [ 叶子飘, 于强 ( 2009b). 光合作用对胞间和大气CO2响应曲线的比较. 生态学杂志, 28, 2233-2238.] | |
| [42] |
Yu Q, Zhang YQ, Liu YF, Shi PL (2004). Simulation of the stomatal conductance of winter wheat in response to light, temperature and CO2 changes. Annals of Botany, 93, 435-441.
DOI URL |
| [43] | Zheng FY, Peng SL ( 2003). Responses of plant stomatal conductance to elevated CO2 at different scales . Chinese Journal of Ecology, 22, 26-30. |
| [ 郑凤英, 彭少麟 ( 2003). 不同尺度上植物叶气孔导度对升高CO2的响应. 生态学杂志, 22, 26-30.] | |
| [44] |
Zhong C, Zhu Y ( 2013). Response of stomatal conductance to light in tobacco plants. Chinese Journal of Eco- Agriculture, 21, 966-972.
DOI URL |
| [ 钟楚, 朱勇 ( 2013). 烟草气孔导度对光强的响应. 中国生态农业学报, 21, 966-972.] |
| [1] | LI Wei-Bin, ZHANG Hong-Xia, ZHANG Yu-Shu, CHEN Ni-Na. Influence of diurnal asymmetric warming on carbon sink capacity in a broadleaf Korean pine forest in Changbai Mountains, China [J]. Chin J Plant Ecol, 2023, 47(9): 1225-1233. |
| [2] | JIANG Hai-Gang, ZENG Yun-Hong, TANG Hua-Xin, LIU Wei, LI Jie-Lin, HE Guo-Hua, QIN Hai-Yan, WANG Li-Chao, Victor RESCO de DIOS, YAO Yin-An. Rhythmic regulation of carbon fixation and water dissipation in three mosses [J]. Chin J Plant Ecol, 2023, 47(7): 988-997. |
| [3] | WANG Jia-Yi, WANG Xiang-Ping, XU Cheng-Yang, XIA Xin-Li, XIE Zong-Qiang, FENG Fei, FAN Da-Yong. Response of hydraulic architecture in Fraxinus velutina street trees to the percentage of impervious pavement in Beijing [J]. Chin J Plant Ecol, 2023, 47(7): 998-1009. |
| [4] | LIU Hai-Yan, ZANG Sha-Sha, ZHANG Chun-Xia, ZUO Jin-Cheng, RUAN Zuo-Xi, WU Hong-Yan. Photochemical reaction of photosystem II in diatoms under phosphorus starvation and its response to high light intensity [J]. Chin J Plant Ecol, 2023, 47(12): 1718-1727. |
| [5] | MA Yan-Ze, YANG Xi-Lai, XU Yan-Sen, FENG Zhao-Zhong. Response of key parameters of leaf photosynthetic models to increased ozone concentration in four common trees [J]. Chin J Plant Ecol, 2022, 46(3): 321-329. |
| [6] | YUAN Yuan, MU Yan-Mei, DENG Yu-Jie, LI Xin-Hao, JIANG Xiao-Yan, GAO Sheng-Jie, ZHA Tian- Shan, JIA Xin. Effects of land cover and phenology changes on the gross primary productivity in an Artemisia ordosica shrubland [J]. Chin J Plant Ecol, 2022, 46(2): 162-175. |
| [7] | WANG Jing-Yuan, WEI Jie, WEN Xue-Fa. Progress in the theory, hypothesis and application of the methods measuring soil CO2 flux gradient [J]. Chin J Plant Ecol, 2022, 46(12): 1523-1536. |
| [8] | ZHENG Zhou-Tao, ZHANG Yang-Jian. Variation in ecosystem water use efficiency and its attribution analysis during 1982-2018 in Qingzang Plateau [J]. Chin J Plant Ecol, 2022, 46(12): 1486-1496. |
| [9] | WU Lin-Sheng, ZHANG Yong-Guang, ZHANG Zhao-Ying, ZHANG Xiao-Kang, WU Yun-Fei. Remote sensing of solar-induced chlorophyll fluorescence and its applications in terrestrial ecosystem monitoring [J]. Chin J Plant Ecol, 2022, 46(10): 1167-1199. |
| [10] | JIN Chuan, LI Xin-Hao, JIANG Yan, XU Ming-Ze, TIAN Yun, LIU Peng, JIA Xin, ZHA Tian- Shan. Relative changes and regulation of photosynthetic energy partitioning components in Artemisia ordosica during growing season [J]. Chin J Plant Ecol, 2021, 45(8): 870-879. |
| [11] | WU Hong-Min, SHUANG Sheng-Pu, ZHANG Jin-Yan, CUN Zhu, MENG Zhen-Gui, LI Long-Gen, SHA Ben-Cai, CHEN Jun-Wen. Photodamage to photosystem in a typically shade-tolerant species Panax notoginseng exposed to a sudden increase in light intensity [J]. Chin J Plant Ecol, 2021, 45(4): 404-419. |
| [12] | CHEN Sheng-Nan, CHEN Zuo-Si-Nan, ZHANG Zhi-Qiang. Canopy stomatal conductance characteristics of Pinus tabulaeformis and Acer truncatum and their responses to environmental factors in the mountain area of Beijing [J]. Chin J Plant Ecol, 2021, 45(12): 1329-1340. |
| [13] | LI Jing, WANG Xin, WANG Zhen-Hua, WANG Bin, WANG Cheng-Zhang, DENG Mei-Feng, LIU Ling-Li. Effects of ozone and aerosol pollution on photosynthesis of poplar leaves [J]. Chin J Plant Ecol, 2020, 44(8): 854-863. |
| [14] | FENG Zhao-Zhong, LI Pin, ZHANG Guo-You, LI Zheng-Zhen, PING Qin, PENG Jin-Long, LIU Shuo. Impacts of elevated carbon dioxide concentration on terrestrial ecosystems: problems and prospective [J]. Chin J Plant Ecol, 2020, 44(5): 461-474. |
| [15] | LI Xu, WU Ting, CHENG Yan, TAN Na-Dan, JIANG Fen, LIU Shi-Zhong, CHU Guo-Wei, MENG Ze, LIU Ju-Xiu. Ecophysiological adaptability of four tree species in the southern subtropical evergreen broad-leaved forest to warming [J]. Chin J Plant Ecol, 2020, 44(12): 1203-1214. |
| Viewed | ||||||
|
Full text |
|
|||||
|
Abstract |
|
|||||
Copyright © 2026 Chinese Journal of Plant Ecology
Tel: 010-62836134, 62836138, E-mail: apes@ibcas.ac.cn, cjpe@ibcas.ac.cn
![]()