
植物生态学报 ›› 2007, Vol. 31 ›› Issue (1): 23-31.DOI: 10.17521/cjpe.2007.0004
李素英( ), 李晓兵(), 莺歌, 符娜
收稿日期:2006-05-09
接受日期:2006-08-28
出版日期:2007-05-09
发布日期:2007-01-30
通讯作者:
李晓兵
作者简介:*E-mail: xbli@ires.cn基金资助:
LI Su-Ying(), LI Xiao-Bing(), YING Ge, FU Na
Received:2006-05-09
Accepted:2006-08-28
Online:2007-05-09
Published:2007-01-30
Contact:
LI Xiao-Bing
About author:First author contact:E-mail of the first author: lisuying@ires.cn
摘要:
利用遥感估测地上生物量是国内外生态学与地理学的研究热点。但基于植被指数的生物量回归模型结果差异较大,究竟哪种植被指数与哪种模型更适合典型草原的生物量反演,是现代草地遥感急需解决的问题之一。该文基于TM影像数据的不同植被指数(VI)差异性,分别选取了RVI(比值植被指数)、NDVI(归一化差异植被指数)、SAVI(土壤调节植被指数)、MASVI(修改型土壤调整植被指数)和RSR(简化比率植被指数)5种植被指数,与同期的内蒙古典型草原区地面实测地上生物量做相关分析,分别建立了5种植被指数与地上生物量的线性及3种非线性(对数、二次多项式、三次多项式)回归模型。研究结果表明:对于中国北方典型草原区而言,地上生物量与5种植被指数(RVI、NDVI、SAVI、MSAVI和RSR)均呈现出显著相关,但地上生物量与后4种植被指数是正相关,与RVI为负相关;利用5种植被指数(RVI、NDVI、SAVI、MSAVI和RSR)监测草地植被生物量的复相关系数均大于0.6,充分说明利用植被指数检测典型草原生物量是一种简单可行的方法;NDVI建立的生物量回归模型,其复相关系数大于其它4类植被指数(RVI、SAVI、MSAVI和RSR),说明NDVI-生物量模型优于植被指数RVI、SAVI、MSAVI和RSR 模型,其模拟地表生物量的效果好;对于TM影像来说,植被生物量的线性模型与3种非线性模型(三次多项式生物量模型、二次多项式生物量模型、对数模型)都表现出较好的模拟效果,都通过了0.01的显著性检验,而且该研究的结果显示出三次多项式生物量回归模型最优,其次是二次多项式生物量模型,再次是线性模型,相对较差的是对数模型。通过NDVI-生物量三次多项式回归模型模拟锡林浩特草原的生物量,可以看出整个研究区的地上生物量基本上是东高西低、东南高西北低的趋势,这与研究区的地形、气候及土地利用等多种因素有关。
李素英, 李晓兵, 莺歌, 符娜. 基于植被指数的典型草原区生物量模型——以内蒙古锡林浩特市为例. 植物生态学报, 2007, 31(1): 23-31. DOI: 10.17521/cjpe.2007.0004
LI Su-Ying, LI Xiao-Bing, YING Ge, FU Na. VEGETATION INDEXES-BIOMASS MODELS FOR TYPICAL SEMI-ARID STEPPE—A CASE STUDY FOR XILINHOT IN NORTHERN CHINA. Chinese Journal of Plant Ecology, 2007, 31(1): 23-31. DOI: 10.17521/cjpe.2007.0004
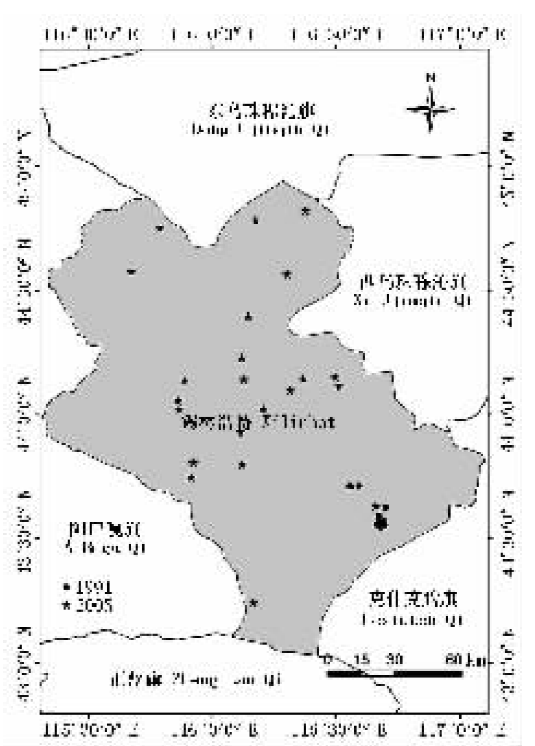
图1 调查样地分布图
Fig.1 The map of research plot in typical steppe of Inner Mongolia
| 中文名称 Chinese name | 英文缩写 English abbreviation | 计算公式 Formula | 作者(年代) Author(year) | |||||||||||||
|---|---|---|---|---|---|---|---|---|---|---|---|---|---|---|---|---|
| 比值植被指数 Ratio vegetation index | RVI | R/NIR | Pearson et al., 1972 | |||||||||||||
| 归一化差异植被指数 Normalized difference vegetation index | NDVI | (NIR-R)/(NIR+R) | Rouse et al., | |||||||||||||
| 土壤调节植被指数 Soil-adjusted vegetation index | SAVI | | Huete, | |||||||||||||
| 修改型土壤调整植被指数 Modified soil-adjusted vegetation index | MSAVI | | Qi et al., | |||||||||||||
| 简化比率指数 Reduced simple ratio | RSR | | Brown et al., | |||||||||||||
表1 植被指数表
Table 1 The vegetation index
| 中文名称 Chinese name | 英文缩写 English abbreviation | 计算公式 Formula | 作者(年代) Author(year) | |||||||||||||
|---|---|---|---|---|---|---|---|---|---|---|---|---|---|---|---|---|
| 比值植被指数 Ratio vegetation index | RVI | R/NIR | Pearson et al., 1972 | |||||||||||||
| 归一化差异植被指数 Normalized difference vegetation index | NDVI | (NIR-R)/(NIR+R) | Rouse et al., | |||||||||||||
| 土壤调节植被指数 Soil-adjusted vegetation index | SAVI | | Huete, | |||||||||||||
| 修改型土壤调整植被指数 Modified soil-adjusted vegetation index | MSAVI | | Qi et al., | |||||||||||||
| 简化比率指数 Reduced simple ratio | RSR | | Brown et al., | |||||||||||||
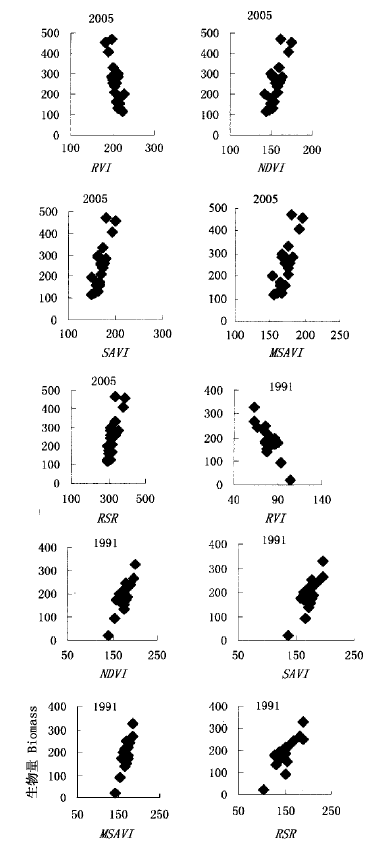
图2 地上生物量与TM植被指数的散点图 RVI、MDVI、SAVI、MAVI、RSR:见表1 See Table 1
Fig.2 The scatter map between the vegetation biomass and the vegetation index of TM
| 生物量 Biomass | 比值植被指数 RVI | 归一化差异 植被指数 NDVI | 土壤调节 植被指数 SAVI | 修改型土壤调 整植被指数 MSAVI | 简化比率植 被指数 RSR | |
|---|---|---|---|---|---|---|
| 生物量Biomass | 1 | -0.786** | 0.797** | 0.788** | 0.787** | 0.782** |
| 比值植被指数RVI | 1 | -0.997** | -0.994** | -1.000** | -0.938** | |
| 归一化差异植被指数NDVI | 1 | 0.996** | 0.998** | 0.951** | ||
| 土壤调节植被指数SAVI | 1 | 0.994** | 0.945** | |||
| 修改型土壤调整植被指数MSAVI | 1 | 0.939** | ||||
| 简化比率植被指数RSR | 1 |
表2 地上生物量与TM影像植被指数的相关性表
Table 2 Correlations between biomass and vegetation index
| 生物量 Biomass | 比值植被指数 RVI | 归一化差异 植被指数 NDVI | 土壤调节 植被指数 SAVI | 修改型土壤调 整植被指数 MSAVI | 简化比率植 被指数 RSR | |
|---|---|---|---|---|---|---|
| 生物量Biomass | 1 | -0.786** | 0.797** | 0.788** | 0.787** | 0.782** |
| 比值植被指数RVI | 1 | -0.997** | -0.994** | -1.000** | -0.938** | |
| 归一化差异植被指数NDVI | 1 | 0.996** | 0.998** | 0.951** | ||
| 土壤调节植被指数SAVI | 1 | 0.994** | 0.945** | |||
| 修改型土壤调整植被指数MSAVI | 1 | 0.939** | ||||
| 简化比率植被指数RSR | 1 |
| 年 Year | 植被指数 VI | 模型类型 Model types | 模型 Model | 复相关系数 Multiple correlation coefficient |
|---|---|---|---|---|
| 2005 (n=22) | RVI | 线性 Linear model | y=-7.565x+1 829.100 | R2=0.617 |
| 对数 Logarithm model | y=-1 565.600ln(x)+8 610.100 | R2=0.624 | ||
| 二次多项式Second-degree polynomial model | y=0.090x2-44.561x+5 639.400 | R2=0.636 | ||
| 三次多项式Cubic polynomial model | y=0.007x3-4.120x2+820.270x-53 430.000 | R2=0.649 | ||
| NDVI | 线性 Linear model | y=10.022x-1 308.000 | R2=0.636 | |
| 对数 Logarithm model | y=1 575.100ln(x)-7 696.800 | R2=0.631 | ||
| 二次多项式Second-degree polynomial model | y=0.081x2-15.622x+716.520 | R2=0.641 | ||
| 三次多项式Cubic polynomial model | y=-0.016x3+7.450x2-1 182.000x+62 109.000 | R2=0.654 | ||
| SAVI | 线性 Linear model | y=6.708x-885.270 | R2=0.621 | |
| 对数 Logarithm model | y=1 147.500ln(x)-5 635.900 | R2=0.612 | ||
| 二次多项式Second-degree polynomial model | y=0.043x2-8.245x+404.440 | R2=0.629 | ||
| 三次多项式Cubic polynomial model | y=-0.005x3 +2.681x2-464.400x+26 579.000 | R2=0.644 | ||
| MSAVI | 线性 Linear model | y=7.584x-1 055.2 | R2=0.619 | |
| 对数 Logarithm model | y=1 305.800ln(x)-6 470.100 | R2=0.609 | ||
| 二次多项式Second-degree polynomial model | y =0.089x2-23.343x+1 632.400 | R2=0.637 | ||
| 三次多项式Cubic polynomial model | y=-0.007x3+3.691x2-651.320x+37 995.000 | R2=0.650 | ||
| RSR | 线性 Linear model | y=3.039x-733.520 | R2=0.611 | |
| 对数 Logarithm model | y=1 027.500ln(x)-5 685.700 | R2=0.615 | ||
| 二次多项式Second-degree polynomial model | y=-0.010x2+9.835x-1 876.900 | R2=0.617 | ||
| 三次多项式Cubic polynomial model | y=0.001x3-0.512x2+179.380x-20 874.000 | R2=0.623 | ||
| 1991 (n=18) | RVI | 线性 Linear model | y=-5.593x+631.780 | R2=0.763 |
| 对数 Logarithm model | y=-447.920ln(x)+2 143.500 | R2=0.757 | ||
| 二次多项式Second-degree polynomial model | y=-0.010x2-4.033 1x+568.820 | R2=0.764 | ||
| 三次多项式Cubic polynomial model | y=-0.009x3+2.156x2-181.050x+5 315.200 | R2=0.814 | ||
| NDVI | 线性 Linear model | y=4.033x-515.400 | R2=0.771 | |
| 对数 Logarithm model | y=687.180ln(x)-3 356.500 | R2=0.773 | ||
| 二次多项式Second-degree polynomial model | y=-0.007x2+6.362x-714.010 | R2=0.772 | ||
| 三次多项式Cubic polynomial model | y=0.003x3-1.748x2+301.240x-17 238.000 | R2=0.832 | ||
| SAVI | 线性 Linear model | y=4.115x-520.190 | R2=0.724 | |
| 对数 Logarithm model | y=684.560ln(x)-3 334.000 | R2=0.722 | ||
| 二次多项式Second-degree polynomial model | y=0.002x2+3.582x-475.530 | R2=0.724 | ||
| 三次多项式Cubic polynomial model | y=0.003x3-1.607x2+269.170x-14 959.000 | R2=0.768 | ||
| MSAVI | 线性 Linear model | y=5.563x-745.670 | R2=0.721 | |
| 对数 Logarithm model | y=919.220ln(x)-4 519.500 | R2=0.724 | ||
| 二次多项式Second-degree polynomial model | y=-0.023x2+13.199x-1 375.500 | R2=0.723 | ||
| 三次多项式Cubic polynomial model | y=0.012x3-5.791x2+960.330x-53 029.000 | R2=0.799 | ||
| RSR | 线性 Linear model | y=2.508x-190.730 | R2=0.687 | |
| 对数 Logarithm model | y=376.490ln(x)-1 697.000 | R2=0.699 | ||
| 二次多项式Second-degree polynomial model | y=-0.009x2+5.271x-397.490 | R2=0.695 | ||
| 三次多项式Cubic polynomial model | y=0.001x3-0.550x2+83.298x-4 067.300 | R2=0.757 |
表3 TM影像的植被指数与植被地上生物量的回归模型
Table 3 Regression model from the vegetation biomass and the vegetation index (VI) of TM image
| 年 Year | 植被指数 VI | 模型类型 Model types | 模型 Model | 复相关系数 Multiple correlation coefficient |
|---|---|---|---|---|
| 2005 (n=22) | RVI | 线性 Linear model | y=-7.565x+1 829.100 | R2=0.617 |
| 对数 Logarithm model | y=-1 565.600ln(x)+8 610.100 | R2=0.624 | ||
| 二次多项式Second-degree polynomial model | y=0.090x2-44.561x+5 639.400 | R2=0.636 | ||
| 三次多项式Cubic polynomial model | y=0.007x3-4.120x2+820.270x-53 430.000 | R2=0.649 | ||
| NDVI | 线性 Linear model | y=10.022x-1 308.000 | R2=0.636 | |
| 对数 Logarithm model | y=1 575.100ln(x)-7 696.800 | R2=0.631 | ||
| 二次多项式Second-degree polynomial model | y=0.081x2-15.622x+716.520 | R2=0.641 | ||
| 三次多项式Cubic polynomial model | y=-0.016x3+7.450x2-1 182.000x+62 109.000 | R2=0.654 | ||
| SAVI | 线性 Linear model | y=6.708x-885.270 | R2=0.621 | |
| 对数 Logarithm model | y=1 147.500ln(x)-5 635.900 | R2=0.612 | ||
| 二次多项式Second-degree polynomial model | y=0.043x2-8.245x+404.440 | R2=0.629 | ||
| 三次多项式Cubic polynomial model | y=-0.005x3 +2.681x2-464.400x+26 579.000 | R2=0.644 | ||
| MSAVI | 线性 Linear model | y=7.584x-1 055.2 | R2=0.619 | |
| 对数 Logarithm model | y=1 305.800ln(x)-6 470.100 | R2=0.609 | ||
| 二次多项式Second-degree polynomial model | y =0.089x2-23.343x+1 632.400 | R2=0.637 | ||
| 三次多项式Cubic polynomial model | y=-0.007x3+3.691x2-651.320x+37 995.000 | R2=0.650 | ||
| RSR | 线性 Linear model | y=3.039x-733.520 | R2=0.611 | |
| 对数 Logarithm model | y=1 027.500ln(x)-5 685.700 | R2=0.615 | ||
| 二次多项式Second-degree polynomial model | y=-0.010x2+9.835x-1 876.900 | R2=0.617 | ||
| 三次多项式Cubic polynomial model | y=0.001x3-0.512x2+179.380x-20 874.000 | R2=0.623 | ||
| 1991 (n=18) | RVI | 线性 Linear model | y=-5.593x+631.780 | R2=0.763 |
| 对数 Logarithm model | y=-447.920ln(x)+2 143.500 | R2=0.757 | ||
| 二次多项式Second-degree polynomial model | y=-0.010x2-4.033 1x+568.820 | R2=0.764 | ||
| 三次多项式Cubic polynomial model | y=-0.009x3+2.156x2-181.050x+5 315.200 | R2=0.814 | ||
| NDVI | 线性 Linear model | y=4.033x-515.400 | R2=0.771 | |
| 对数 Logarithm model | y=687.180ln(x)-3 356.500 | R2=0.773 | ||
| 二次多项式Second-degree polynomial model | y=-0.007x2+6.362x-714.010 | R2=0.772 | ||
| 三次多项式Cubic polynomial model | y=0.003x3-1.748x2+301.240x-17 238.000 | R2=0.832 | ||
| SAVI | 线性 Linear model | y=4.115x-520.190 | R2=0.724 | |
| 对数 Logarithm model | y=684.560ln(x)-3 334.000 | R2=0.722 | ||
| 二次多项式Second-degree polynomial model | y=0.002x2+3.582x-475.530 | R2=0.724 | ||
| 三次多项式Cubic polynomial model | y=0.003x3-1.607x2+269.170x-14 959.000 | R2=0.768 | ||
| MSAVI | 线性 Linear model | y=5.563x-745.670 | R2=0.721 | |
| 对数 Logarithm model | y=919.220ln(x)-4 519.500 | R2=0.724 | ||
| 二次多项式Second-degree polynomial model | y=-0.023x2+13.199x-1 375.500 | R2=0.723 | ||
| 三次多项式Cubic polynomial model | y=0.012x3-5.791x2+960.330x-53 029.000 | R2=0.799 | ||
| RSR | 线性 Linear model | y=2.508x-190.730 | R2=0.687 | |
| 对数 Logarithm model | y=376.490ln(x)-1 697.000 | R2=0.699 | ||
| 二次多项式Second-degree polynomial model | y=-0.009x2+5.271x-397.490 | R2=0.695 | ||
| 三次多项式Cubic polynomial model | y=0.001x3-0.550x2+83.298x-4 067.300 | R2=0.757 |
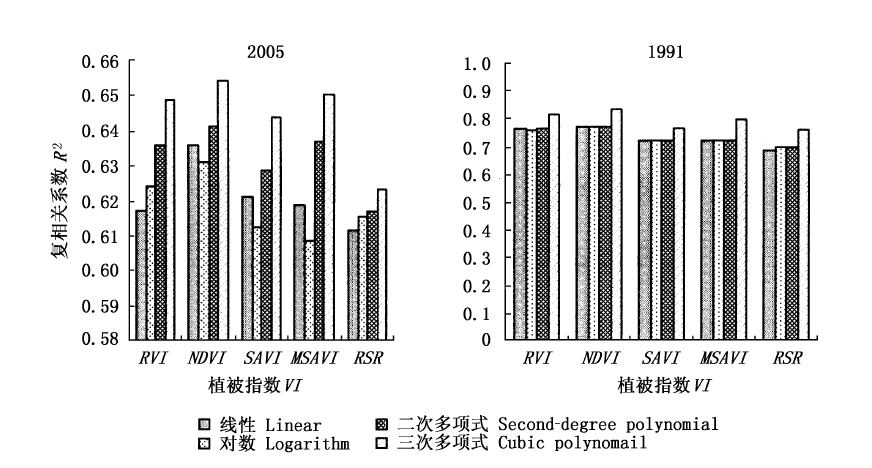
图3 植被指数-生物量回归模型的复相关系数图 RVI、MDVI、SAVI、MAVI、RSR:见表1 See Table 1
Fig.3 Contrast of correlation parameters of regression model on different vegetation index (VI)
| 实测值 Observation value | 模拟值* Simulation value | 差值(实测值-模拟值) Subtraction (observation value-simulation value) | 百分比(%)(差值/实测值) Percentage (subtraction/observation value) | |
|---|---|---|---|---|
| 1 | 231.73 | 198.10 | 33.63 | 15.14 |
| 2 | 154.43 | 156.30 | -1.87 | -1.21 |
| 3 | 178.80 | 177.30 | 1.50 | 0.84 |
| 4 | 179.60 | 214.20 | -34.59 | -19.26 |
| 5 | 163.65 | 255.00 | -91.35 | -55.82 |
| 6 | 260.00 | 255.00 | 5.00 | 1.92 |
| 7 | 283.00 | 244.30 | 38.80 | 13.71 |
| 8 | 144.27 | 153.40 | -9.13 | -6.33 |
| 9 | 189.07 | 164.10 | 24.97 | 13.21 |
| 10 | 191.23 | 174.30 | 16.93 | 8.85 |
| 11 | 201.47 | 226.20 | -24.73 | -12.28 |
| 12 | 164.67 | 174.60 | -9.93 | -6.03 |
| 13 | 269.90 | 250.10 | 19.80 | 7.34 |
| 14 | 61.33 | 54.60 | 6.73 | 10.98 |
表4 生物量实测值与NDVI三次多项式模型模拟值的误差表
Table 4 Error contrast of the observation value and the simulation value based on the experiential model
| 实测值 Observation value | 模拟值* Simulation value | 差值(实测值-模拟值) Subtraction (observation value-simulation value) | 百分比(%)(差值/实测值) Percentage (subtraction/observation value) | |
|---|---|---|---|---|
| 1 | 231.73 | 198.10 | 33.63 | 15.14 |
| 2 | 154.43 | 156.30 | -1.87 | -1.21 |
| 3 | 178.80 | 177.30 | 1.50 | 0.84 |
| 4 | 179.60 | 214.20 | -34.59 | -19.26 |
| 5 | 163.65 | 255.00 | -91.35 | -55.82 |
| 6 | 260.00 | 255.00 | 5.00 | 1.92 |
| 7 | 283.00 | 244.30 | 38.80 | 13.71 |
| 8 | 144.27 | 153.40 | -9.13 | -6.33 |
| 9 | 189.07 | 164.10 | 24.97 | 13.21 |
| 10 | 191.23 | 174.30 | 16.93 | 8.85 |
| 11 | 201.47 | 226.20 | -24.73 | -12.28 |
| 12 | 164.67 | 174.60 | -9.93 | -6.03 |
| 13 | 269.90 | 250.10 | 19.80 | 7.34 |
| 14 | 61.33 | 54.60 | 6.73 | 10.98 |
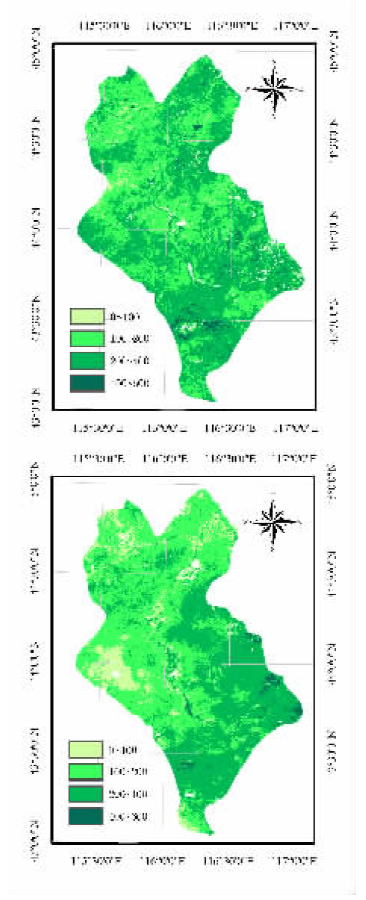
图4 基于NDVI-生物量三次多项式模型的锡林浩特地上生物量分布图
Fig.4 The map of biomass based on NDVI model in Xilinhot
| [1] | Brown L, Chen J, Leblanc S, Cihlar J (2000). A shortwave infrared modification to the simple ratio for LAI retrieval in boreal forests: an image and model analysis . Remote Sensing of Environment, 71,16-25. |
| [2] | Cheng Q (程乾), Huang JF (黄敬峰), Wang RC (王人潮) (2005). Preliminary analysis of difference between MODIS and NOAA/AVHRR vegetation indices. Bulletin of Science and Technology (科技通报), 21,205-209. (in Chinese with English abstract) |
| [3] | Fabio M, Stefano R, Lorenzo B, Gaetano Z (2003). Use of NOAA-AVHRR NDVI images for the estimation of dynamic fire risk in Mediterranean areas. Remote Sensing of Environment, 86,187-197. |
| [4] | Fernando S, Gong P, Manuel F (2005). Land cover assessment with MODIS imagery in southern African Miombo ecosystems. Remote Sensing of Environment, 98,429-441. |
| [5] | Hame T, Salli A, Andersson K (1997). A new methodology for the estimation of biomass of conifer dominated boreal forest using NOAA/AVHRR data. International Journal of Remote Sensing, 18,3211-3243. |
| [6] | Huang JF (黄敬峰), Wang XZ (王秀珍), Hu XB (胡新博) (1999). Studies on grass yield monitoring for different natural grassland types using remote sensing data in northern Xinjiang. Grassland of China (中国草地), (1),7-11. (in Chinese with English abstract) |
| [7] | Huete AR (1988). A soil adjusted vegetation index (SAVI). Remote Sensing of Environment, 25,295-309. |
| [8] | Lefsky MA, Harding D, Cohen WB (1999). Surface lidar remote sensing of basal area and biomass in deciduous forests of eastern Maryland, USA. Remote Sensing of Environment, 67,83-98. |
| [9] | Li J (李净), Wang J (王建) (2004). Estimating plant biomass in Junma Chang of Shandan County using Landsat TM data. Remote Sensing Technology and Application (遥感技术与应用), 19,343-347. (in Chinese with English abstract) |
| [10] | Li JL (李建龙), Jiang P (蒋平), Dai RL (戴若兰) (1998). Advances in study on the remote sensing technology and GPS and GIS integration systems in estimating grassland yield applications in the north of Xinjiang, China. Acta Ecologica Sinica (生态学报), 18,504-510. (in Chinese with English abstract) |
| [11] | Ma XZ (马秀枝), Wang YF (王艳芬), Wang SP (汪诗平), Wang JZ (王金枝), Li CS (李长生) (2005). Impacts of grazing on soil carbon fraction in the grasslands of Xilin River Basin, Inner Mongolia. Acta Phytoecologica Sinina (植物生态学报), 29,569-576. (in Chinese with English abstract) |
| [12] | Michael JH, Peter JV, Peter E, Graham ED (1999). Pasture land cover in eastern Australia from NOAA-AVHRR NDVI and classified Landsat TM. Remote Sensing of Environment, 67,32-50. |
| [13] | Miina R (2005). Retrieval of leaf area index for a coniferous forest by inverting a forest reflectance model. Remote Sensing of Environment, 99,295-303. |
| [14] | Niu ZC (牛志春), Ni SX (倪绍祥) (2003). Study on models for monitoring of grassland biomass around Qinghai Lake assisted by remote sensing. Acta Geographica Sinica (地理学报), 58,695-702. (in Chinese with English abstract) |
| [15] | Pieter SA, Clement A, Kjell AH, Bernt J, Andrew KS (2006). Improved monitoring of vegetation dynamics at very high latitudes: a new method using MODIS NDVI. Remote Sensing of Environment, 100,321-334. |
| [16] | Qi J, Chehbouni A, Huete AR, Kerr Y (1994). A modified soil adjusted vegetation index. Remote Sensing of Environment, 48,119-126. |
| [17] | Rouse JW, Haas RH, Schell JA, Deering DW (1974). Monitoring vegetation systems in the Great Plains with ERTS. In: Freden SC, Becker M eds. Proceedings of Third Earth Resources Technology Satellite—1Symposium. NASA SP-351, Greenbelt,310-317. |
| [18] | Steven MD, Biscoe PV, Jaggard KW (1983). Estimation of sugar beet productivity from reflection in the red and infrared spectral bands. International Journal of Remote Sensing, 4,325-334. |
| [19] | Sun R (孙睿), Zhu QJ (朱启疆) (2000). Distribution and seasonal change of net primary productivity in China from April, 1992 to March, 1993. Acta Geographica Sinica (地理学报), 55,36-45. (in Chinese with English abstract) |
| [20] | Todd SW, Hoffer RM, Milchunas DG (1998). Biomass estimation on grazed and ungrazed rangelands using spectral indices. International Journal Remote Sensing, 19,427-438. |
| [21] | Tong C (仝川), Yong WY (雍伟义), Wu YN (乌云娜), Zhao LQ (赵利清), Jiang C (姜超), Yong SP (雍世鹏) (2001). Change in the spatial structure of grassland vegetation in the Xilin River Basin from 1985 to 1999. Acta Scientiarum Naturalium Universitatis Neimongol (内蒙古大学学报), 32,562-566. (in Chinese with English abstract) |
| [22] | Wang H (王宏), Li XB (李晓兵), Yu HJ (余弘婧) (2006). Monitoring growing season of typical steppe in northern China based on NOAA/AVHRR NDVI data . Journal of Plant Ecology (植物生态学报), 30,365-374. (in Chinese with English abstract) |
| [23] | Wang XZ (王兮之), Du GZ (杜国桢), Liang TG (梁天刚), Dai RL (戴若兰), Wang G (王刚) (2001). The establishment of grassland productive assessment model and the determination of precipitation resource distribution pattern of Gannan Tibetan Autonomous prefecture based on RS and GIS. Acta Prataculturae Sinica (草业学报), 10,95-102. (in Chinese with English abstract) |
| [24] | Wang ZX (王正兴), Liu C (刘闯), Zhao BR (赵冰茹), Liu AJ (刘爱军) (2005). ANPP estimate from MODIS-EVI for the grassland region of Xilingol, China. Journal of Lanzhou University (Natural Sciences) (兰州大学学报(自然科学版)), 41(2),10-16. (in Chinese with English abstract) |
| [25] | Xiao QG (肖乾广), Zhou SS (周嗣松), Chen WY (陈维英), Zhang LX (张丽霞), Lin CG (赁常恭), Xiao SZ (肖淑招), Meng XY (盂宪钺), Zhao ZK (赵忠凯), Zhang GZ (张桂宗) (1986). Productivity estimate using meteorological satellite. Journal of Remote Sensing (遥感学报), 1,37-43. (in Chinese with English abstract) |
| [26] | Yu F (喻锋), Li XB (李晓兵), Wang H (王宏), Yu HJ (余弘婧), Chen JH (陈云浩) (2005). Land cover classification in China based on the NDVI-Ts feature space. Acta Phytoecologica Sinica (植物生态学报), 29,934-944. (in Chinese with English abstract) |
| [27] | Zhao MS, Faith AH, Ramakrishna RN, Steven W (2005). Improvements of the MODIS terrestrial gross and net primary production global data set. Remote Sensing of Environment, 95,164-176. |
| [1] | 黄玲, 王榛, 马泽, 杨发林, 李岚, SEREKPAYEV Nurlan, NOGAYEV Adilbek, 侯扶江. 长期放牧和氮添加对黄土高原典型草原长芒草种群生长的影响[J]. 植物生态学报, 2024, 48(3): 317-330. |
| [2] | 茹雅倩, 薛建国, 葛萍, 李钰霖, 李东旭, 韩鹏, 杨天润, 储伟, 陈章, 张晓琳, 李昂, 黄建辉. 高频轮牧对典型草原生产生态效果的影响[J]. 植物生态学报, 2024, 48(2): 171-179. |
| [3] | 赵艳超, 陈立同. 土壤养分对青藏高原高寒草地生物量响应增温的调节作用[J]. 植物生态学报, 2023, 47(8): 1071-1081. |
| [4] | 陈雪萍, 赵学勇, 张晶, 王瑞雄, 卢建男. 基于地理探测器的科尔沁沙地植被NDVI时空变化特征及其驱动因素[J]. 植物生态学报, 2023, 47(8): 1082-1093. |
| [5] | 缪丽娟, 张宇阳, 揣小伟, 包刚, 何昱, 朱敬雯. 亚洲旱区草地NDVI对气候变化的响应及滞后效应[J]. 植物生态学报, 2023, 47(10): 1375-1385. |
| [6] | 郝晴, 黄昌. 森林地上生物量遥感估算研究综述[J]. 植物生态学报, 2023, 47(10): 1356-1374. |
| [7] | 朱玉英, 张华敏, 丁明军, 余紫萍. 青藏高原植被绿度变化及其对干湿变化的响应[J]. 植物生态学报, 2023, 47(1): 51-64. |
| [8] | 郑宁, 李素英, 王鑫厅, 吕世海, 赵鹏程, 臧琛, 许玉珑, 何静, 秦文昊, 高恒睿. 基于环境因子对叶绿素影响的典型草原植物生活型优势研究[J]. 植物生态学报, 2022, 46(8): 951-960. |
| [9] | 董六文, 任正炜, 张蕊, 谢晨笛, 周小龙. 功能多样性比物种多样性更好解释氮添加对高寒草地生物量的影响[J]. 植物生态学报, 2022, 46(8): 871-881. |
| [10] | 陈丽, 田新民, 任正炜, 董六文, 谢晨笛, 周小龙. 养分添加对天山高寒草地植物多样性和地上生物量的影响[J]. 植物生态学报, 2022, 46(3): 280-289. |
| [11] | 文可, 姚焕玫, 龚祝清, 纳泽林, 韦毅明, 黄以, 陈华权, 廖鹏任, 唐丽萍. 水淹频率变化对鄱阳湖增强型植被指数的影响[J]. 植物生态学报, 2022, 46(2): 148-161. |
| [12] | 原媛, 母艳梅, 邓钰洁, 李鑫豪, 姜晓燕, 高圣杰, 查天山, 贾昕. 植被覆盖度和物候变化对典型黑沙蒿灌丛生态系统总初级生产力的影响[J]. 植物生态学报, 2022, 46(2): 162-175. |
| [13] | 黄侩侩, 胡刚, 庞庆玲, 张贝, 何业涌, 胡聪, 徐超昊, 张忠华. 放牧对中国亚热带喀斯特山地灌草丛物种组成与群落结构的影响[J]. 植物生态学报, 2022, 46(11): 1350-1363. |
| [14] | 刘超, 李平, 武运涛, 潘胜难, 贾舟, 刘玲莉. 一种基于数码相机图像和群落冠层结构调查的草地地上生物量估算方法[J]. 植物生态学报, 2022, 46(10): 1280-1288. |
| [15] | 刘宁, 彭守璋, 陈云明. 气候因子对青藏高原植被生长的时间效应[J]. 植物生态学报, 2022, 46(1): 18-26. |
| 阅读次数 | ||||||
|
全文 |
|
|||||
|
摘要 |
|
|||||
Copyright © 2022 版权所有 《植物生态学报》编辑部
地址: 北京香山南辛村20号, 邮编: 100093
Tel.: 010-62836134, 62836138; Fax: 010-82599431; E-mail: apes@ibcas.ac.cn, cjpe@ibcas.ac.cn
备案号: 京ICP备16067583号-19