
植物生态学报 ›› 2021, Vol. 45 ›› Issue (11): 1221-1230.DOI: 10.17521/cjpe.2021.0179
闫涵1, 张云玲2, 马松梅1,*( ), 王春成3, 张丹3
收稿日期:2021-05-12
接受日期:2021-07-15
出版日期:2021-11-20
发布日期:2021-08-26
通讯作者:
马松梅
作者简介:* (shzmsm@126.com)基金资助:
YAN Han1, ZHANG Yun-Ling2, MA Song-Mei1,*(), WANG Chun-Cheng3, ZHANG Dan3
Received:2021-05-12
Accepted:2021-07-15
Online:2021-11-20
Published:2021-08-26
Contact:
MA Song-Mei
Supported by:摘要:
黑果枸杞(Lycium ruthenicum)是重要的药食同源植物, 在干旱荒漠区发挥着防风固沙的重要生态功能, 但目前片段化分布日趋严重。该研究利用黑果枸杞在新疆的87个自然分布点和基准气候(1971-2000年)下的19个气候变量, 利用GIS空间分析和R软件Biomod2建模平台, 模拟分析黑果枸杞在新疆的适宜分布范围、空间分布特征及其关键限制因子; 并结合研究区土地利用/土地覆被现状, 评价其分布潜力; 同时对黑果枸杞的南北疆种群进行分组建模, 分析该植物的生态位分化。研究结果表明: (1)组合模型的真实技巧统计(TSS)均高于0.75、接收工作机特征曲线下的面积(AUC)均高于0.85, 模拟精度相比单个模型有明显提高; 组合模型得到的种下分组建模的模拟准确性较物种水平有显著提升, TSS均高于0.78、AUC均高于0.88; (2)根据组合模型的模拟结果, 黑果枸杞在新疆的适宜生境面积占比为36.72%, 主要分布于准噶尔盆地、天山北坡及塔里木盆地西北缘和西南缘; 其中, 高度适生区面积占比为5.19%, 集中于福海县、塔城地区东部、天山北坡博乐至阜康一线、库尔勒、柯坪县及塔里木盆地西南缘。高度与中度适生区与研究区耕地的重叠率达80.6%和50.8%; (3)南北疆黑果枸杞种群存在显著的生态位分化, 最暖季平均气温、等温性、降水季节性是驱动黑果枸杞局部环境适应性分化的主要因子。
闫涵, 张云玲, 马松梅, 王春成, 张丹. 黑果枸杞在新疆的适宜分布模拟与局部环境适应性分化. 植物生态学报, 2021, 45(11): 1221-1230. DOI: 10.17521/cjpe.2021.0179
YAN Han, ZHANG Yun-Ling, MA Song-Mei, WANG Chun-Cheng, ZHANG Dan. Suitable distribution simulation and local environmental adaptability differentiation of Lycium ruthenicum in Xinjiang, China. Chinese Journal of Plant Ecology, 2021, 45(11): 1221-1230. DOI: 10.17521/cjpe.2021.0179
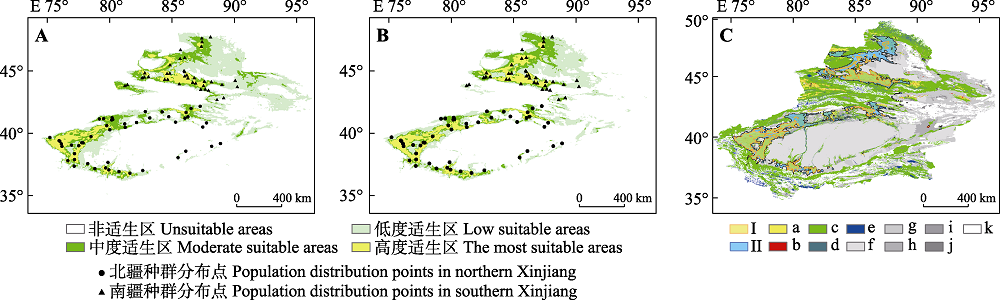
图1 基于物种模拟(A)和南北疆分组模拟(B)的黑果枸杞在新疆的适宜分布及其与研究区土地利用/土地覆被的叠置(C)。I, 高度适生区; II, 中度适生区; a, 耕地; b, 城乡、工矿、居民用地; c, 草地; d, 林地; e, 水域; f-k为未利用土地(f, 沙地; g, 戈壁; h, 盐碱地; i, 沼泽地; j, 裸土地; k, 裸岩石质地)。
Fig. 1 Suitable distribution of Lycium ruthenicum in Xinjiang by the species-level simulation (A) and grouping simulation (B) and its superposition with land use/land cover (LUCC)(C). I, most suitable; II, moderate suitable; a, the cultivated land; b, land for industrial, mining and residents in urban and rural areas; c, the grassland; d, woodland; e, waters; f-k are unused land (f, sandy land; g, gobi; h, saline and alkaline land; i, marshland; j, bare land; k, bare rock and rocky ground).
| 模拟方式 Simulation method | 评估指标 Evaluation index | 随机森林 RF | 广义线性模型GLM | 柔性判别分析FDA | 最大熵模型 MaxEnt | 广义相加模型GAM | 组合模型 Ensemble Model |
|---|---|---|---|---|---|---|---|
| 北疆种群模拟 Simulation of populations in northern Xinjiang | TSS | 0.774 ± 0.057 | 0.793 ± 0.069 | 0.753 ± 0.065 | 0.801 ± 0.054 | 0.756 ± 0.052 | 0.792 ± 0.042 |
| AUC | 0.929 ± 0.020 | 0.909 ± 0.046 | 0.873 ± 0.046 | 0.911 ± 0.053 | 0.818 ± 0.065 | 0.888 ± 0.021 | |
| 南疆种群模拟 Simulation of populations in southern Xinjiang | TSS | 0.782 ± 0.055 | 0.762 ± 0.061 | 0.753 ± 0.064 | 0.760 ± 0.068 | 0.753 ± 0.069 | 0.782 ± 0.049 |
| AUC | 0.895 ± 0.045 | 0.907 ± 0.040 | 0.901 ± 0.054 | 0.905 ± 0.041 | 0.895 ± 0.046 | 0.905 ± 0.046 | |
| 物种模拟 Simulation of species | TSS | 0.766 ± 0.064 | 0.759 ± 0.084 | 0.762 ± 0.038 | 0.751 ± 0.060 | 0.754 ± 0.081 | 0.773 ± 0.055 |
| AUC | 0.834 ± 0.031 | 0.823 ± 0.052 | 0.781 ± 0.031 | 0.775 ± 0.043 | 0.761 ± 0.044 | 0.853 ± 0.059 |
表1 各模型评价指标(平均值±标准差)
Table 1 Evaluation indices of each model (mean ± SD)
| 模拟方式 Simulation method | 评估指标 Evaluation index | 随机森林 RF | 广义线性模型GLM | 柔性判别分析FDA | 最大熵模型 MaxEnt | 广义相加模型GAM | 组合模型 Ensemble Model |
|---|---|---|---|---|---|---|---|
| 北疆种群模拟 Simulation of populations in northern Xinjiang | TSS | 0.774 ± 0.057 | 0.793 ± 0.069 | 0.753 ± 0.065 | 0.801 ± 0.054 | 0.756 ± 0.052 | 0.792 ± 0.042 |
| AUC | 0.929 ± 0.020 | 0.909 ± 0.046 | 0.873 ± 0.046 | 0.911 ± 0.053 | 0.818 ± 0.065 | 0.888 ± 0.021 | |
| 南疆种群模拟 Simulation of populations in southern Xinjiang | TSS | 0.782 ± 0.055 | 0.762 ± 0.061 | 0.753 ± 0.064 | 0.760 ± 0.068 | 0.753 ± 0.069 | 0.782 ± 0.049 |
| AUC | 0.895 ± 0.045 | 0.907 ± 0.040 | 0.901 ± 0.054 | 0.905 ± 0.041 | 0.895 ± 0.046 | 0.905 ± 0.046 | |
| 物种模拟 Simulation of species | TSS | 0.766 ± 0.064 | 0.759 ± 0.084 | 0.762 ± 0.038 | 0.751 ± 0.060 | 0.754 ± 0.081 | 0.773 ± 0.055 |
| AUC | 0.834 ± 0.031 | 0.823 ± 0.052 | 0.781 ± 0.031 | 0.775 ± 0.043 | 0.761 ± 0.044 | 0.853 ± 0.059 |
| 模拟方式 Simulation method | 适生等级 Suitable grade | ||
|---|---|---|---|
| 高度适生区面积比例 Proportion of most suitable areas | 中度适生区面积比例 Proportion of moderate suitable areas | 低度适生区面积比例 Proportion of low suitable areas | |
| 北疆种群模拟 Simulation of populations in northern Xinjiang | 2.50 | 4.33 | 8.42 |
| 南疆种群模拟 Simulation of populations in southern Xinjiang | 3.91 | 3.47 | 7.75 |
| 物种模拟 Simulation of species | 5.19 | 9.06 | 22.47 |
表2 不同模型模拟的黑果枸杞在新疆的适宜面积比例(%)
Table 2 Proportion of the suitable distribution area of Lycium ruthenicum in Xinjiang simulated by each model (%)
| 模拟方式 Simulation method | 适生等级 Suitable grade | ||
|---|---|---|---|
| 高度适生区面积比例 Proportion of most suitable areas | 中度适生区面积比例 Proportion of moderate suitable areas | 低度适生区面积比例 Proportion of low suitable areas | |
| 北疆种群模拟 Simulation of populations in northern Xinjiang | 2.50 | 4.33 | 8.42 |
| 南疆种群模拟 Simulation of populations in southern Xinjiang | 3.91 | 3.47 | 7.75 |
| 物种模拟 Simulation of species | 5.19 | 9.06 | 22.47 |
| 环境变量 Environmental variable | 贡献率 Contribution rate (%) | 数值范围 Range of threshold | ||
|---|---|---|---|---|
| 北疆种群 Northern population | 南疆种群 Southern population | 全部种群 Whole populations | ||
| 等温性 Isothermality | 23.4 | 5.4 | 15.0 | (12, 40) |
| 气温年较差 Temperature annual range (℃) | 14.4 | 21.2 | 14.4 | (33, 63) |
| 最暖季平均气温 Mean temperature of warmest quarter (℃) | 5.4 | 7.5 | 9.3 | (-9, 31) |
| 最冷季平均气温 Mean temperature of coldest quarter (℃) | 9.3 | 49.0 | 26.8 | (-33, -1) |
| 最湿月降水量 Precipitation of wettest month (mm) | 26.4 | 9.0 | 10.9 | (3, 96) |
| 最干月降水量 Precipitation of driest month (mm) | 40.3 | 7.1 | 17.2 | (0, 15) |
| 降水季节性 Precipitation seasonality | 6.6 | 0.8 | 6.3 | (22, 140) |
表3 不同模型模拟的环境因子对黑果枸杞适宜分布的贡献率及其数值范围
Table 3 Contribution rate and range of threshold of each environmental factor to the suitable distribution of Lycium ruthenicum by each model
| 环境变量 Environmental variable | 贡献率 Contribution rate (%) | 数值范围 Range of threshold | ||
|---|---|---|---|---|
| 北疆种群 Northern population | 南疆种群 Southern population | 全部种群 Whole populations | ||
| 等温性 Isothermality | 23.4 | 5.4 | 15.0 | (12, 40) |
| 气温年较差 Temperature annual range (℃) | 14.4 | 21.2 | 14.4 | (33, 63) |
| 最暖季平均气温 Mean temperature of warmest quarter (℃) | 5.4 | 7.5 | 9.3 | (-9, 31) |
| 最冷季平均气温 Mean temperature of coldest quarter (℃) | 9.3 | 49.0 | 26.8 | (-33, -1) |
| 最湿月降水量 Precipitation of wettest month (mm) | 26.4 | 9.0 | 10.9 | (3, 96) |
| 最干月降水量 Precipitation of driest month (mm) | 40.3 | 7.1 | 17.2 | (0, 15) |
| 降水季节性 Precipitation seasonality | 6.6 | 0.8 | 6.3 | (22, 140) |
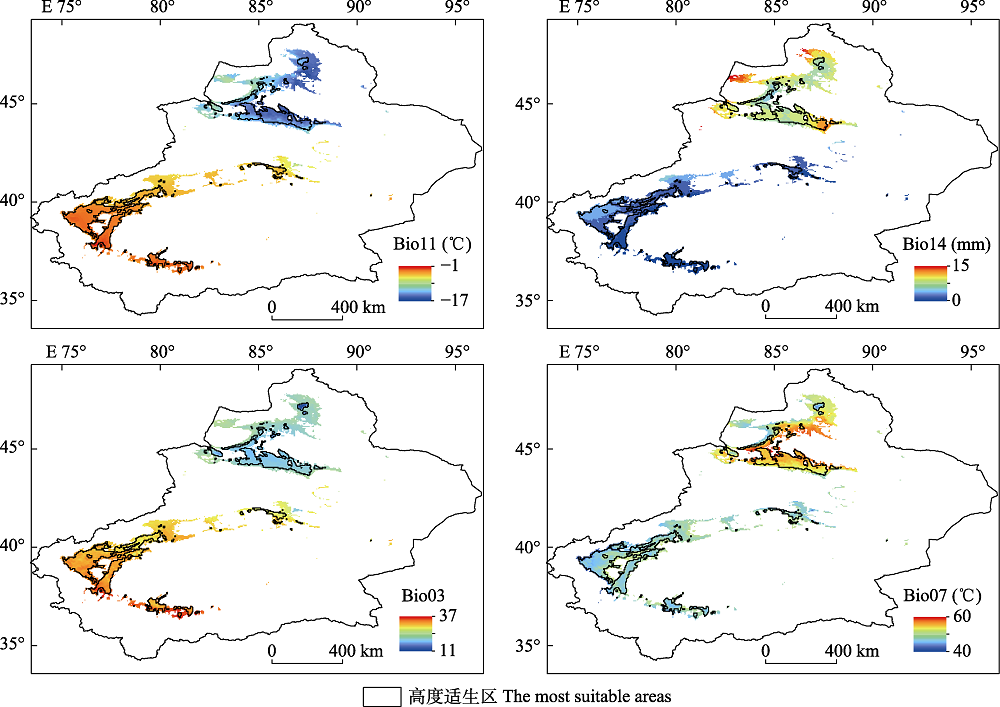
图2 基于黑果枸杞的高度适生区和中度适生区提取的最冷季平均气温(Bio11)、最干月降水量(Bio14)、等温性(Bio03)和气温年较差(Bio07)的数值范围。
Fig. 2 Value ranges of mean temperature of coldest quarter (Bio11), precipitation of driest month (Bio14), isothermality (Bio03) and temperature annual range (Bio07) were extracted based on the most and moderate suitable areas of Lycium ruthenicum in Xinjiang, China.
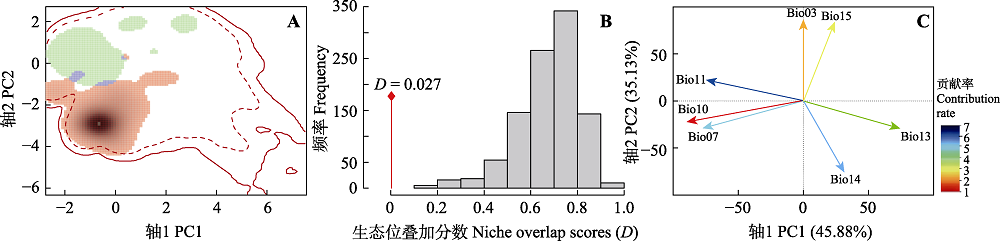
图3 黑果枸杞南北疆种群的生态位相似性分析(A)、等效性检验(B)与影响生态位分化的驱动因子的贡献率(C)。图A中, 绿色和红色分别表示不同种群的生态位空间, 蓝色表示重叠空间。图C中, 红色到蓝色表示气候变量的贡献率排名。Bio03, 等温性; Bio07, 气温年较差; Bio10, 最暖季平均气温; Bio11, 最冷季平均气温; Bio13, 最湿月降水量; Bio14, 最干月降水量; Bio15, 降水季节性。
Fig. 3 Niche similarity analysis (A), equivalence test (B) and correlation circle of contribution rates of environmental factors (C) of Lycium ruthenicum in southern and northern Xinjiang, China. In figure A, green and red represent niche spaces of different populations, and blue represent overlapping spaces. In figure C, red to blue indicates that the contribution rate rank of climate variables varies. Bio03, isothermality; Bio07, temperature annual range; Bio10, mean temperature of warmest quarter; Bio11, mean temperature of coldest quarter; Bio13, precipitation of wettest month; Bio14, precipitation of driest month; Bio15, precipitation seasonality.
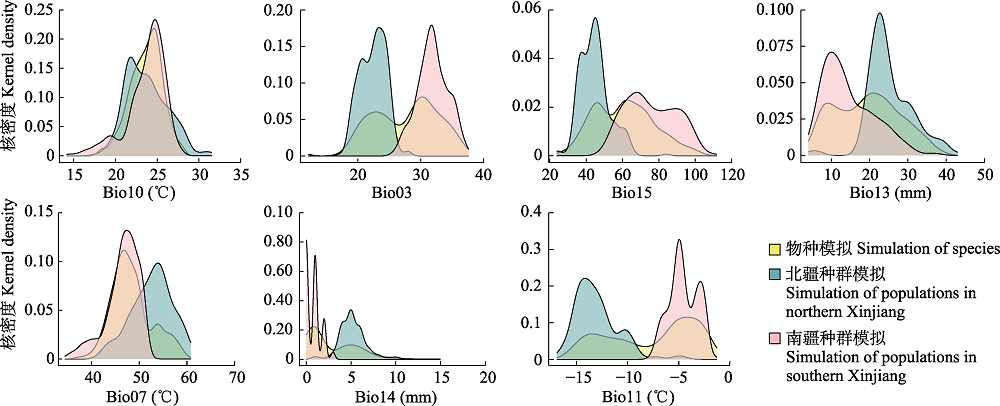
图4 影响黑果枸杞南北疆种群生态位分化的驱动因子的核密度图。Bio03, 等温性; Bio07, 气温年较差; Bio10, 最暖季平均气温; Bio11, 最冷季平均气温; Bio13, 最湿月降水量; Bio14, 最干月降水量; Bio15, 降水季节性。
Fig. 4 Kernel density plots of environmental factors of niche differentiation of Lycium ruthenicum in southern and northern Xinjiang, China. Bio03, isothermality; Bio07, temperature annual range; Bio10, mean temperature of warmest quarter; Bio11, mean temperature of coldest quarter ; Bio13, precipitation of wettest month; Bio14, precipitation of driest month; Bio15, precipitation seasonality.
| [1] |
Banta JA, Ehrenreich IM, Gerard S, Chou L, Wilczek A, Schmitt J, Kover PX, Purugganan MD (2012). Climate envelope modelling reveals intraspecific relationships among flowering phenology, niche breadth and potential range size in Arabidopsis thaliana. Ecology Letters, 15, 769-777.
DOI URL |
| [2] | Bi YF, Xu JC, Li QH, Guisan A, Thuiller W, Zimmermann NE, Yang YP, Yang XF (2013). Applying BioMod for model-ensemble in species distributions: a case study for Tsuga chinensis in China. Plant Diversity, 35, 647-655. |
| [ 毕迎凤, 许建初, 李巧宏, Guisan A, Thuiller W, Zimmermann NE, 杨永平, 杨雪飞 (2013). 应用BioMod集成多种模型研究物种的空间分布——以铁杉在中国的潜在分布为例. 植物分类与资源学报, 35, 647-655.] | |
| [3] |
Bocedi G, Atkins KE, Liao JS, Henry RC, Travis JMJ, Hellmann JJ (2013). Effects of local adaptation and interspecific competition on species’ responses to climate change. Annals of the New York Academy of Sciences, 1297, 83-97.
DOI PMID |
| [4] |
Broennimann O, Fitzpatrick MC, Pearman PB, Petitpierre B, Pellissier L, Yoccoz NG, Thuiller W, Fortin MJ, Randin C, Zimmermann NE, Graham CH, Guisan A (2012). Measuring ecological niche overlap from occurrence and spatial environmental data. Global Ecology and Biogeography, 21, 481-497.
DOI URL |
| [5] |
Bush A, Catullo RA, Mokany K, Thornhill AH, Miller JT, Ferrier S (2018). Truncation of thermal tolerance niches among Australian plants. Global Ecology and Biogeography, 27, 22-31.
DOI URL |
| [6] |
Chen QH, Yin YJ, Zhao R, Yang Y, Teixeira da Silva JA, Yu XN (2019). Incorporating local adaptation into species distribution modeling of Paeonia mairei, an endemic plant to China. Frontiers in Plant Science, 10, 1717. DOI: 10.3389/fpls.2019.01717.
DOI URL |
| [7] |
Fournier-Level A, Korte A, Cooper MD, Nordborg M, Schmitt J, Wilczek AM (2011). A map of local adaptation in Arabidopsis thaliana. Science, 334, 86-89.
DOI PMID |
| [8] |
Guo YL, Li X, Zhao ZF, Nawaz Z (2019). Predicting the impacts of climate change, soils and vegetation types on the geographic distribution of Polyporus umbellatus in China. Science of the Total Environment, 648, 1-11.
DOI URL |
| [9] |
Hällfors MH, Liao JS, Dzurisin J, Grundel R, Hyvärinen M, Towle K, Wu GC, Hellmann JJ (2016). Addressing potential local adaptation in species distribution models: implications for conservation under climate change. Ecological Applications, 26, 1154-1169.
DOI URL |
| [10] | Han H (2016). Resource distribution and development status of Lycium ruthenicum in Weili County. Forestry of Xinjiang, (2), 23-24. |
| [ 韩红 (2016). 尉犁县黑果枸杞资源分布及发展现状. 新疆林业, (2), 23-24.] | |
| [11] | He WG, Nasongcaoketu, Wuqier, Wu CH, Zhao J, Wang Y, Li YX (2015). Natural distribution and biological characteristics of Lycium ruthenicum in Yanqi basin of Xinjiang. Chinese Wild Plant Resources, 34, 59-63. |
| [ 何文革, 那松曹克图, 吾其尔, 吴春焕, 赵洁, 王瑛, 李玉霞 (2015). 新疆焉耆盆地黑果枸杞自然分布特点及其生物特性. 中国野生植物资源, 34, 59-63.] | |
| [12] | Institute of Botany, Chinese Academy of Sciences (1980). A Guide to Higher Plants in China. Vol. 3. Science Press, Beijing. 709. |
| [中国科学院植物研究所 (1980). 中国高等植物图鉴: 第3册. 科学出版社. 北京: 709.] | |
| [13] |
King NG, McKeown NJ, Smale DA, Moore PJ (2018). The importance of phenotypic plasticity and local adaptation in driving intraspecific variability in thermal niches of marine macrophytes. Ecography, 41, 1469-1484.
DOI URL |
| [14] | Kuang KR, Lu AM (1978). Flora of China. Vol. 67: Solanaceae. Science Press, Beijing. 8-11. |
| [ 匡可任, 路安民(1978). 中国植物志: 67卷: 茄科. 科学出版社, 北京. 8-11.] | |
| [15] | Li YH, Jin YL, Zhao YY (2019). Effects of grazing on plant community phylogenetic diversity and structure in typical grassland. Chinese Journal of Grassland, 41, 105-110. |
| [ 李元恒, 金一兰, 赵艳云 (2019). 放牧对典型草原植物群落系统发育的影响. 中国草地学报, 41, 105-110.] | |
| [16] | Liu ZG, Kang HL, Yue HL, Mei LJ, Tao YD, Shao Y (2018). Resources investigation of Lycium ruthenicum Murr. and analysis of fruits proanthocyanidin from different regions. Lishizhen Medicine and Materia Medica Research, 29, 1713-1716. |
| [ 刘增根, 康海林, 岳会兰, 梅丽娟, 陶燕铎, 邵贇 (2018). 黑果枸杞资源调查及其原花青素含量差异分析. 时珍国医国药, 29, 1713-1716.] | |
| [17] | Luo M, Wang H, Lü Z (2017). Evaluating the performance of species distribution models Biomod2 and MaxEnt using the giant panda distribution data. Chinese Journal of Applied Ecology, 28, 4001-4006. |
| [ 罗玫, 王昊, 吕植 (2017). 使用大熊猫数据评估Biomod2和MaxEnt分布预测模型的表现. 应用生态学报, 28, 4001-4006.] | |
| [18] |
Ma SM, Nie YB, Jiang XL, Xu Z, Ji WQ (2019). Genetic structure of the endangered, relict shrub Amygdalus mongolica (Rosaceae) in arid northwest China. Australian Journal of Botany, 67, 128-139.
DOI URL |
| [19] |
Marcer A, Méndez-Vigo B, Alonso-Blanco C, Picó FX (2016). Tackling intraspecific genetic structure in distribution models better reflects species geographical range. Ecology and Evolution, 6, 2084-2097.
DOI URL |
| [20] |
Miguel PA, Alberto JV, Pedro A (2021). Niche differentiation between deeply divergent phylogenetic lineages of an endemic newt: implications for Species Distribution Models. Zoology, 144, 125852. DOI: 10.1016/j.zool.2020.125852.
DOI URL |
| [21] |
Pearman PB, D’Amen M, Graham CH, Thuiller W, Zimmermann NE (2010). Within-taxon niche structure: niche conservatism, divergence and predicted effects of climate change. Ecography, 33, 990-1003.
DOI URL |
| [22] |
Peterson ML, Doak DF, Morris WF (2019). Incorporating local adaptation into forecasts of species’ distribution and abundance under climate change. Global Change Biology, 25, 775-793.
DOI PMID |
| [23] | Qiao HJ, Hu JH, Huang JH (2013). Theoretical basis, future directions, and challenges for ecological niche models. Scientia Sinica (Vitae), 43, 915-927. |
| [ 乔慧捷, 胡军华, 黄继红 (2013). 生态位模型的理论基础、发展方向与挑战. 中国科学: 生命科学, 43, 915-927.] | |
| [24] |
Qiao HJ, Peterson AT, Ji LQ, Hu JH (2017). Using data from related species to overcome spatial sampling bias and associated limitations in ecological niche modelling. Methods in Ecology and Evolution, 8, 1804-1812.
DOI URL |
| [25] |
Smith AB, Godsoe W, Rodríguez-Sánchez F, Wang HH, Warren D (2019). Niche estimation above and below the species level. Trends in Ecology & Evolution, 34, 260-273.
DOI URL |
| [26] | Soberon J, Peterson AT (2005). Interpretation of models of fundamental ecological niches and species’ distributional areas. Biodiversity Informatics, 2, 1-10. |
| [27] | Wang CC, Ma SM, Sun FF, Wei B, Nie YB (2021). Spatial genetic patterns of the medicinal and edible shrub Lycium ruthenicum (Solanaceae) in arid Xinjiang, China. Tree Genetics & Genomes, 17, 1-13. |
| [28] | Wang FL, Wang Q, Li AD, Wei QS, Chai CW, Hu XK, Wang YQ, Wang YY, Yang XH, Jin CD (2019). Summary of present research on Lycium ruthenicum of medicinal plant in desert area. Soil and Water Conservation in China, (5), 57-60. |
| [ 王方琳, 王祺, 李爱德, 尉秋实, 柴成武, 胡小柯, 王昱淇, 汪媛艳, 杨晓寒, 靳承东 (2019). 荒漠区药用植物黑果枸杞研究现状综述. 中国水土保持, (5), 57-60.] | |
| [29] |
Warren DL, Glor RE, Turelli M (2008). Environmental niche equivalency versus conservatism: quantitative approaches to niche evolution. Evolution, 62, 2868-2883.
DOI PMID |
| [30] | Yan MX, Sun N, Gu BJ, He RC, Liu Y (2021). Spatio-temporal niche differentiation of sympatric green peafowl (Pavo muticus) and silver pheasant (Lophura nycthemera). Sichuan Journal of Zoology, 40, 150-158. |
| [ 晏鸣霄, 孙楠, 顾伯健, 贺如川, 刘瑛 (2021). 同域分布的绿孔雀与白鹇时空生态位分化. 四川动物, 40, 150-158.] | |
| [31] |
Zhang HX, Wang Q, Jia SW (2020). Genomic Phylogeography of Gymnocarpos przewalskii (Caryophyllaceae): insights into habitat fragmentation in arid northwestern China. Diversity,, 12(9), 335. DOI: 10.3390/d12090335.
DOI URL |
| [32] | Zhang JM (2008). Ecological Differentiation in Mosla Species. PhD dissertation, Zhejiang University, Hangzhou. |
| [ 张建民 (2008). 石荠苧属物种的生态分化研究. 博士学位论文, 浙江大学, 杭州.] | |
| [33] | Zhang L, Liu SR, Sun PS, Wang TL (2011). Partitioning and mapping the sources of variations in the ensemble forecasting of species distribution under climate change: a case study of Pinus tabulaeformis. Acta Ecologica Sinica, 31, 5749-5761. |
| [ 张雷, 刘世荣, 孙鹏森, 王同立 (2011). 气候变化对物种分布影响模拟中的不确定性组分分割与制图——以油松为例. 生态学报, 31, 5749-5761.] | |
| [34] | Zhang L, Wei YQ, Wang JN, Zhou Q, Liu FG, Chen Q, Liu F (2020). The potential geographical distribution of Lycium ruthenicum Murr under different climate change scenarios. Chinese Journal of Applied and Environmental Biology, 26, 969-978. |
| [ 张亮, 魏彦强, 王金牛, 周强, 刘峰贵, 陈琼, 刘飞 (2020). 气候变化情景下黑果枸杞的潜在地理分布. 应用与环境生物学报, 26, 969-978.] | |
| [35] | Zhao ZF, Wei HY, Guo YL, Gu W (2016). Potential distribution of Panax ginseng and its predicted responses to climate change. Chinese Journal of Applied Ecology, 27, 3607-3615. |
| [ 赵泽芳, 卫海燕, 郭彦龙, 顾蔚 (2016). 人参潜在地理分布以及气候变化对其影响预测. 应用生态学报, 27, 3607-3615.] | |
| [36] | Zhao ZF, Wei HY, Guo YL, Luan WF, Zhao ZB (2020). Impact of climate change on the suitable habitat distribution of Gymnocarpos przewalskii, a relict plant. Journal of Desert Research, 40, 125-133. |
| [ 赵泽芳, 卫海燕, 郭彦龙, 栾文飞, 赵泽斌 (2020). 气候变化下的孑遗植物裸果木(Gymnocarpos przewalskii)适宜生境分布. 中国沙漠, 40, 125-133.] | |
| [37] | Zhao ZF, Wei HY, Guo YL, Zhao ZB, Pang GJ, Ma Y, Gu W (2017). Impacts of climate change on cultivation suitability of Lycium ruthenicum. Journal of Desert Research, 37, 902-909. |
| [ 赵泽芳, 卫海燕, 郭彦龙, 赵泽斌, 庞国锦, 马媛, 顾蔚 (2017). 黑果枸杞(Lycium ruthenicum)分布对气候变化的响应及其种植适宜性. 中国沙漠, 37, 902-909.] | |
| [38] |
Zhu GP, Liu Q, Gao YB (2014). Improving ecological niche model transferability to predict the potential distribution of invasive exotic species. Biodiversity Science, 22, 223-230.
DOI URL |
| [ 朱耿平, 刘强, 高玉葆 (2014). 提高生态位模型转移能力来模拟入侵物种的潜在分布. 生物多样性, 22, 223-230.] | |
| [39] | Zhu YY, Xu XT (2019). Effects of climate change on the distribution of wild population of Metasequoia glyptostroboides, an endangered and endemic species in China. Chinese Journal of Ecology, 38, 1629-1636. |
| [ 朱莹莹, 徐晓婷 (2019). 气候变化对我国特有濒危物种水杉野生种群分布的影响. 生态学杂志, 38, 1629-1636.] |
| [1] | 张计深, 史新杰, 刘宇诺, 吴阳, 彭守璋. 气候变化下中国潜在自然植被生态系统碳储量动态[J]. 植物生态学报, 2024, 48(4): 428-444. |
| [2] | 陈雪萍, 赵学勇, 张晶, 王瑞雄, 卢建男. 基于地理探测器的科尔沁沙地植被NDVI时空变化特征及其驱动因素[J]. 植物生态学报, 2023, 47(8): 1082-1093. |
| [3] | 代景忠, 白玉婷, 卫智军, 张楚, 辛晓平, 闫玉春, 闫瑞瑞. 羊草功能性状对施肥的动态响应[J]. 植物生态学报, 2023, 47(7): 943-953. |
| [4] | 哈里布努尔, 古丽扎尔·阿不都克力木, 热依拉穆·麦麦提吐尔逊, 艾沙江·阿不都沙拉木. 黑果枸杞两种花型的花部综合征与传粉特性[J]. 植物生态学报, 2022, 46(9): 1050-1063. |
| [5] | 王春成, 张云玲, 马松梅, 黄刚, 张丹, 闫涵. 中国扁桃亚属四种野生扁桃的系统发育与物种分化[J]. 植物生态学报, 2021, 45(9): 987-995. |
| [6] | 代景忠, 白玉婷, 卫智军, 张楚, 闫瑞瑞. 切根对羊草营养生长期内植物功能性状的影响[J]. 植物生态学报, 2021, 45(12): 1292-1302. |
| [7] | 王春成, 马松梅, 张丹, 王绍明. 柴达木野生黑果枸杞的空间遗传结构[J]. 植物生态学报, 2020, 44(6): 661-668. |
| [8] | 许飞, 王传宽. 4种温带针叶树种树干CO2释放通量的季节动态及其驱动因子[J]. 植物生态学报, 2017, 41(4): 396-408. |
| [9] | 王锦楠, 陈进福, 陈武生, 周新洋, 许东, 李际红, 亓晓. 柴达木地区野生黑果枸杞种群遗传多样性的AFLP分析[J]. 植物生态学报, 2015, 39(10): 1003-1011. |
| [10] | 马松梅, 聂迎彬, 耿庆龙, 王荣学. 气候变化对蒙古扁桃适宜分布范围和空间格局的影响[J]. 植物生态学报, 2014, 38(3): 262-269. |
| [11] | 邓建明, 姚步青, 周华坤, 赵新全, 魏晴, 陈哲, 王文颖. 水氮添加条件下高寒草甸主要植物种氮素吸收分配的同位素示踪研究[J]. 植物生态学报, 2014, 38(2): 116-124. |
| 阅读次数 | ||||||
|
全文 |
|
|||||
|
摘要 |
|
|||||
Copyright © 2022 版权所有 《植物生态学报》编辑部
地址: 北京香山南辛村20号, 邮编: 100093
Tel.: 010-62836134, 62836138; Fax: 010-82599431; E-mail: apes@ibcas.ac.cn, cjpe@ibcas.ac.cn
备案号: 京ICP备16067583号-19