
植物生态学报 ›› 2024, Vol. 48 ›› Issue (10): 1256-1273.DOI: 10.17521/cjpe.2023.0076 cstr: 32100.14.cjpe.2023.0076
黄砺成1,2, 莫兴国1,2,3,*( )
)
收稿日期:2023-03-16
接受日期:2024-01-16
出版日期:2024-10-20
发布日期:2024-12-03
通讯作者:
莫兴国
基金资助:
HUANG Li-Cheng1,2, MO Xing-Guo1,2,3,*()
Received:2023-03-16
Accepted:2024-01-16
Online:2024-10-20
Published:2024-12-03
Contact:
MO Xing-Guo
Supported by:摘要: 干旱强度和频率上升严重威胁陆地生态系统结构和功能。为保证未来逆境下生态系统服务功能的正常发挥, 生态系统生产力对气象干旱响应与弹性的时空特征亟待探究。本研究以海河流域2001-2018年标准化降水蒸散指数(SPEI)度量气象干旱, 基于流域自然植被净初级生产力(NPP), 分析NPP与SPEI的数量关系, 评估自然植被的干旱风险及植被在干旱后呈现的弹性。结果显示: (1)海河流域自然植被NPP和归一化植被指数(NDVI)在研究期内均呈显著上升趋势; (2)植被NPP对干旱响应的滞后时间呈草原、稀树草原<落叶阔叶林、多树草原<落叶-常绿混交林、郁闭灌丛; (3)干旱致灾风险则呈现草原>郁闭灌丛>多树草原>落叶阔叶林>稀树草原>落叶-常绿混交林; (4)干旱后流域75%以上植被NPP明显偏低不超过1个月, 弹性较强; 森林类植被的弹性强于灌草类, 二者年内变化趋势相反, 年际均呈增长趋势; NPP响应和弹性特征随植被类型和干旱强度而变。基于植被干旱风险和弹性调整造林还草措施, 优化植被结构, 提升物种多样性, 可提高流域生态系统的稳定性。
黄砺成, 莫兴国. 海河流域生态系统净初级生产力对气象干旱的响应与弹性. 植物生态学报, 2024, 48(10): 1256-1273. DOI: 10.17521/cjpe.2023.0076
HUANG Li-Cheng, MO Xing-Guo. Response and resilience of net primary productivity of the Hai River Basin ecosystems under meteorological droughts. Chinese Journal of Plant Ecology, 2024, 48(10): 1256-1273. DOI: 10.17521/cjpe.2023.0076
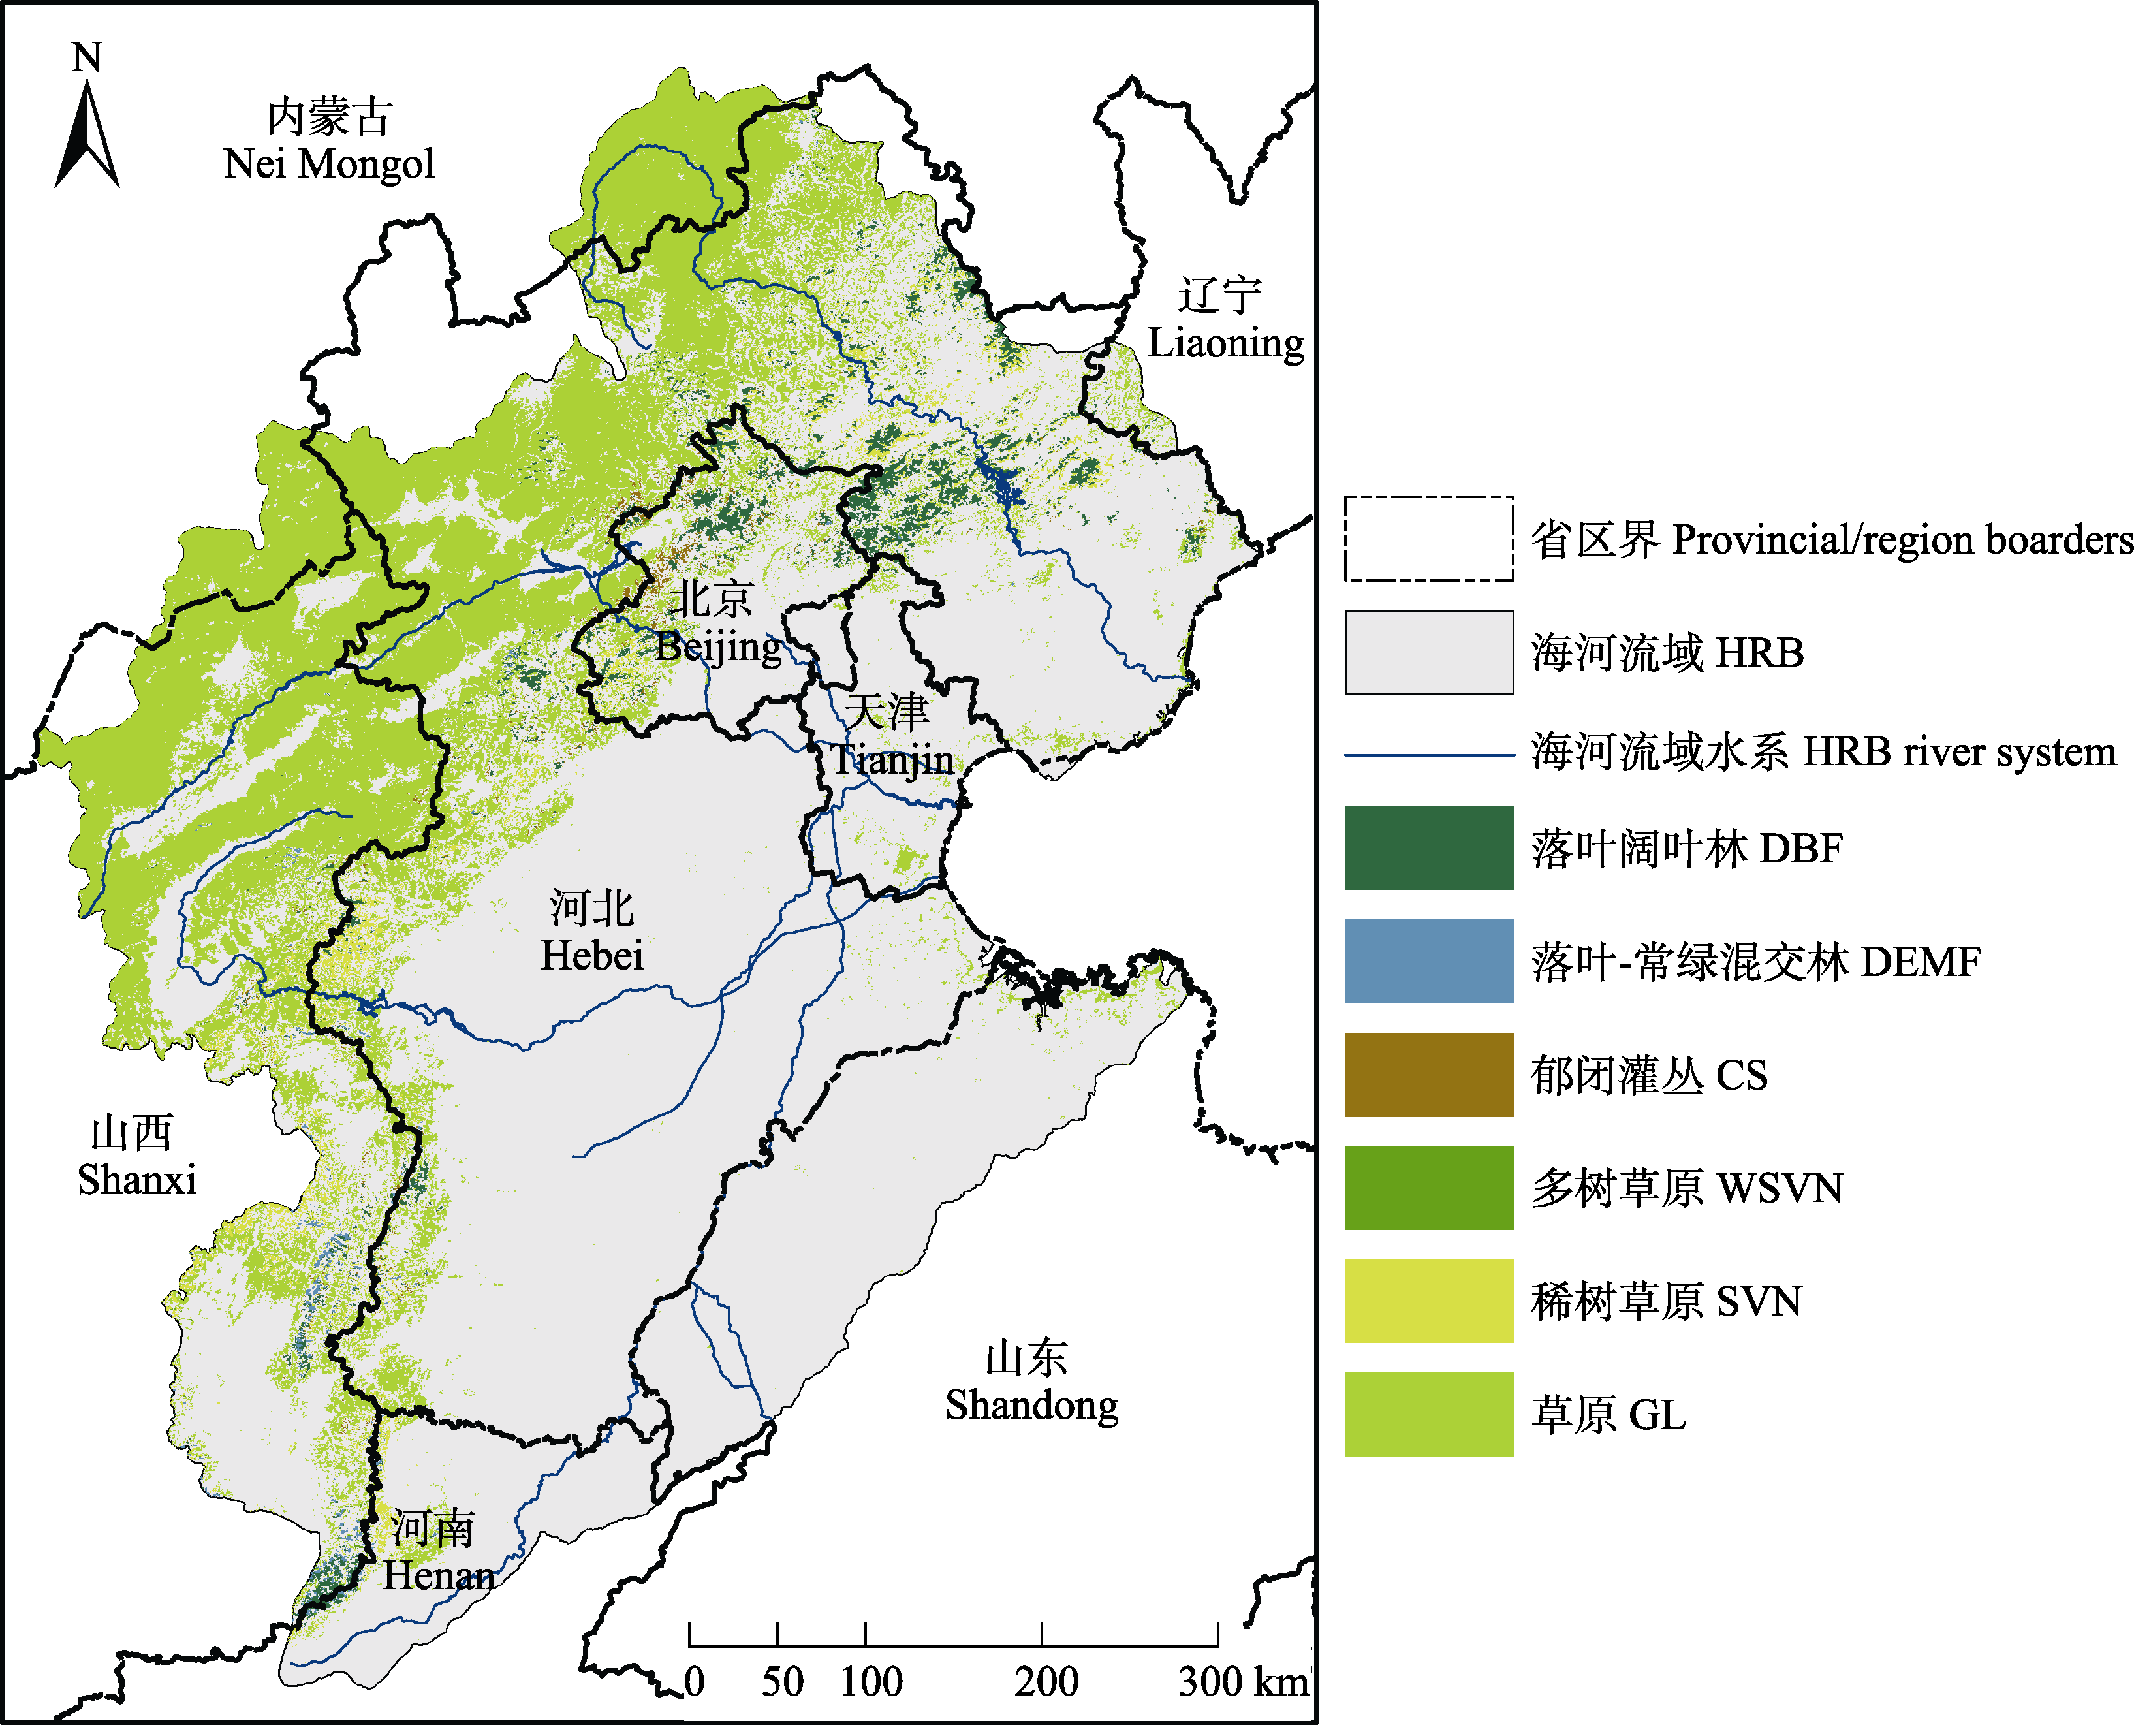
图1 海河流域自然植被分布图(国际地圈-生物圈计划(IGBP)土地覆被分类系统, 500 m空间分辨率)。
Fig. 1 Distribution of natural vegetation in the Hai River Basin (based on International Geosphere-Biosphere Programme (IGBP) land cover classification system with spatial resolution of 500 m). CS, closed shrubland; DBF, deciduous broadleaf forest; DEMF, deciduous-evergreen mixed forest; GL, grassland; HRB, the Hai River Basin; SVN, savanna; WSVN, woody savanna.
| 数据产品 Data product | 数据项 Data item | 时间分辨率 Temporal resolution | 空间分辨率 Spatial resolution | 数据来源 Data source |
|---|---|---|---|---|
| 中国区域地面 气象要素驱动 数据集 China Meteorological Forcing Dataset (CMFD) | 月均气温 Monthly average air temperature | 1自然月 1 sequential month | 0.1° | 国家青藏高原 科学数据中心 National Tibetan Plateau Scientific Data Center ( |
| 月降水 Monthly precipitation | ||||
| 太阳辐射量 Solar radiation | ||||
| 近地面风速 Near-surface wind speed | ||||
| 近地面气压 Near-surface air pressure | ||||
| 近地面比湿 Near-surface specific humidity | ||||
| 实际蒸散量 Evapotranspiration (ET) | 1自然月 1 sequential month | 1 km | 植被界面过程(VIP)模型 Vegetation Interface Process (VIP) model | |
| MOD13A1.061 | NDVI | 16 d | 500 m | Google Earth Engine ( |
| MOD17A2.006 | 总初级生产力 Gross primary productivity (GPP) | 8 d | 500 m | |
| MCD12Q1.006 | 土地覆被类型 Land cover type | 1 a | 500 m | |
表1 海河流域植被与气候数据及其来源
Table 1 Vegetation and climate data and its sources of the Hai River Basin
| 数据产品 Data product | 数据项 Data item | 时间分辨率 Temporal resolution | 空间分辨率 Spatial resolution | 数据来源 Data source |
|---|---|---|---|---|
| 中国区域地面 气象要素驱动 数据集 China Meteorological Forcing Dataset (CMFD) | 月均气温 Monthly average air temperature | 1自然月 1 sequential month | 0.1° | 国家青藏高原 科学数据中心 National Tibetan Plateau Scientific Data Center ( |
| 月降水 Monthly precipitation | ||||
| 太阳辐射量 Solar radiation | ||||
| 近地面风速 Near-surface wind speed | ||||
| 近地面气压 Near-surface air pressure | ||||
| 近地面比湿 Near-surface specific humidity | ||||
| 实际蒸散量 Evapotranspiration (ET) | 1自然月 1 sequential month | 1 km | 植被界面过程(VIP)模型 Vegetation Interface Process (VIP) model | |
| MOD13A1.061 | NDVI | 16 d | 500 m | Google Earth Engine ( |
| MOD17A2.006 | 总初级生产力 Gross primary productivity (GPP) | 8 d | 500 m | |
| MCD12Q1.006 | 土地覆被类型 Land cover type | 1 a | 500 m | |
| 土地覆被类型 Land cover type | εmax (g·MJ-1) | NDVImax | 样本量 Pixels of vegetations |
|---|---|---|---|
| 落叶阔叶林 Deciduous broadleaf forest | 0.692 | 0.862 | 8 912 |
| 落叶-常绿混交林 Deciduous-evergreen mixed forest | 0.768 | 0.839 | 1 278 |
| 郁闭灌丛 Closed shrubland | 0.429 | 0.831 | 2 314 |
| 多树草原 Woody savanna | 0.542 | 0.811 | 1 754 |
| 稀树草原 Savanna | 0.542 | 0.806 | 10 030 |
| 草原 Grassland | 0.542 | 0.645 | 121 070 |
表2 海河流域自然生态系统最大光能利用率(εmax)和最大归一化植被指数(NDVImax)
Table 2 Maximum light use efficiency (εmax) and maximum normalized differential vegetation index (NDVImax) of natural ecosystems in the Hai River Basin
| 土地覆被类型 Land cover type | εmax (g·MJ-1) | NDVImax | 样本量 Pixels of vegetations |
|---|---|---|---|
| 落叶阔叶林 Deciduous broadleaf forest | 0.692 | 0.862 | 8 912 |
| 落叶-常绿混交林 Deciduous-evergreen mixed forest | 0.768 | 0.839 | 1 278 |
| 郁闭灌丛 Closed shrubland | 0.429 | 0.831 | 2 314 |
| 多树草原 Woody savanna | 0.542 | 0.811 | 1 754 |
| 稀树草原 Savanna | 0.542 | 0.806 | 10 030 |
| 草原 Grassland | 0.542 | 0.645 | 121 070 |
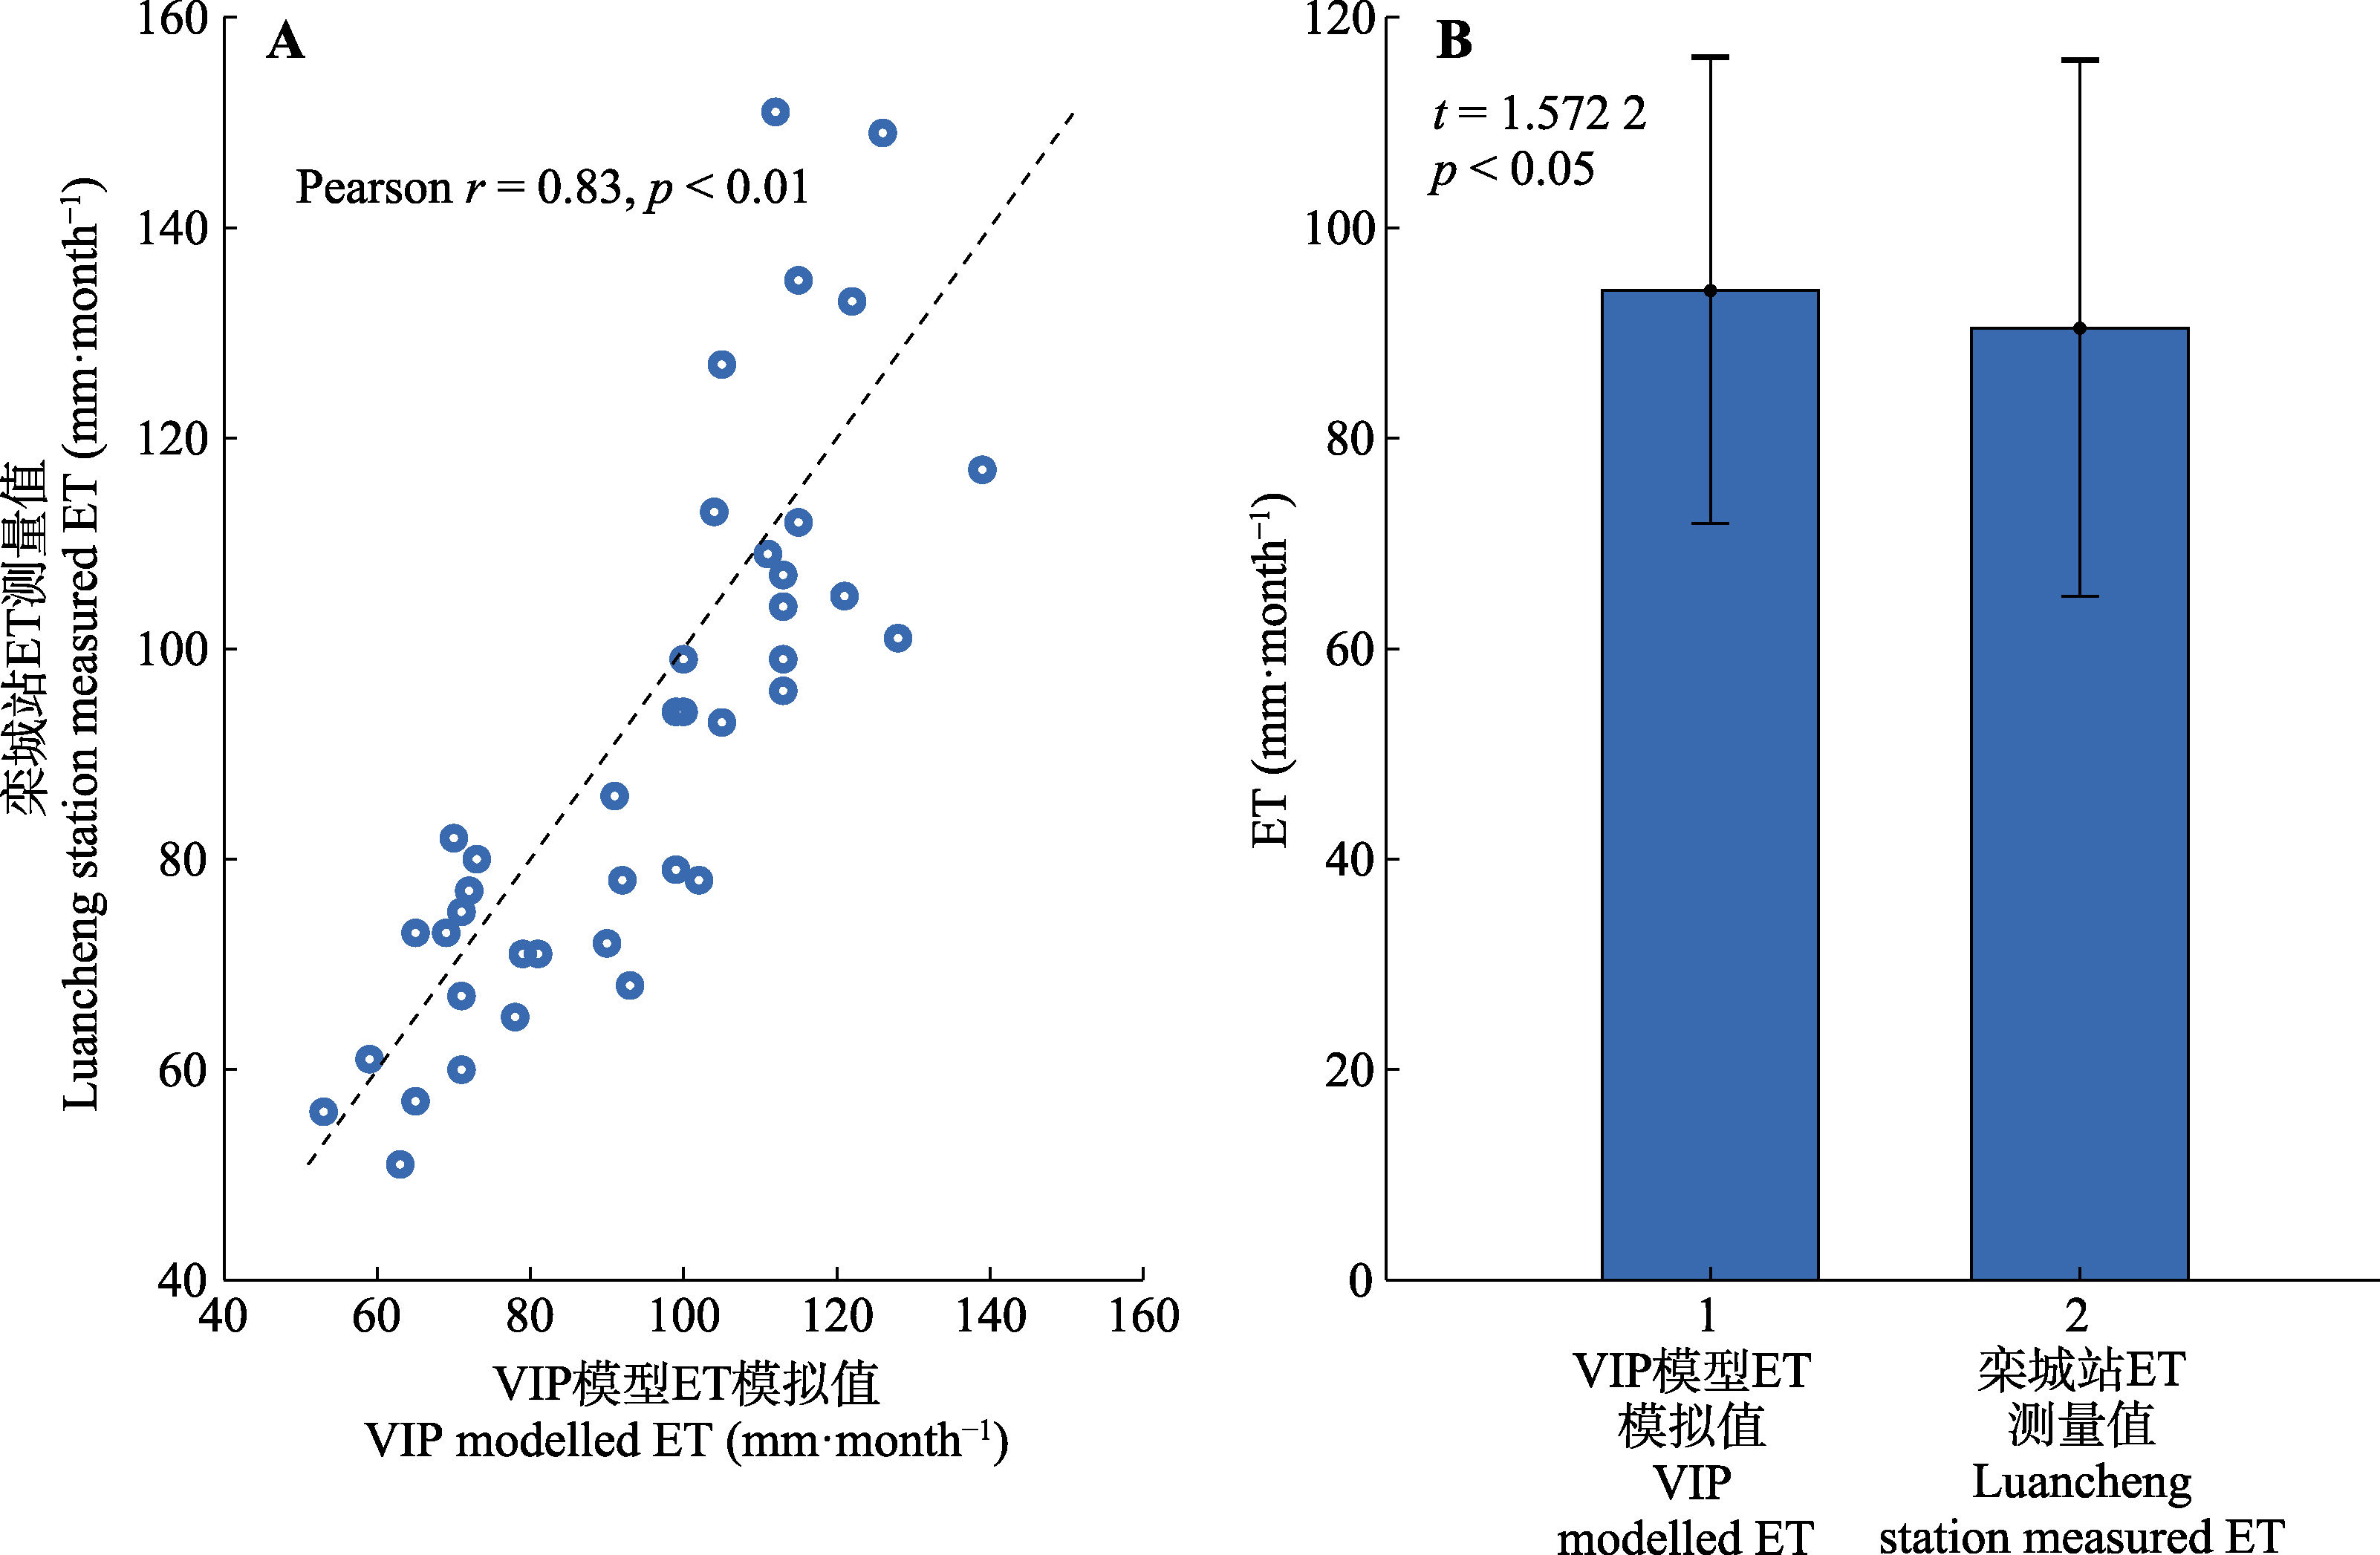
图2 植被界面过程(VIP)模型蒸散量(ET)模拟值-栾城站ET实测值相关系数(A)和t检验结果图(B) (平均值± 22.14/25.50)。
Fig. 2 Correlation coefficient (A) and t-test result (B) between Vegetation Interface Process (VIP) modelled evapotranspiration (ET) and ET measured in Luancheng station (mean ± 22.14/25.50).
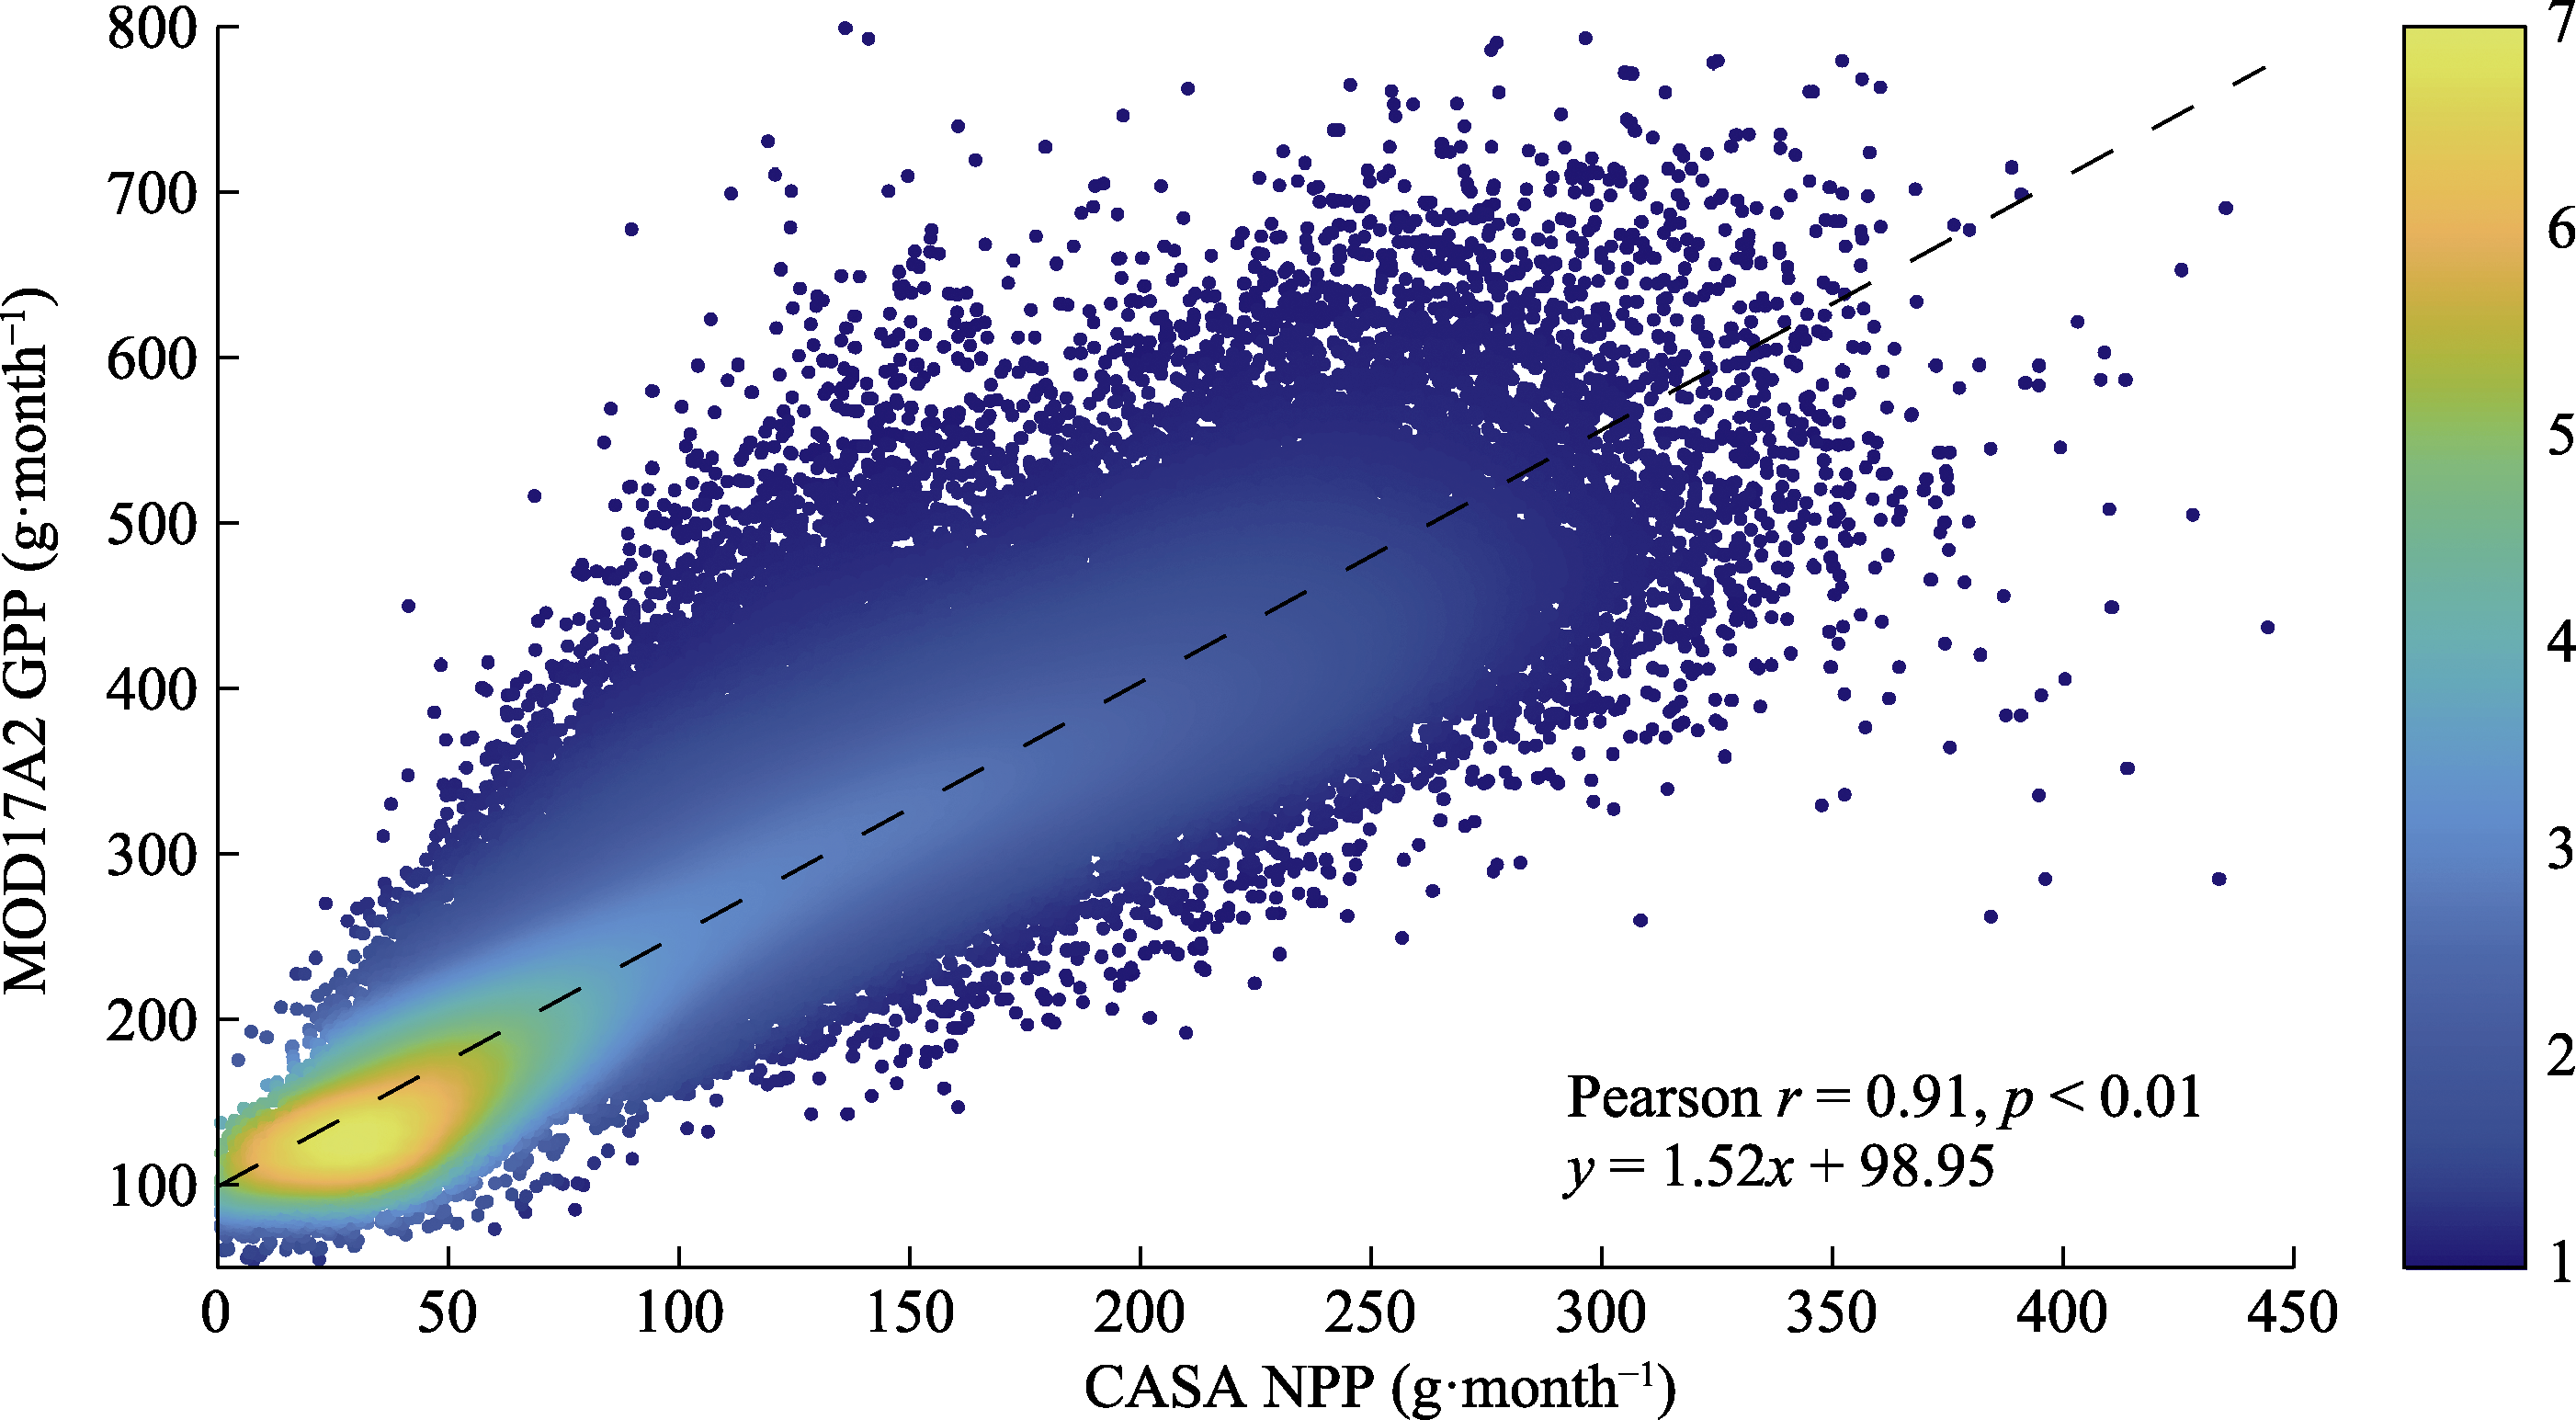
图3 CASA净初级生产力(NPP)模拟值-MOD17A2总初级生产力(GPP)模拟值分布图。
Fig. 3 Distribution of CASA modelled net primary productivity (NPP) and MOD17A2 modelled gross primary productivity (GPP).
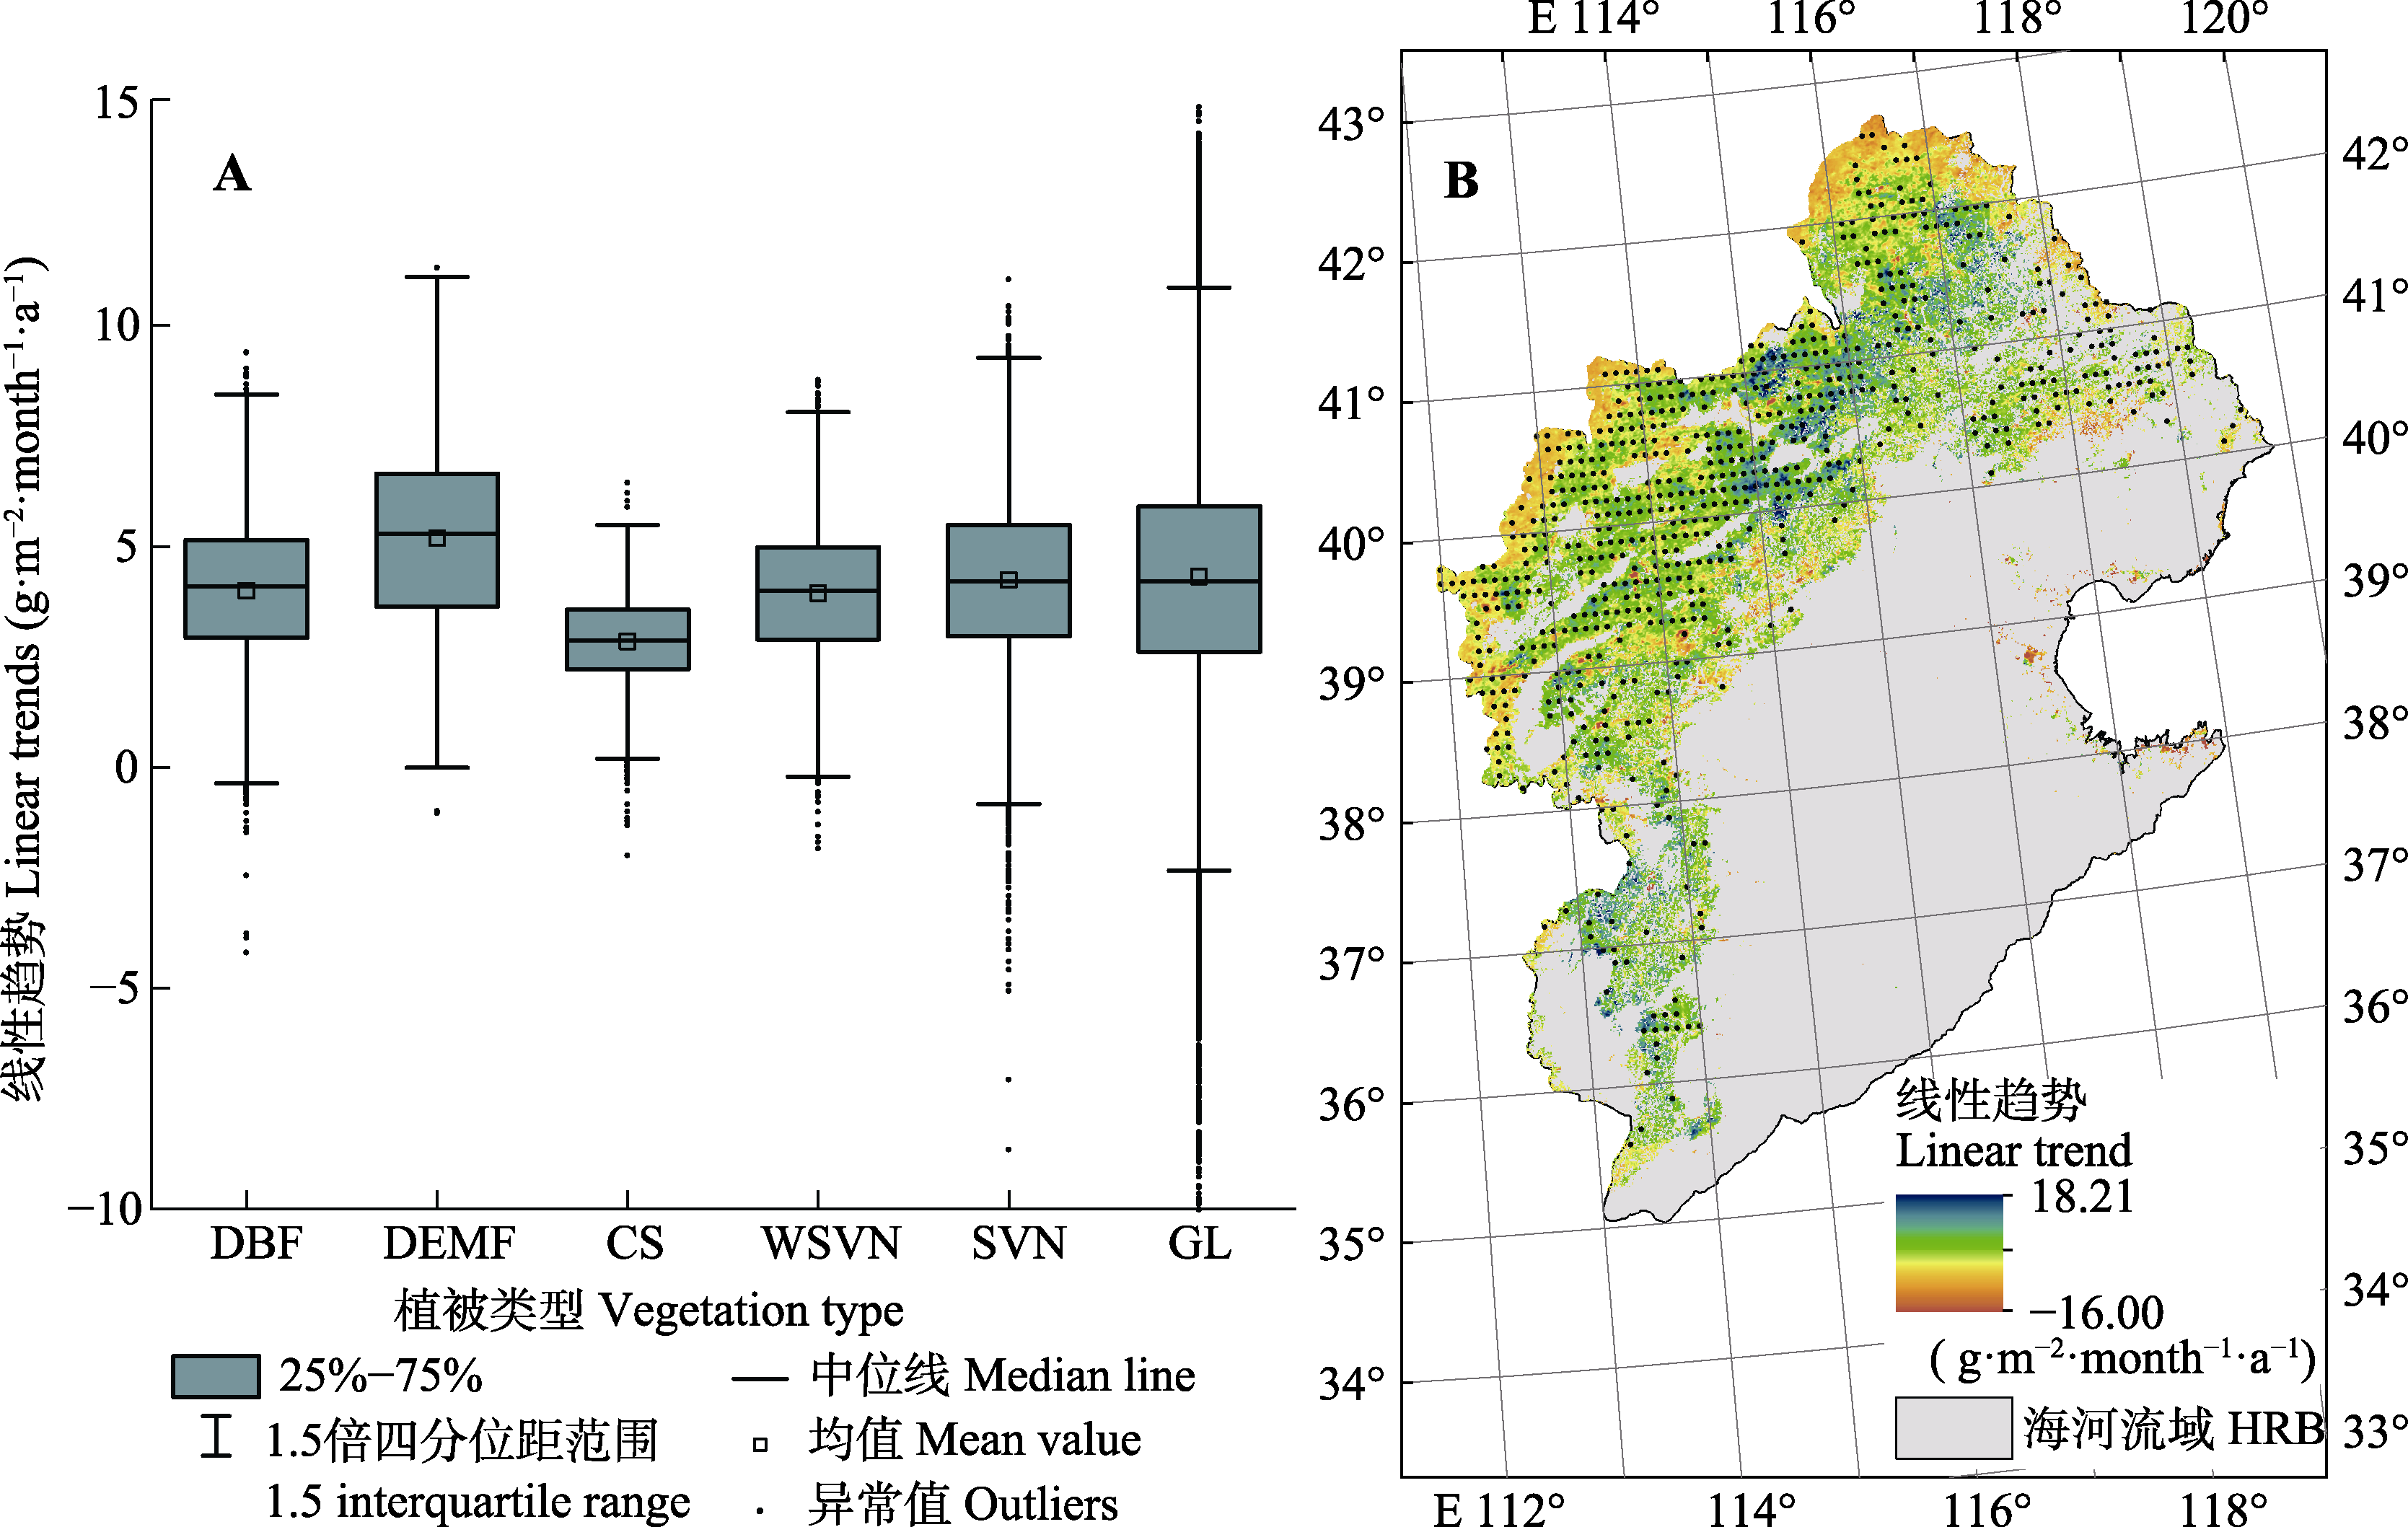
图4 海河流域自然植被净初级生产力(NPP)变化趋势(A)和线性趋势空间分布图(B)。CS, 郁闭灌丛; DBF, 落叶阔叶林; DEMF, 落叶-常绿混交林; GL, 草原; SVN, 稀树草原; WSVN, 多树草原。B中每个黑点代表0.1° × 0.1°范围内的样本存在通过Mann-Kendall检验的单调趋势, 且平均p < 0.05。
Fig. 4 Trends of natural vegetation net primary productivity (NPP) changes (A) and spatial distribution of linear trends of natural vegetation NPP changes (B) in the Hai River Basin. CS, closed shrubland; DBF, deciduous broadleaf forest; DEMF, deciduous-evergreen mixed forest; GL, grassland; HRB, the Hai River Basin; SVN, savanna; WSVN, woody savanna. Each black dot in B indicates samples within the 0.1° × 0.1° grid are with significant monotonic tendency confirmed through Mann-Kendall method, with average p < 0.05.
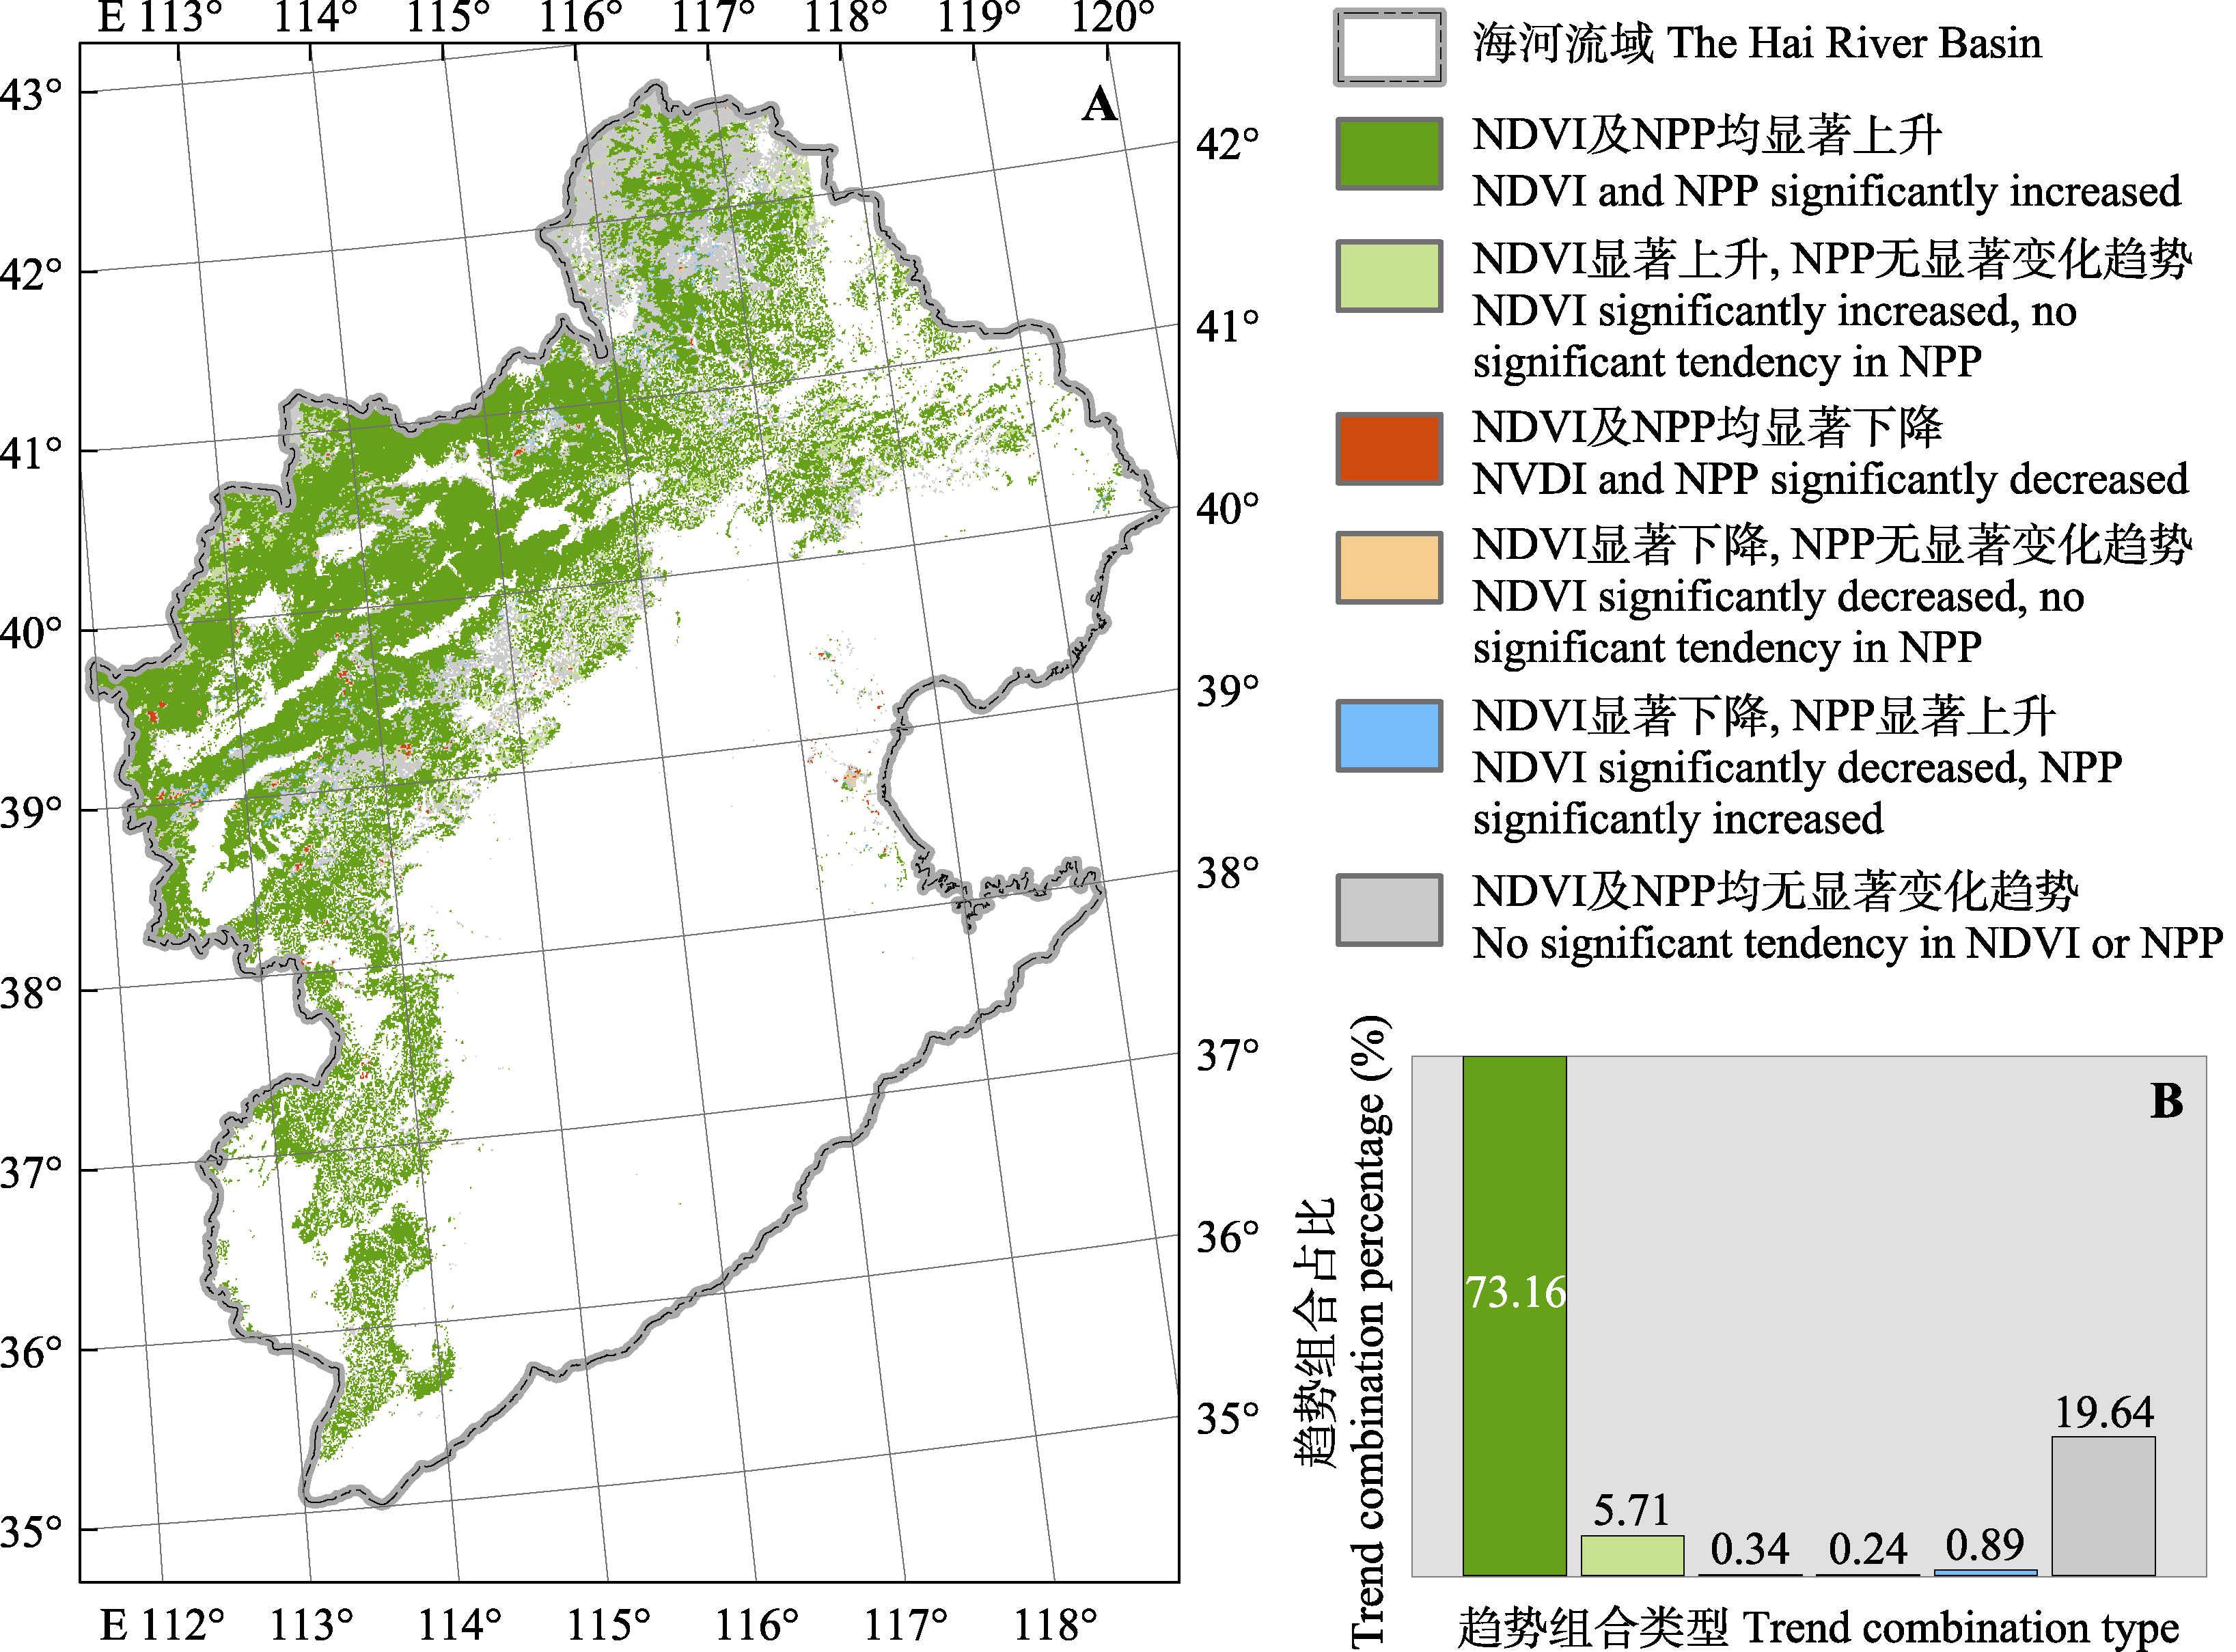
图5 海河流域自然植被净初级生产力(NPP)和归一化植被指数(NDVI) Mann-Kendall检验结果空间分布(A)和Mann-Kendall检验结果数量分布(B)。
Fig. 5 Spatial distribution of Mann-Kendall test results of natural vegetation net primary productivity (NPP) and normalized differential vegetation index (NDVI) changes in the Hai River Basin (A) and quantitative distribution of the Mann-Kendall test results (B).
| 分布参数 Distribution parameter | 落叶阔叶林 Deciduous broadleaf forest | 落叶-常绿混交林 Deciduous-evergreen mixed forest | 郁闭灌丛 Closed shrubland | 多树草原 Woody savanna | 稀树草原 Savanna | 草原 Grassland |
|---|---|---|---|---|---|---|
| 标准差 Standard deviation (g·m-2·month-1) | 42.18 | 46.67 | 27.15 | 37.51 | 35.66 | 38.12 |
| 选定样本数量比 Quantitative proportion of the chosen samples (%) | 25.16 | 25.09 | 29.03 | 26.67 | 25.33 | 23.63 |
| 选定样本质量比 Qualitative proportion of the chosen samples (%) | 60.54 | 59.70 | 61.97 | 59.82 | 58.54 | 56.67 |
表3 海河流域自然植被净初级生产力变幅(ΔNPP)分布表
Table 3 Distribution of natural vegetation net primary productivity changes (ΔNPP) in the Hai River Basin
| 分布参数 Distribution parameter | 落叶阔叶林 Deciduous broadleaf forest | 落叶-常绿混交林 Deciduous-evergreen mixed forest | 郁闭灌丛 Closed shrubland | 多树草原 Woody savanna | 稀树草原 Savanna | 草原 Grassland |
|---|---|---|---|---|---|---|
| 标准差 Standard deviation (g·m-2·month-1) | 42.18 | 46.67 | 27.15 | 37.51 | 35.66 | 38.12 |
| 选定样本数量比 Quantitative proportion of the chosen samples (%) | 25.16 | 25.09 | 29.03 | 26.67 | 25.33 | 23.63 |
| 选定样本质量比 Qualitative proportion of the chosen samples (%) | 60.54 | 59.70 | 61.97 | 59.82 | 58.54 | 56.67 |
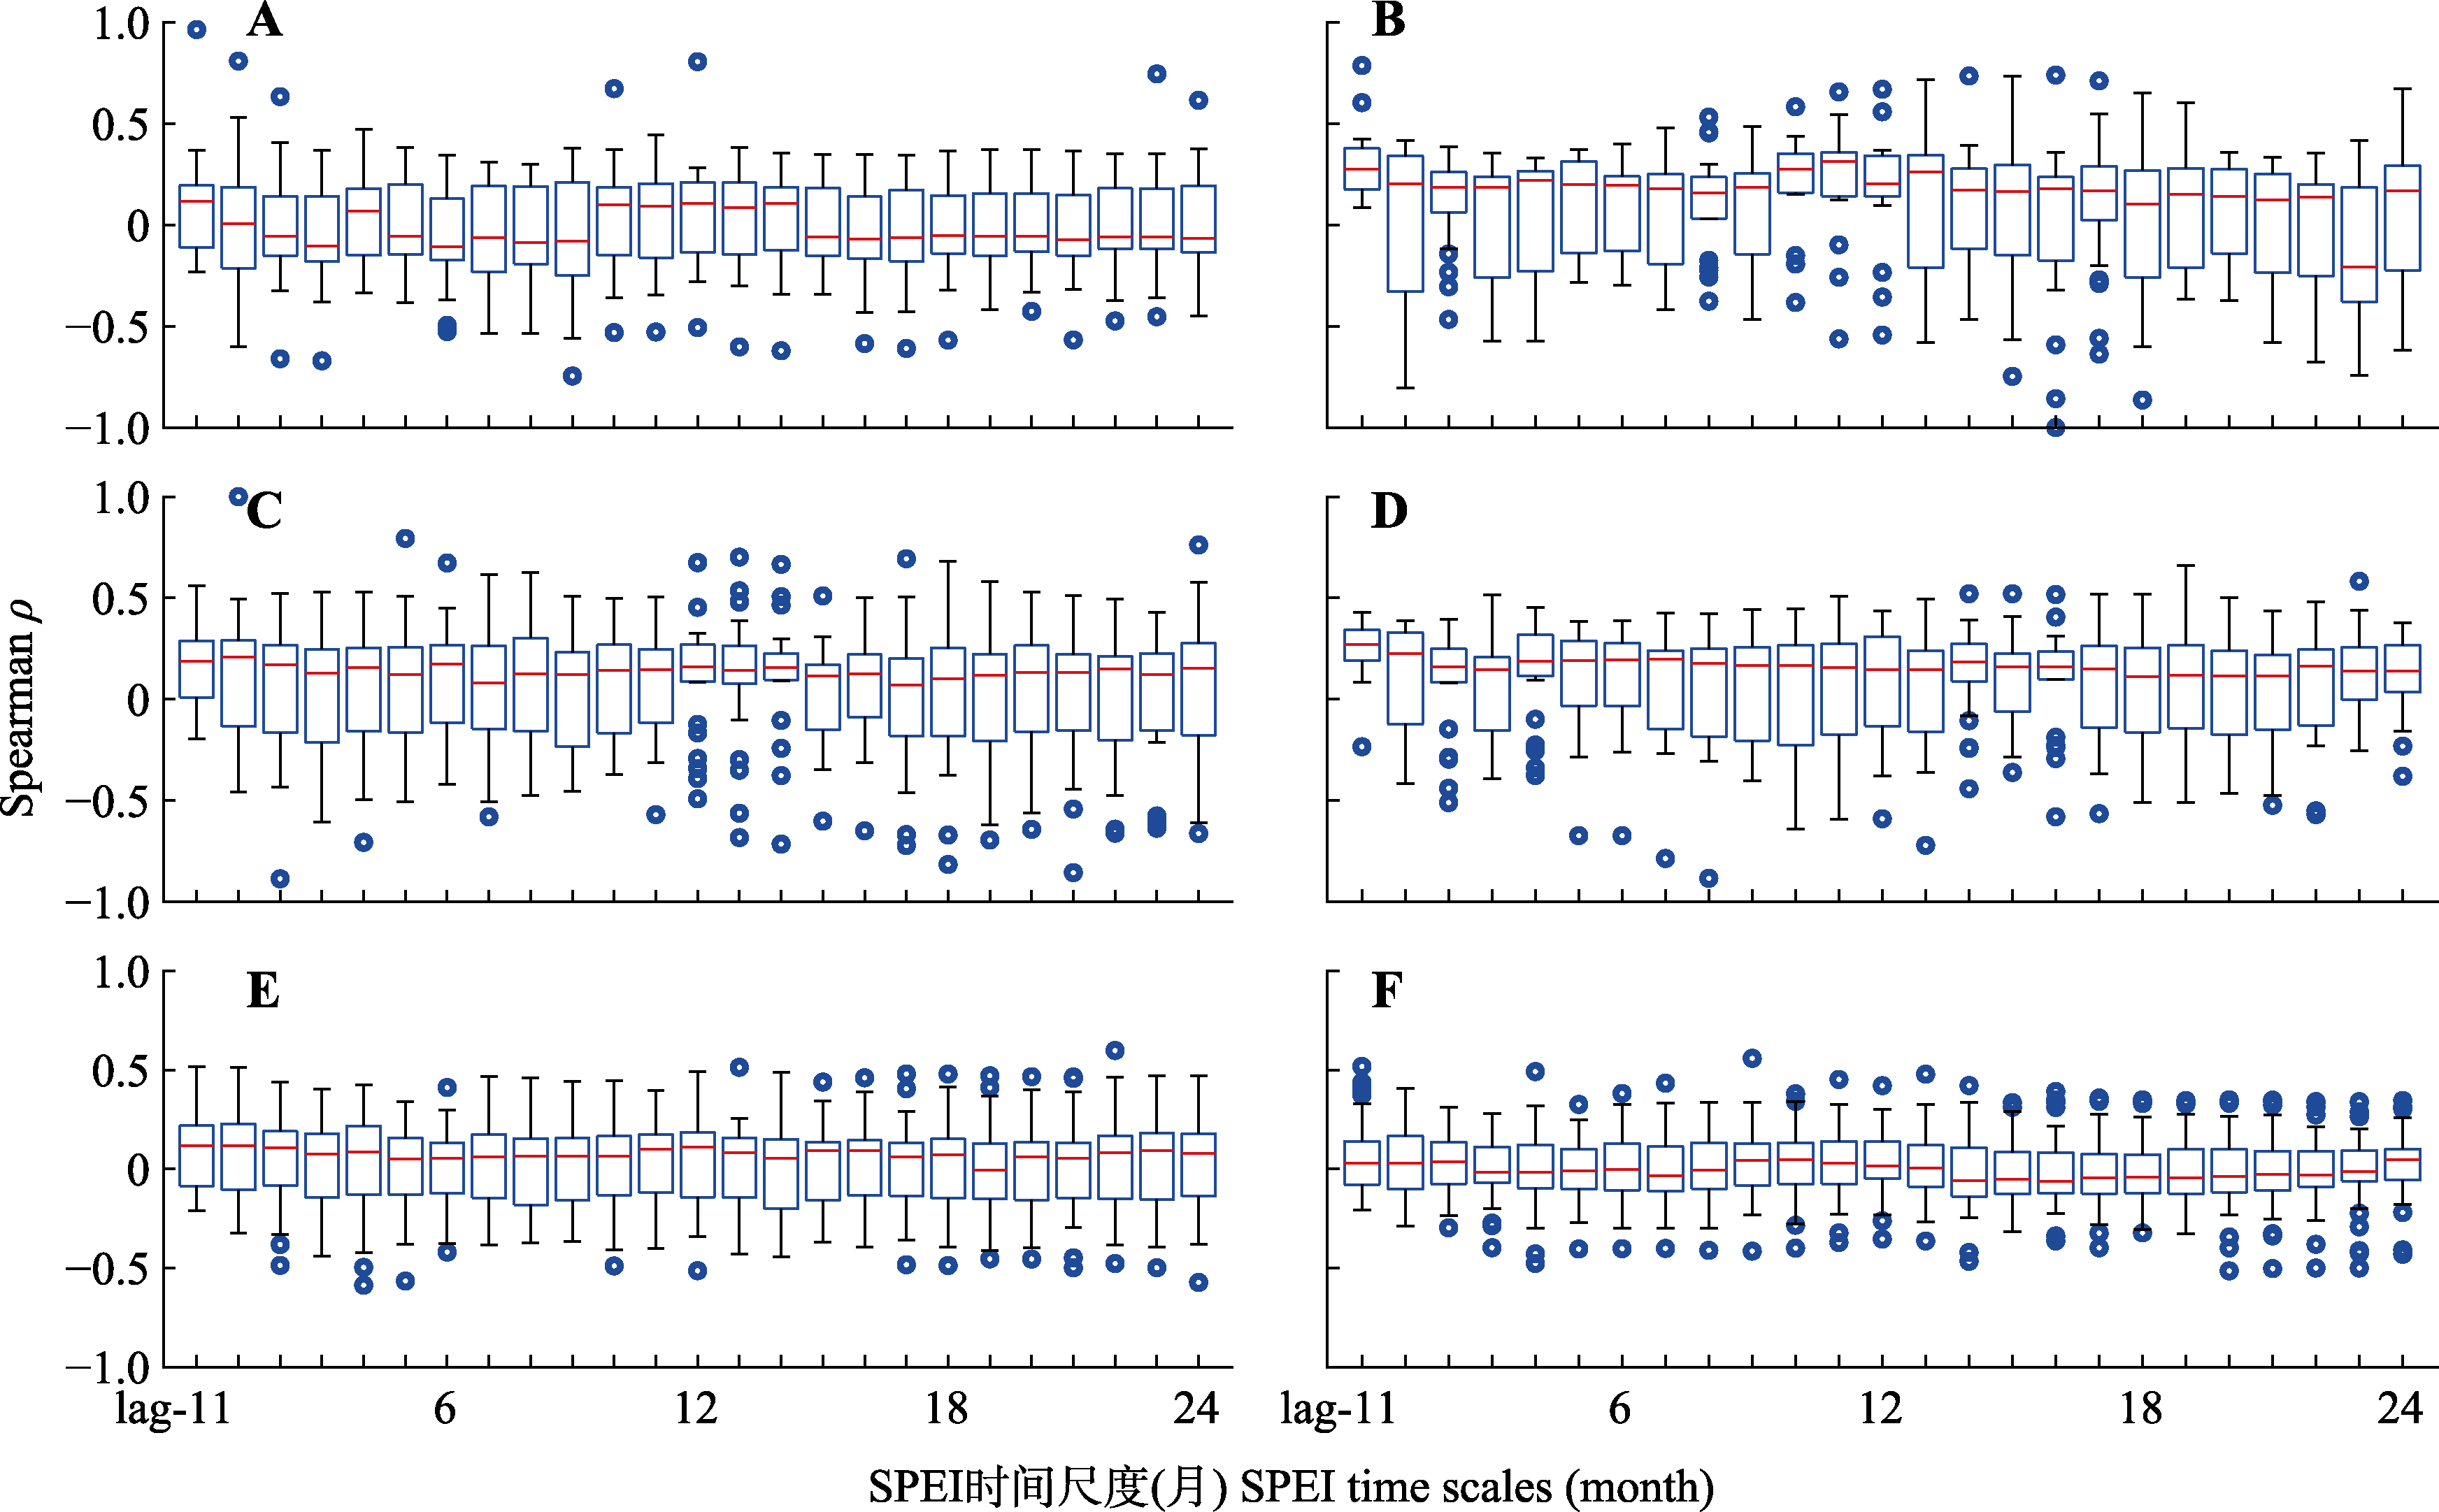
图6 海河流域净初级生产力变幅(ΔNPP)-标准化降水蒸散指数(SPEI) Spearman秩相关系数(ρ)随SPEI时间尺度分布图。A, 落叶阔叶林。B, 落叶-常绿混交林。C, 郁闭灌丛。D, 多树草原。E, 稀树草原。F, 草原。
Fig. 6 Distribution of Spearman rank correlation coefficient (ρ) between net primary productivity changes (ΔNPP) and standardized precipitation evapotranspiration index (SPEI) in the Hai River Basin along SPEI time scales. A, Deciduous broadleaf forest. B, Deciduous-evergreen mixed forest. C, Closed shrubland. D, Woody savanna. E, Savanna. F, Grassland.
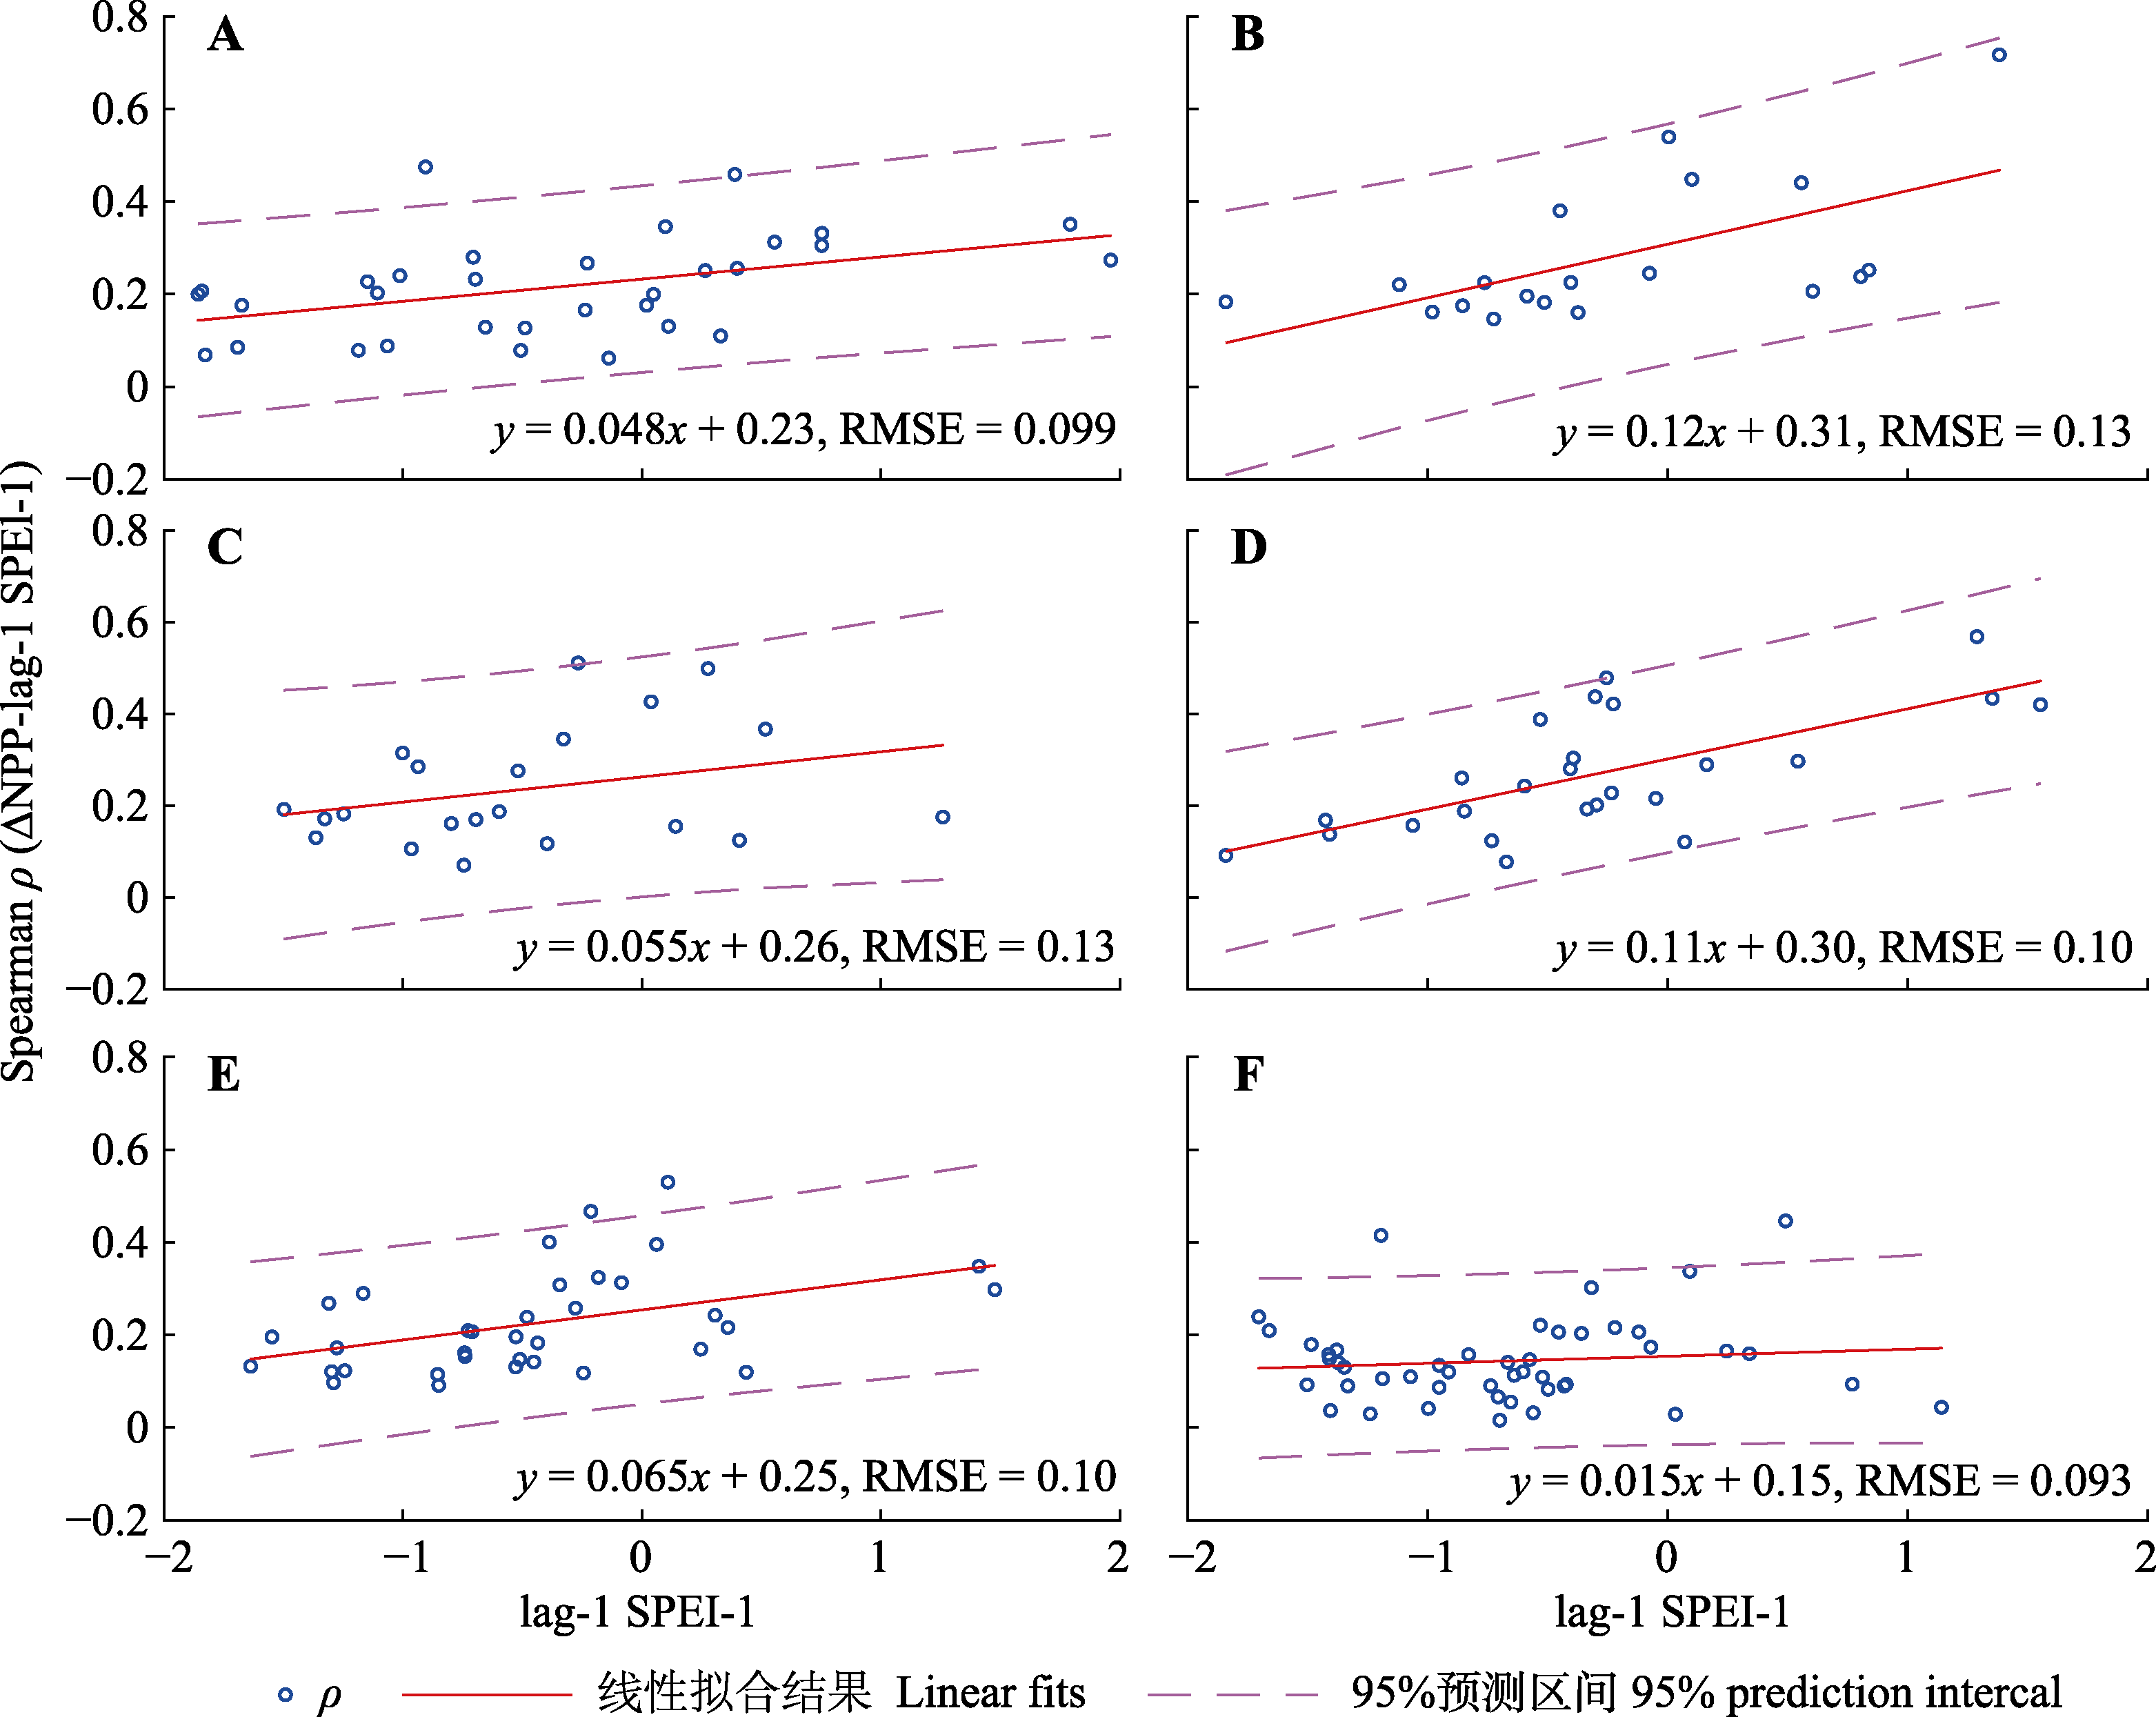
图7 海河流域净初级生产力变幅(ΔNPP)-标准化降水蒸散指数(SPEI) Spearman秩相关系数(ρ)与对应植被类型平均lag-1 SPEI-1线性拟合图。A, 落叶阔叶林。B, 落叶-常绿混交林。C, 郁闭灌丛。D, 多树草原。E, 稀树草原。F, 草原。RMSE, 均方根误差。
Fig. 7 Linear fit of net primary productivity changes (ΔNPP) to standardized precipitation evapotranspiration index (SPEI) Spearman rank correlation coefficient (ρ) and average lag-1 SPEI-1 of the corresponding vegetation types in the Hai River Basin. A, Deciduous broadleaf forest. B, Deciduous-evergreen mixed forest. C, Closed shrubland. D, Woody savanna. E, Savanna. F, Grassland. RMSE, root mean square error.
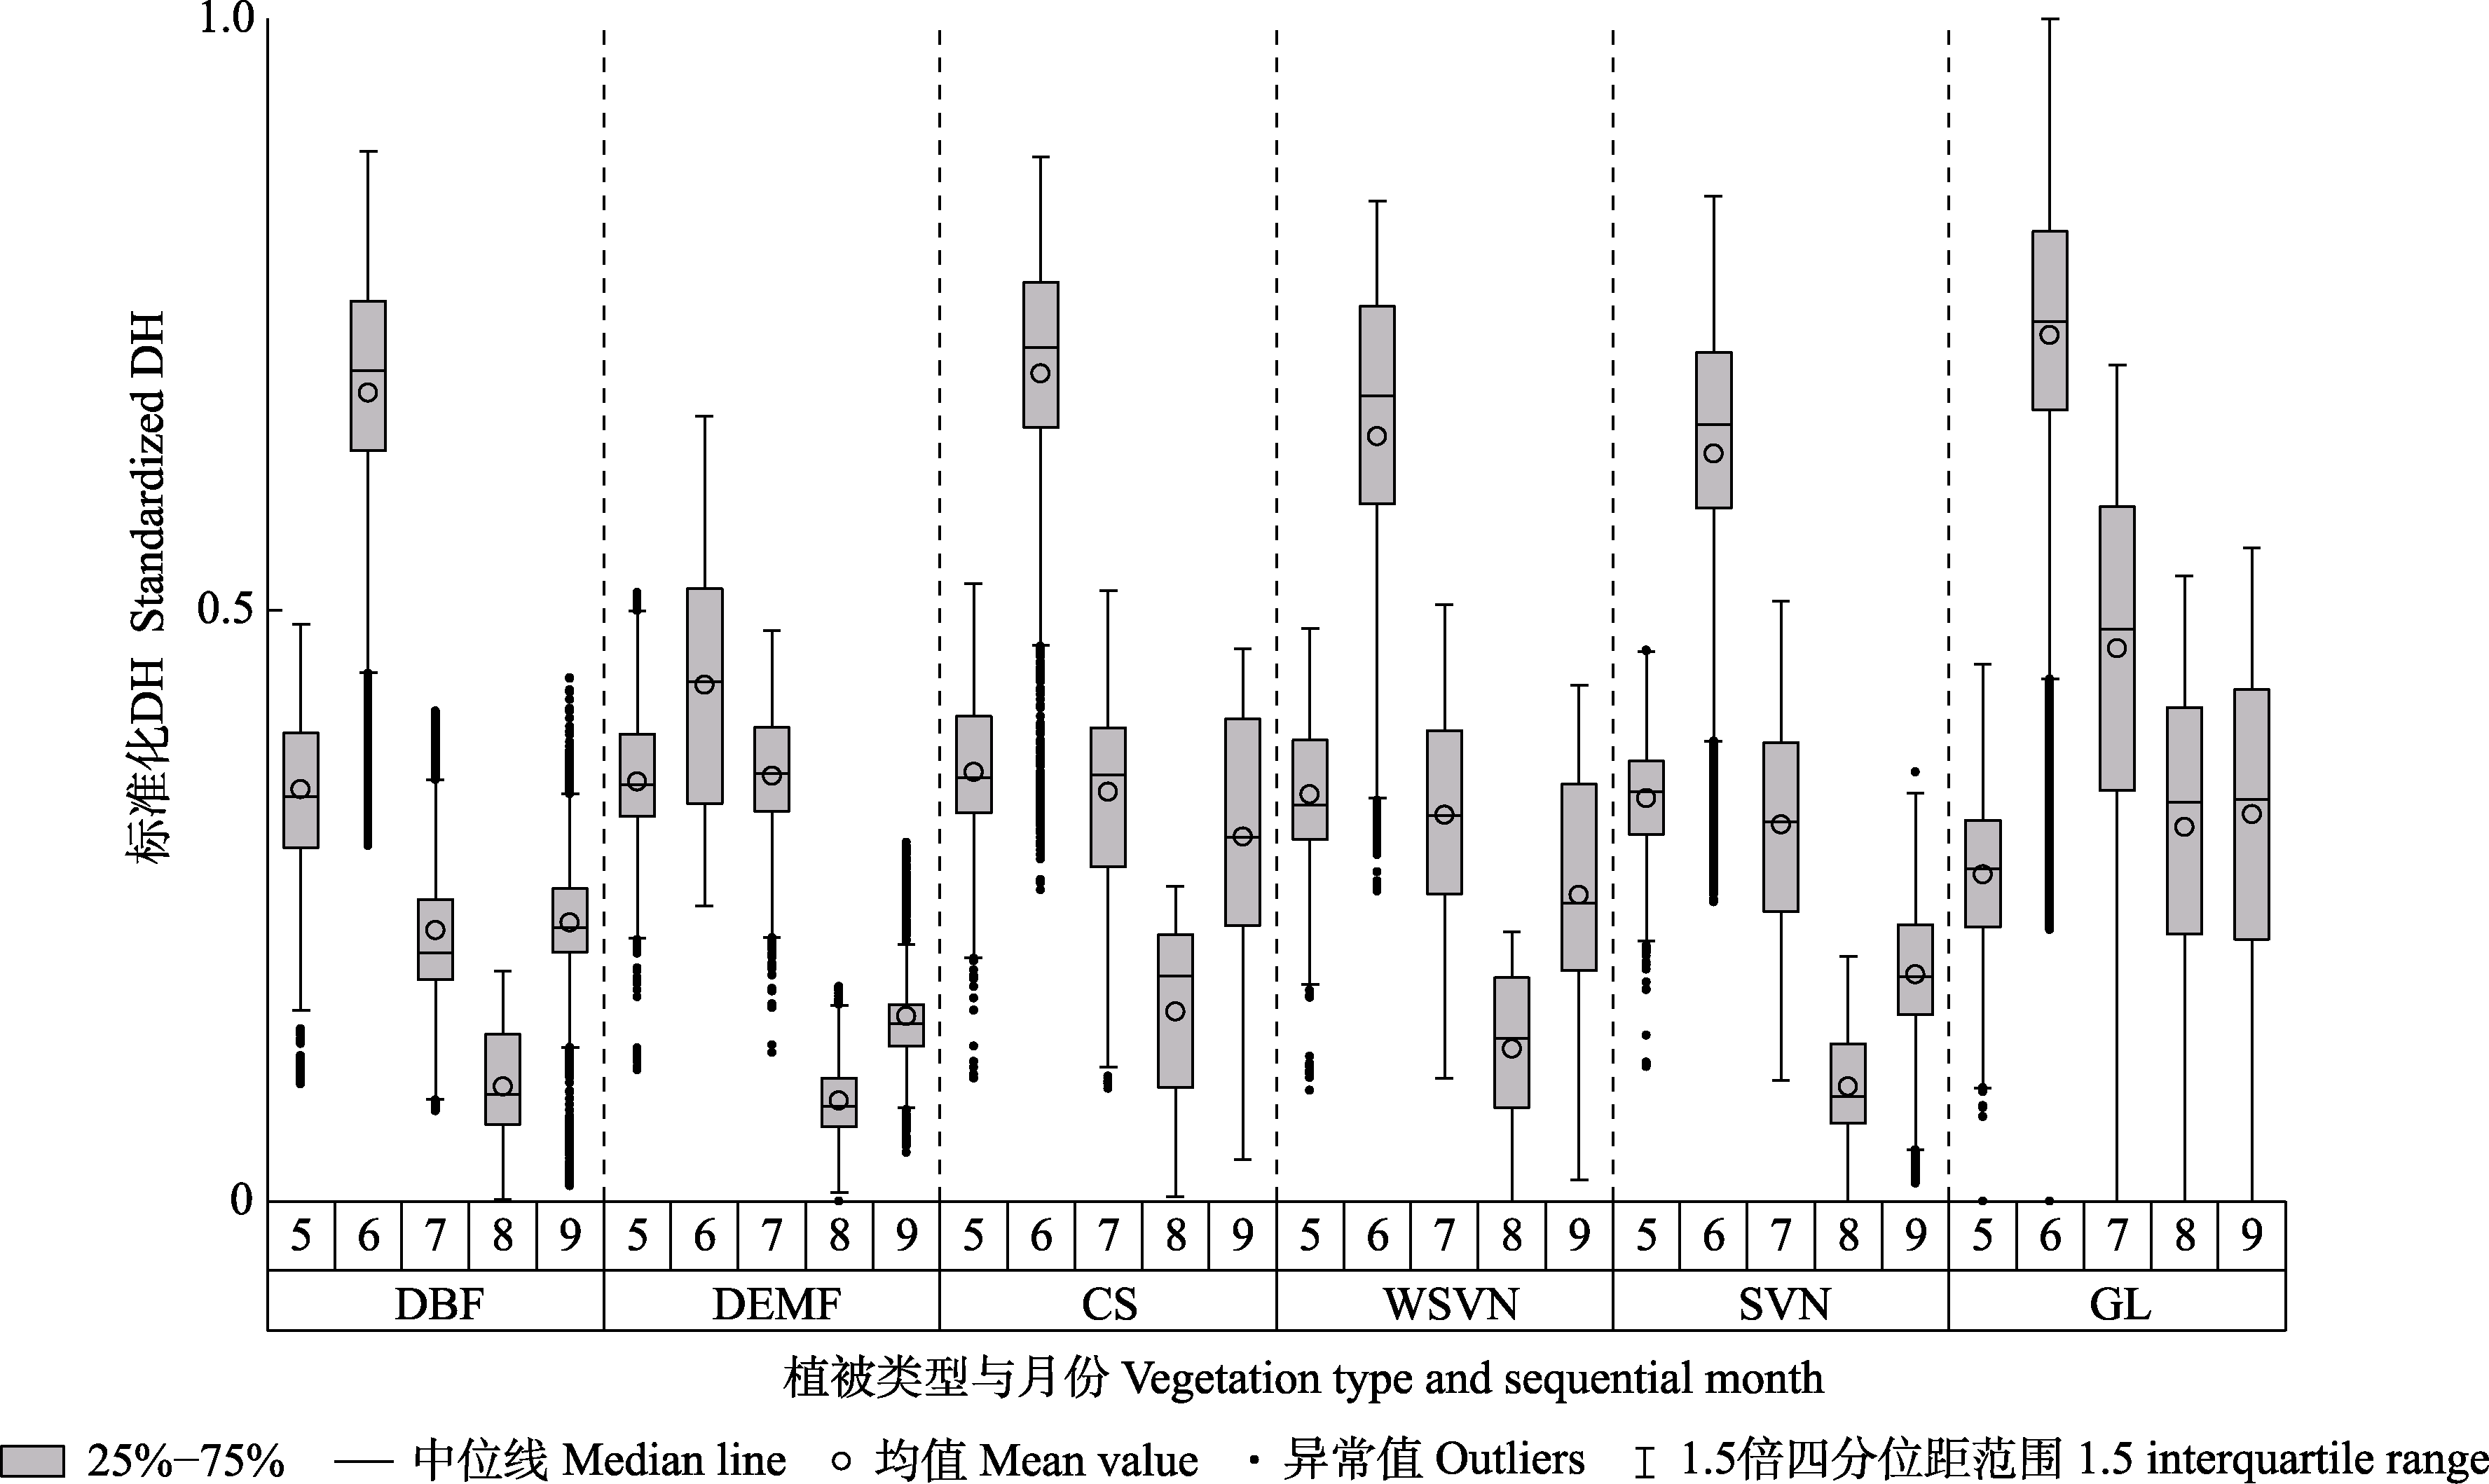
图8 海河流域各类型植被标准化干旱危害指数(DH)分布。CS, 郁闭灌丛; DBF, 落叶阔叶林; DEMF, 落叶-常绿混交林; GL, 草原; SVN, 稀树草原; WSVN, 多树草原。
Fig. 8 Distribution of standardized drought hazard (DH) in the Hai River Basin, listed by vegetation type. CS, closed shrubland; DBF, deciduous broadleaf forest; DEMF, deciduous-evergreen mixed forest; GL, grassland; SVN, savanna; WSVN, woody savanna
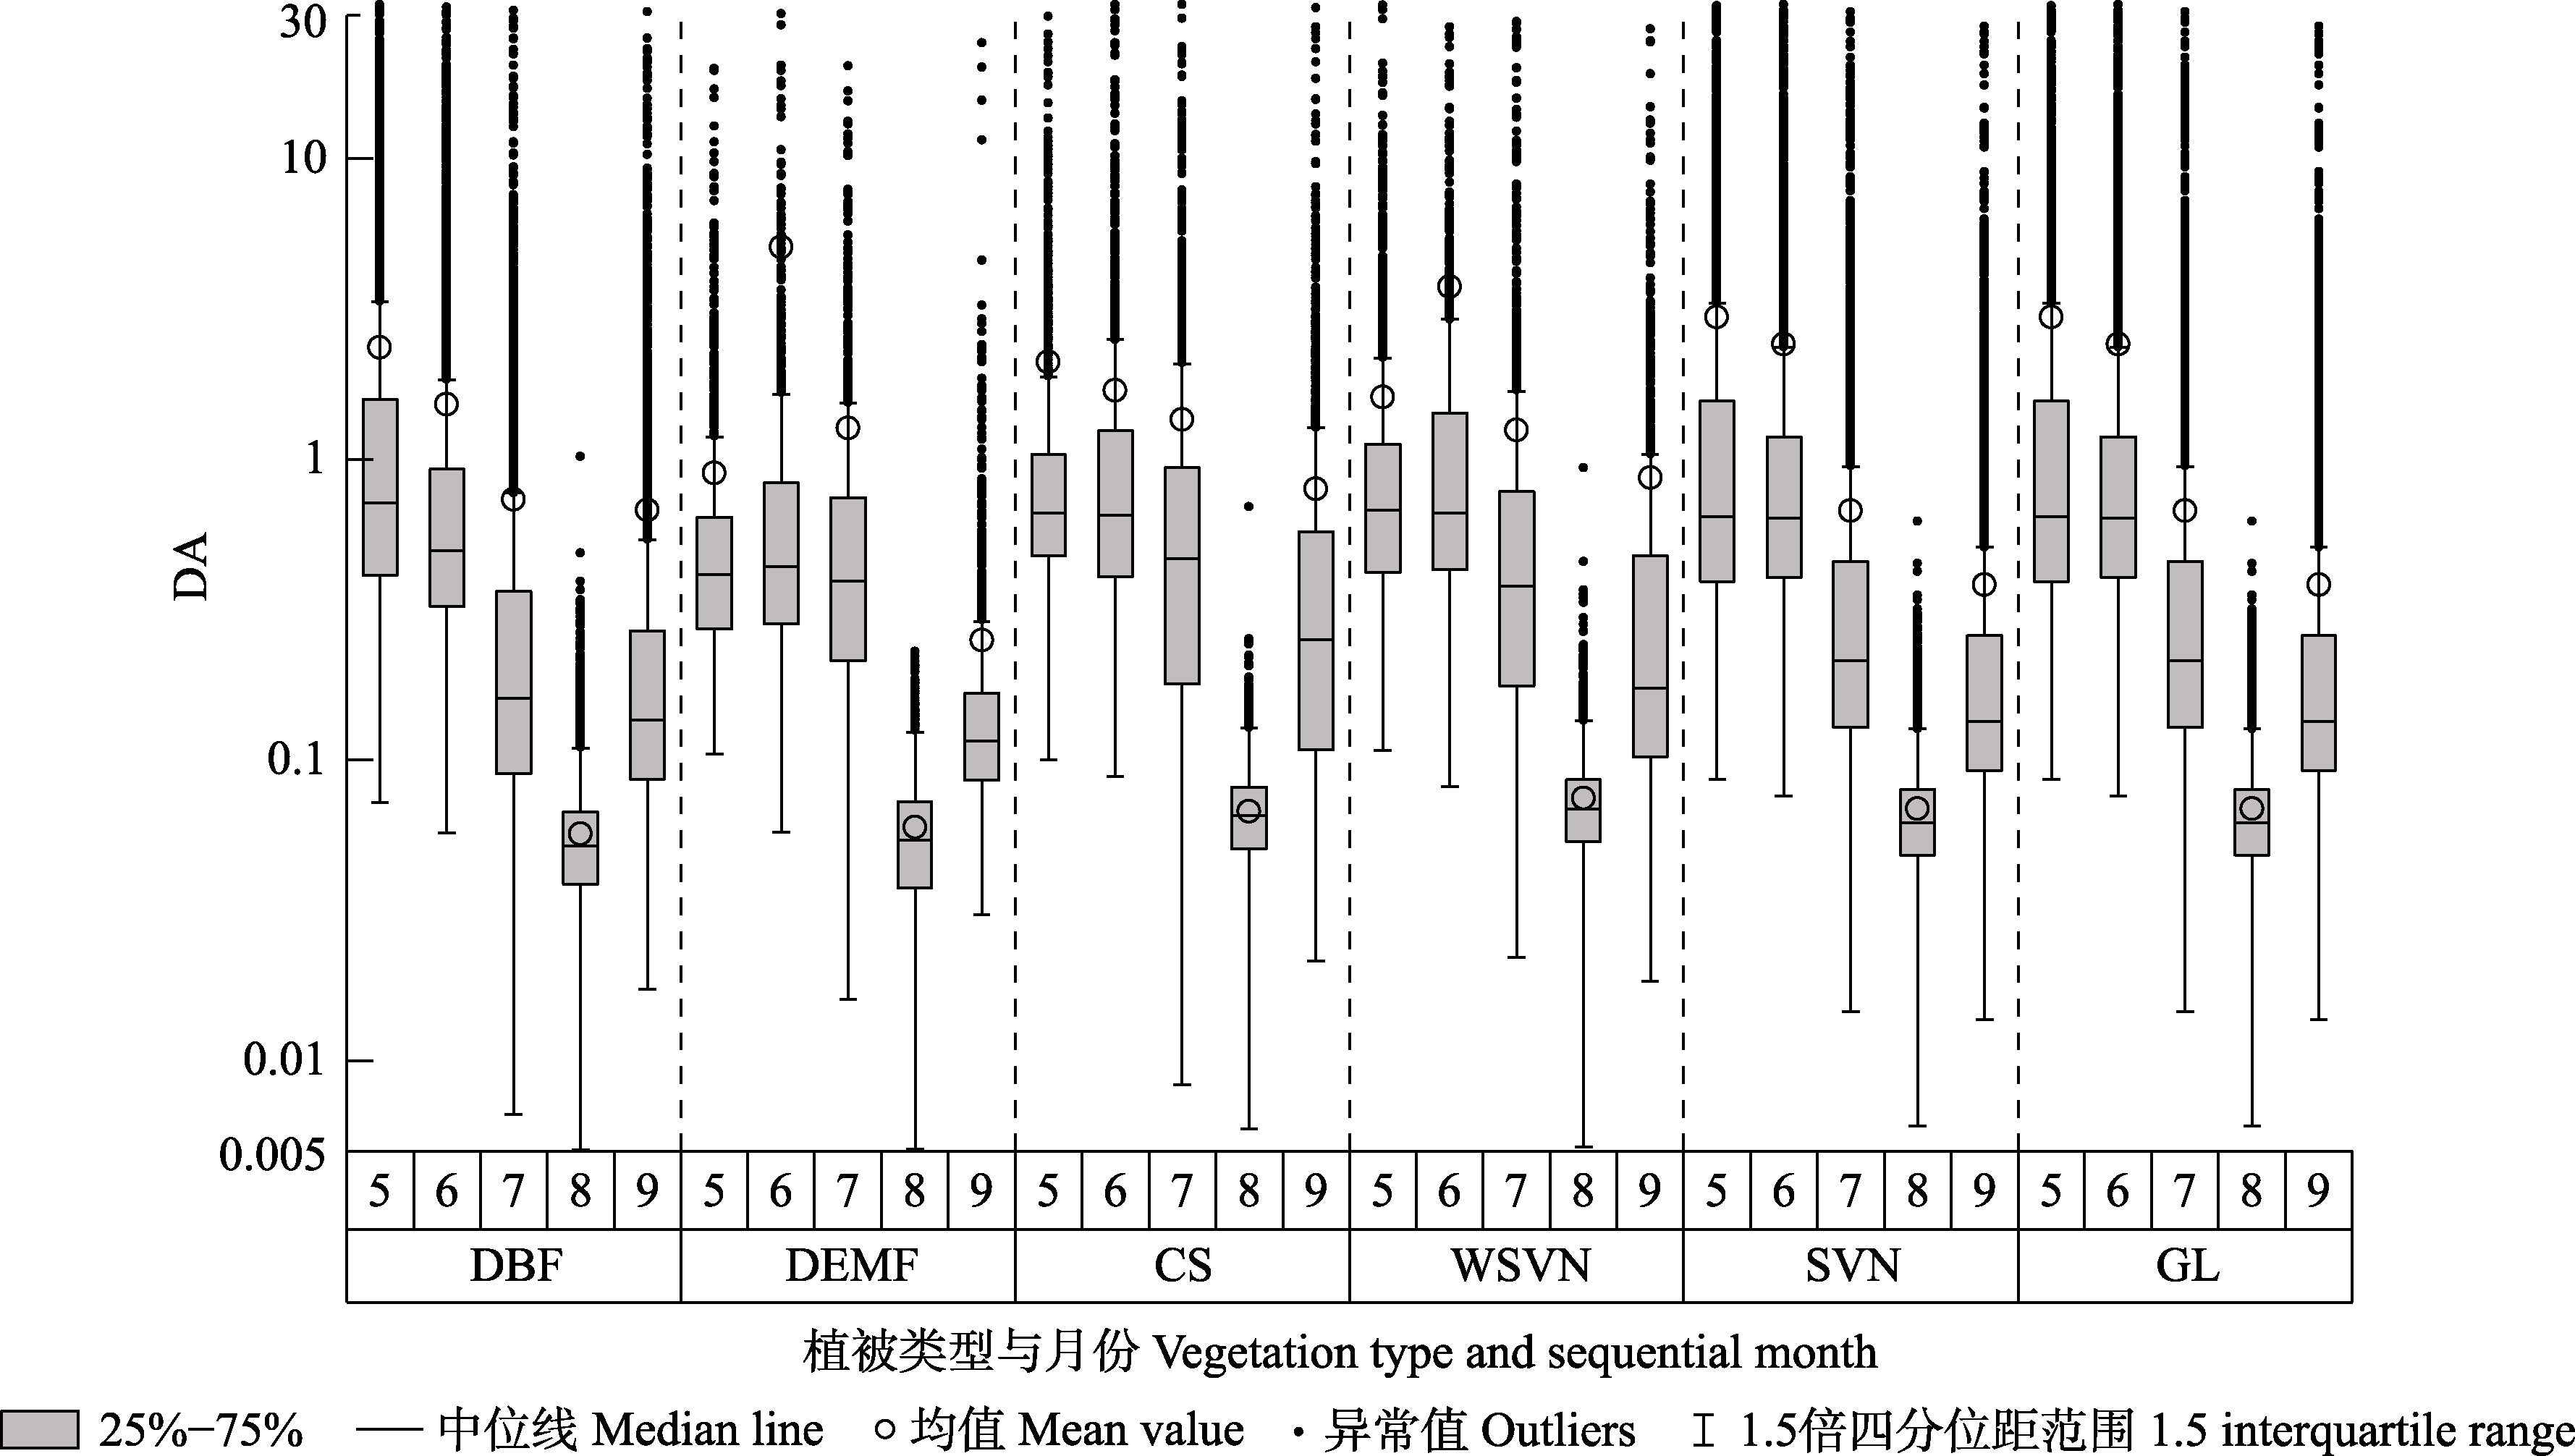
图9 海河流域各类型植被干旱适应性(DA)值分布。CS, 郁闭灌丛; DBF, 落叶阔叶林; DEMF, 落叶-常绿混交林; GL, 草原; SVN, 稀树草原; WSVN, 多树草原。
Fig. 9 Distribution of drought adaptability (DA) in the Hai River Basin, listed by vegetation type. CS, closed shrubland; DBF, deciduous broadleaf forest; DEMF, deciduous-evergreen mixed forest; GL, grassland; SVN, savanna; WSVN, woody savanna.
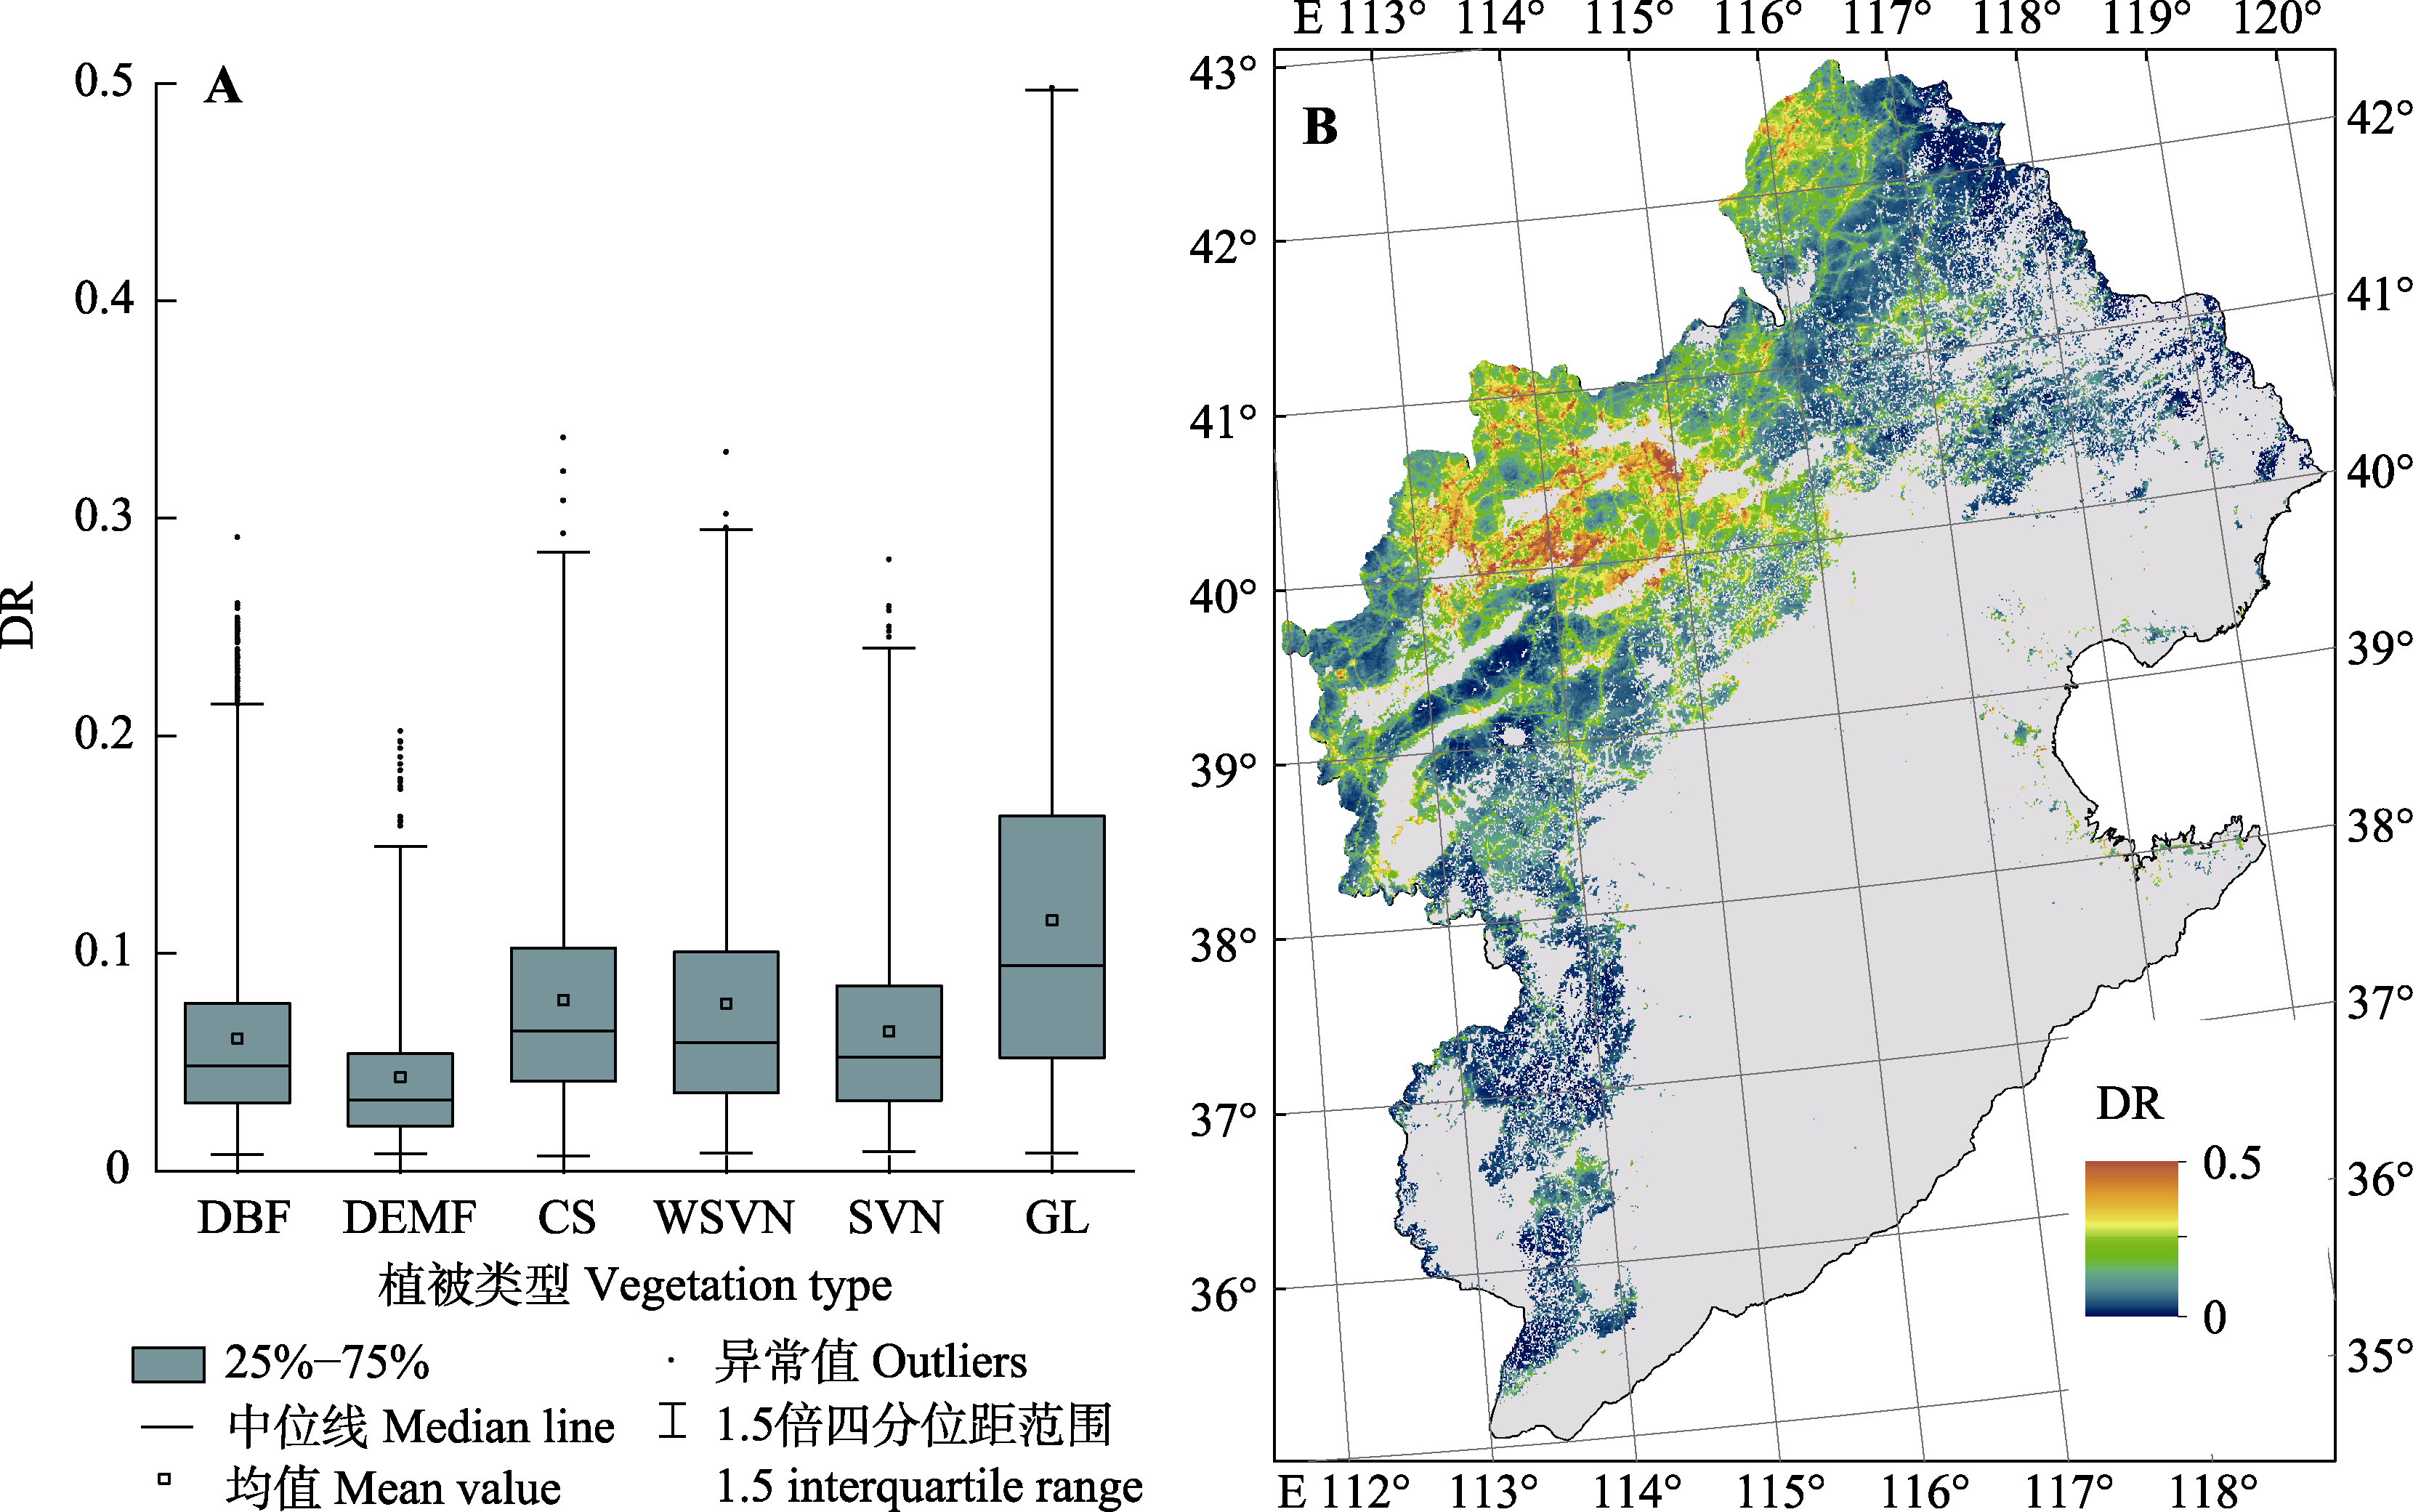
图10 海河流域植被干旱风险(DR)数量分布(A)和空间分布(B)。CS, 郁闭灌丛; DBF, 落叶阔叶林; DEMF, 落叶-常绿混交林; GL, 草原; SVN, 稀树草原; WSVN, 多树草原。
Fig. 10 Quantitative (A) and spatial (B) distribution of vegetation drought risk (DR) in the Hai River Basin. CS, closed shrubland; DBF, deciduous broadleaf forest; DEMF, deciduous-evergreen mixed forest; GL, grassland; SVN, savanna; WSVN, woody savanna.
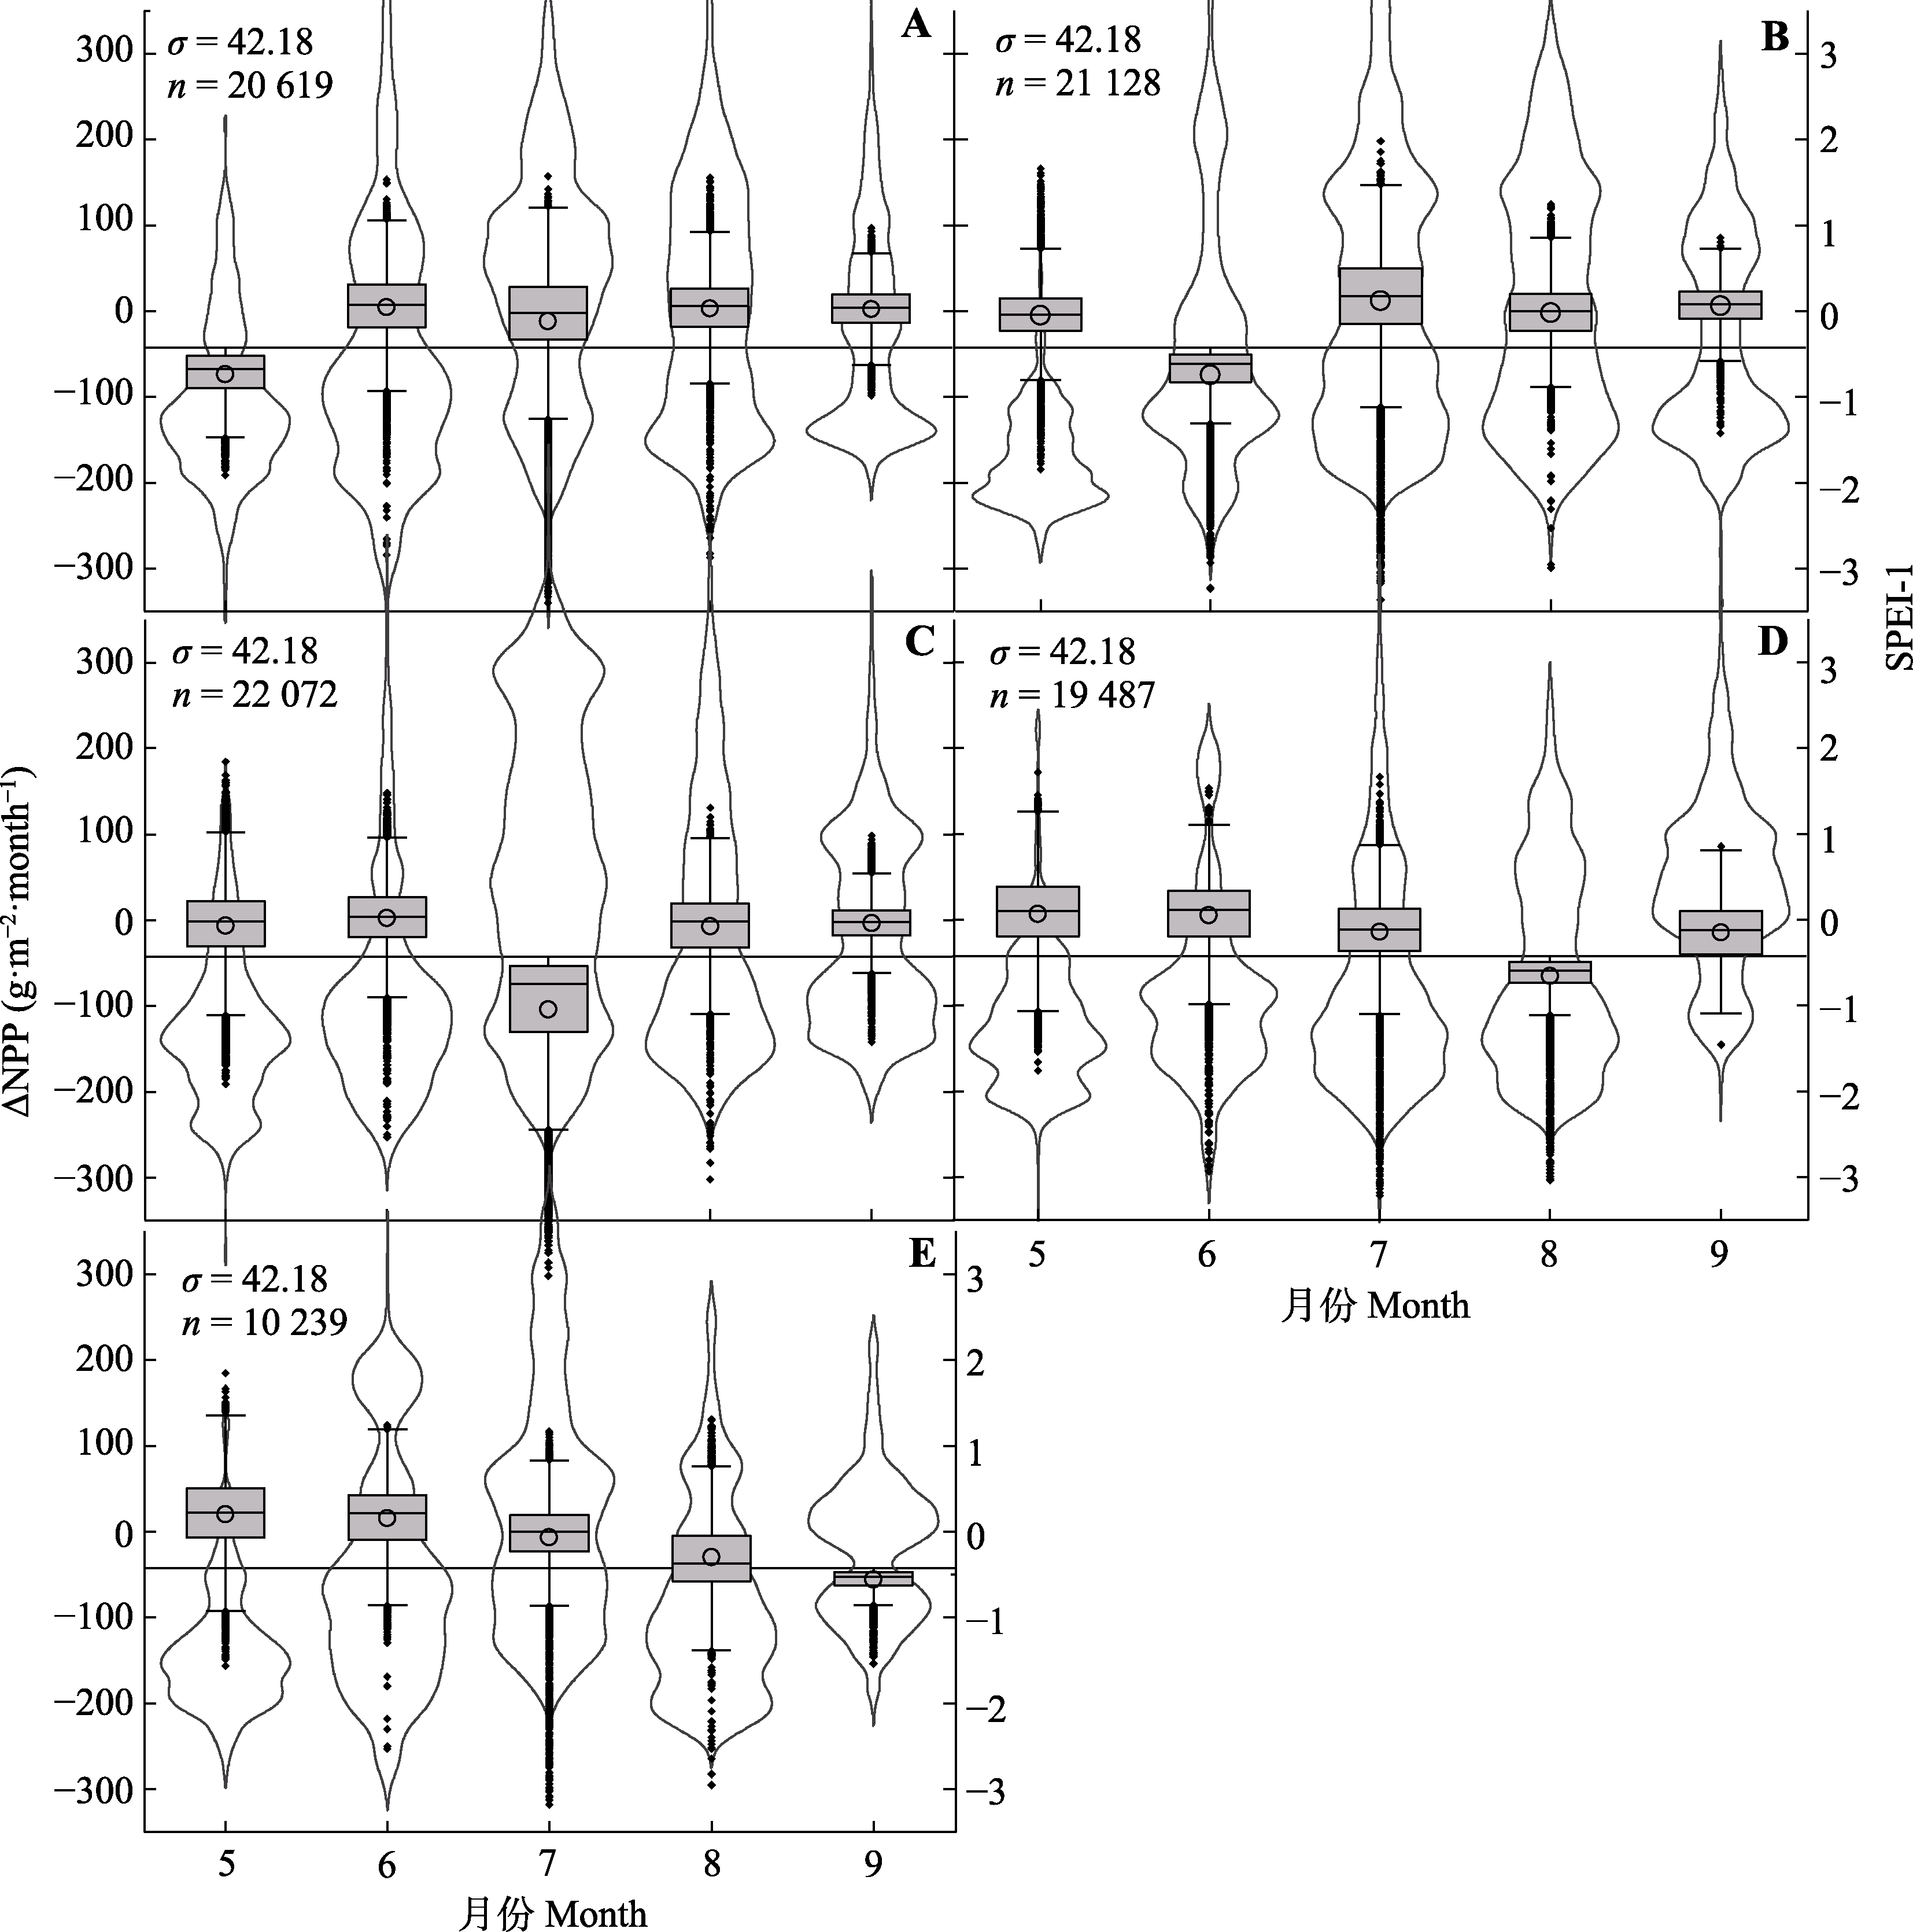
图11 落叶阔叶林全生长季净初级生产力变幅(∆NPP)箱线图和1个月尺度的标准化降水蒸散指数(SPEI-1)提琴图。提琴图对应SPEI的概率密度分布, 箱线图箱体代表25%-75%范围, 中间线代表中位数, 空心圆代表均值, 须线代表1.5倍四分位距, 菱形点代表异常值。A-E依次为5-9月NPP明显下降。
Fig. 11 Net primary productivity changes (∆NPP) boxplot and 1-month standardized precipitation evapotranspiration index (SPEI-1) violin plot of the whole growing season. The violin plot indicates probability density distribution of SPEI, in the boxplot, the box indicates 25%-75% distribution range, the middle line indicates the median value, the hollow circle indicates mean value, the whiskers indicate 1.5 interquartile range, the rhombuses indicate outliers. A-E correspond the situation in which NPP declined distinctly in May, June, …, September.
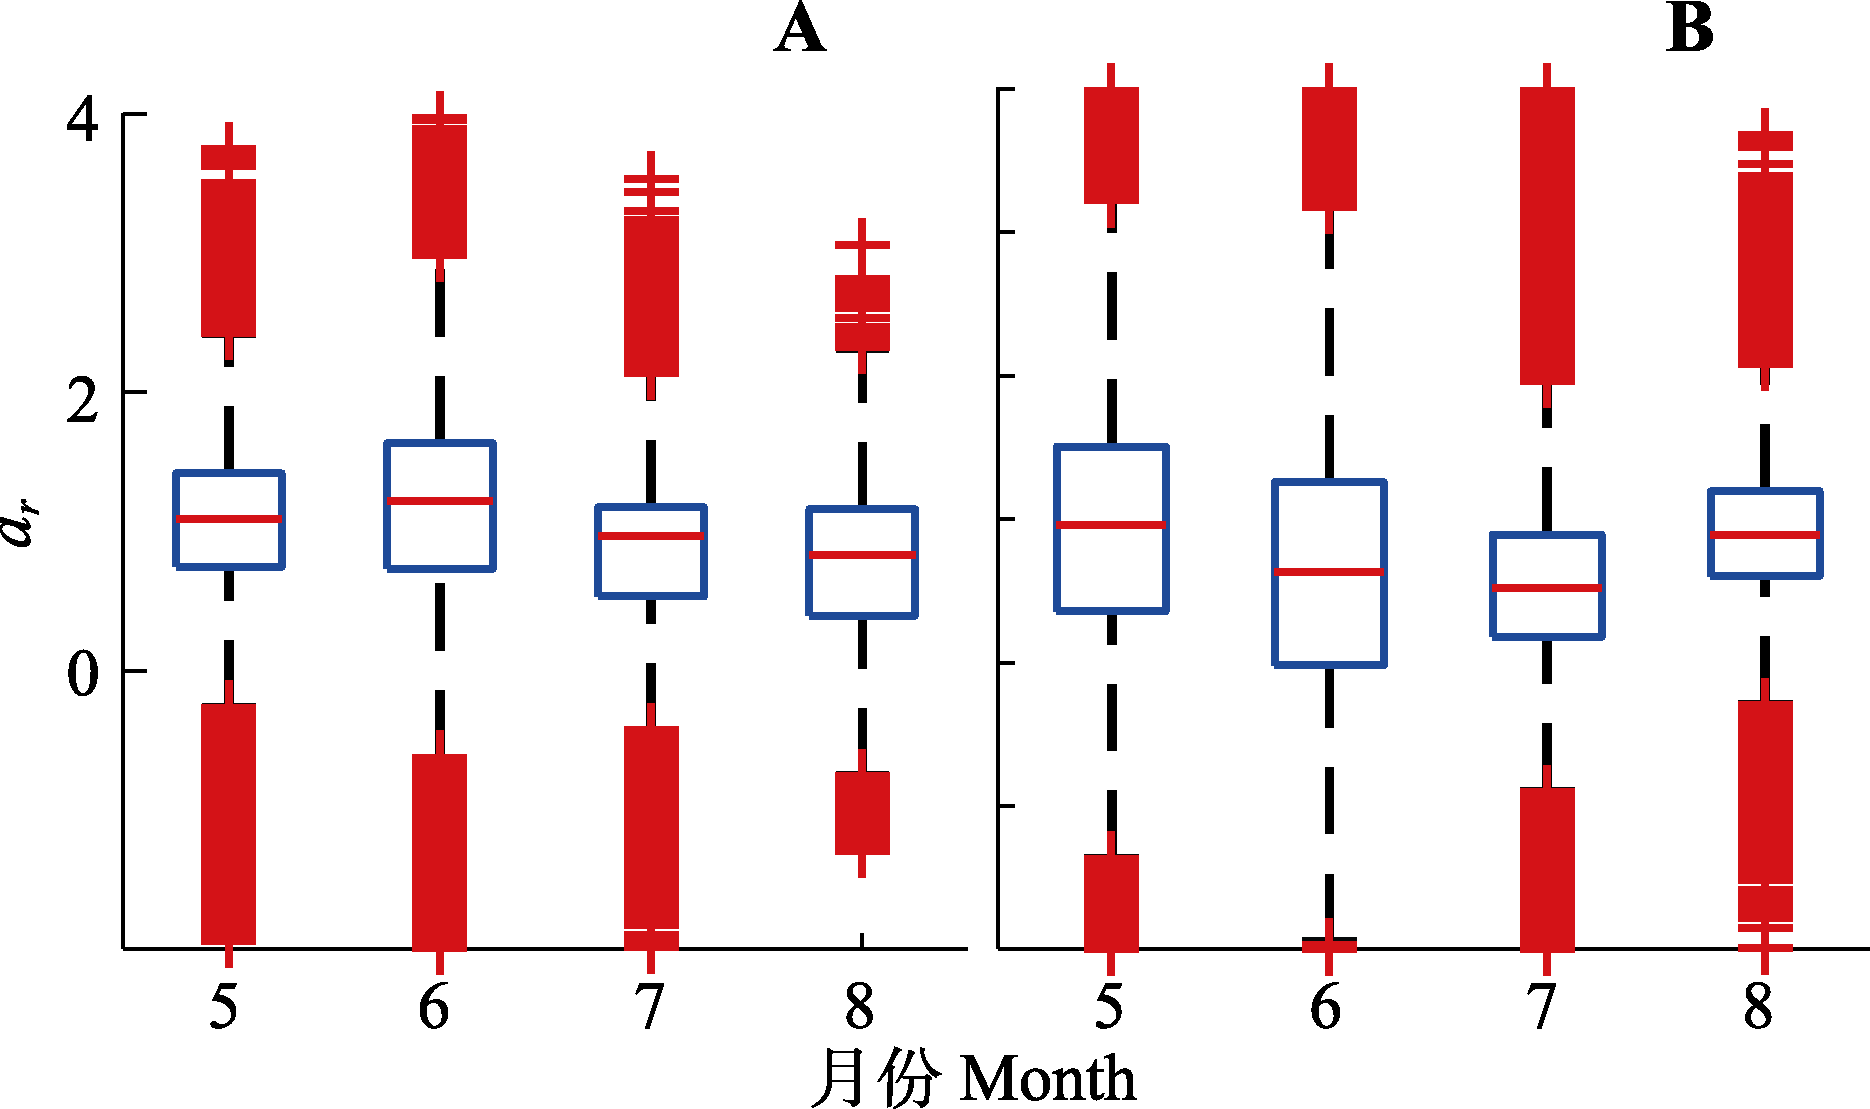
图12 森林类(A)和灌草类(B)植被净初级生产力(NPP)弹性幅度(ar)对比图。
Fig. 12 Net primary productivity (NPP) resilience amplitude (ar) of forest (A) and shrub/grass (B) vegetation.
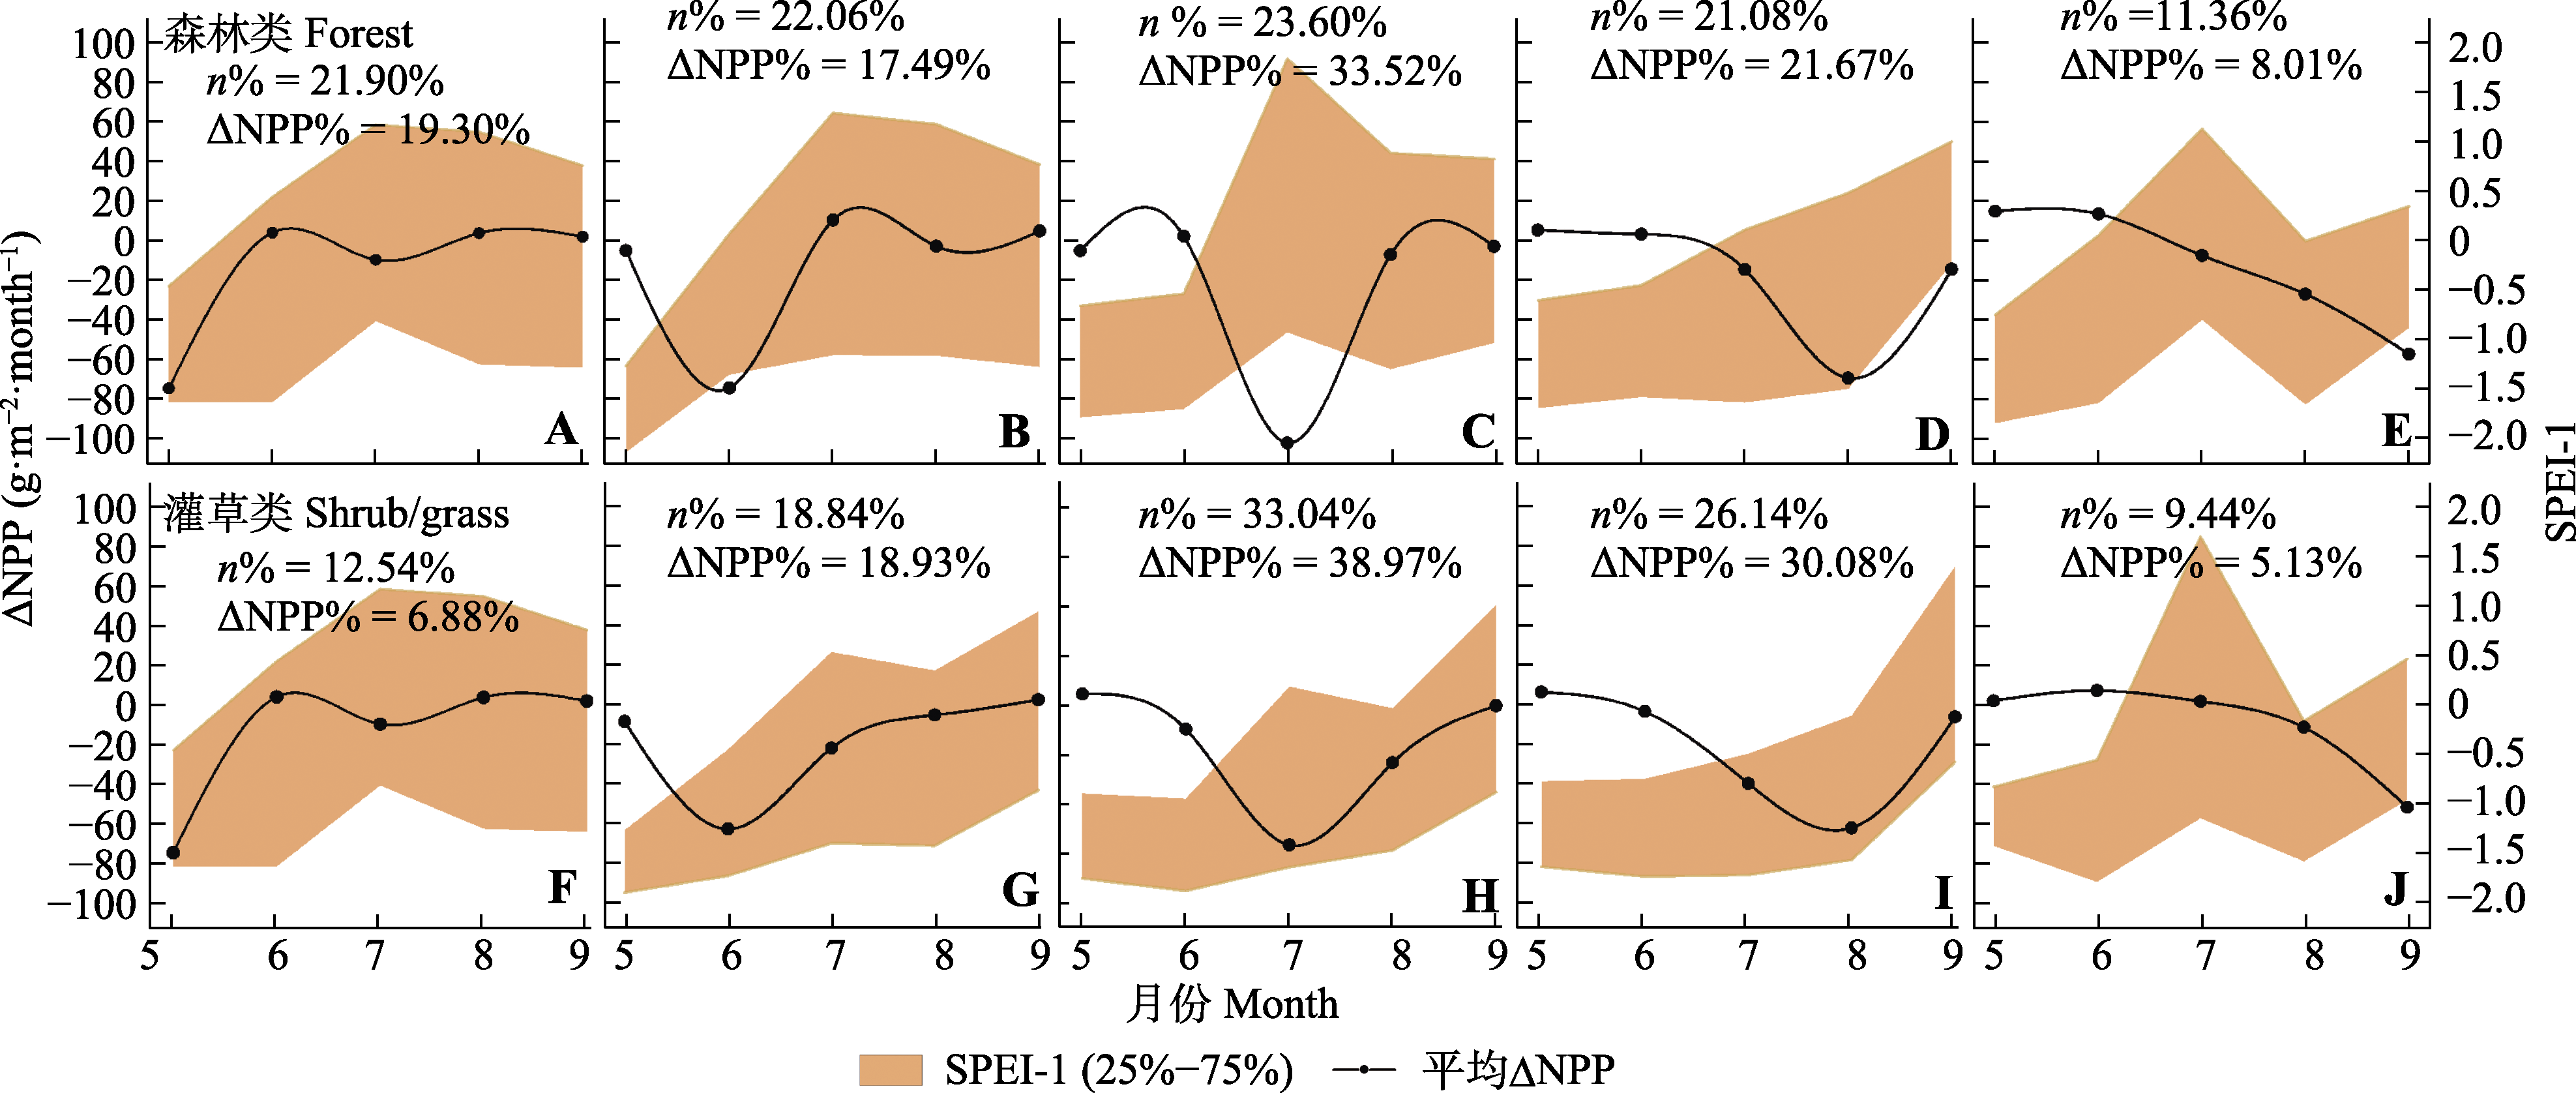
图13 海河流域植被净初级生产力变幅(∆NPP)对1个月尺度的标准化降水蒸散指数(SPEI-1)的典型响应过程。A-E分别为森林类5-9月NPP发生明显下降时, 全生长季SPEI-1和∆NPP变化模式。F-J分别为灌草类5-9月NPP发生明显下降时, 全生长季SPEI-1和∆NPP变化模式。
Fig. 13 Typical response pattern of vegetation net primary productivity changes (∆NPP) to 1-month standardized precipitation evapotranspiration index (SPEI-1) in the Hai River Basin. A-E present typical SPEI-1 and ∆NPP pattern of forest vegetation when NPP distinctly decrease in May to September, while F-J present typical SPEI-1 and ∆NPP pattern of shrub/grass vegetation when NPP distinctly decrease in May to September.
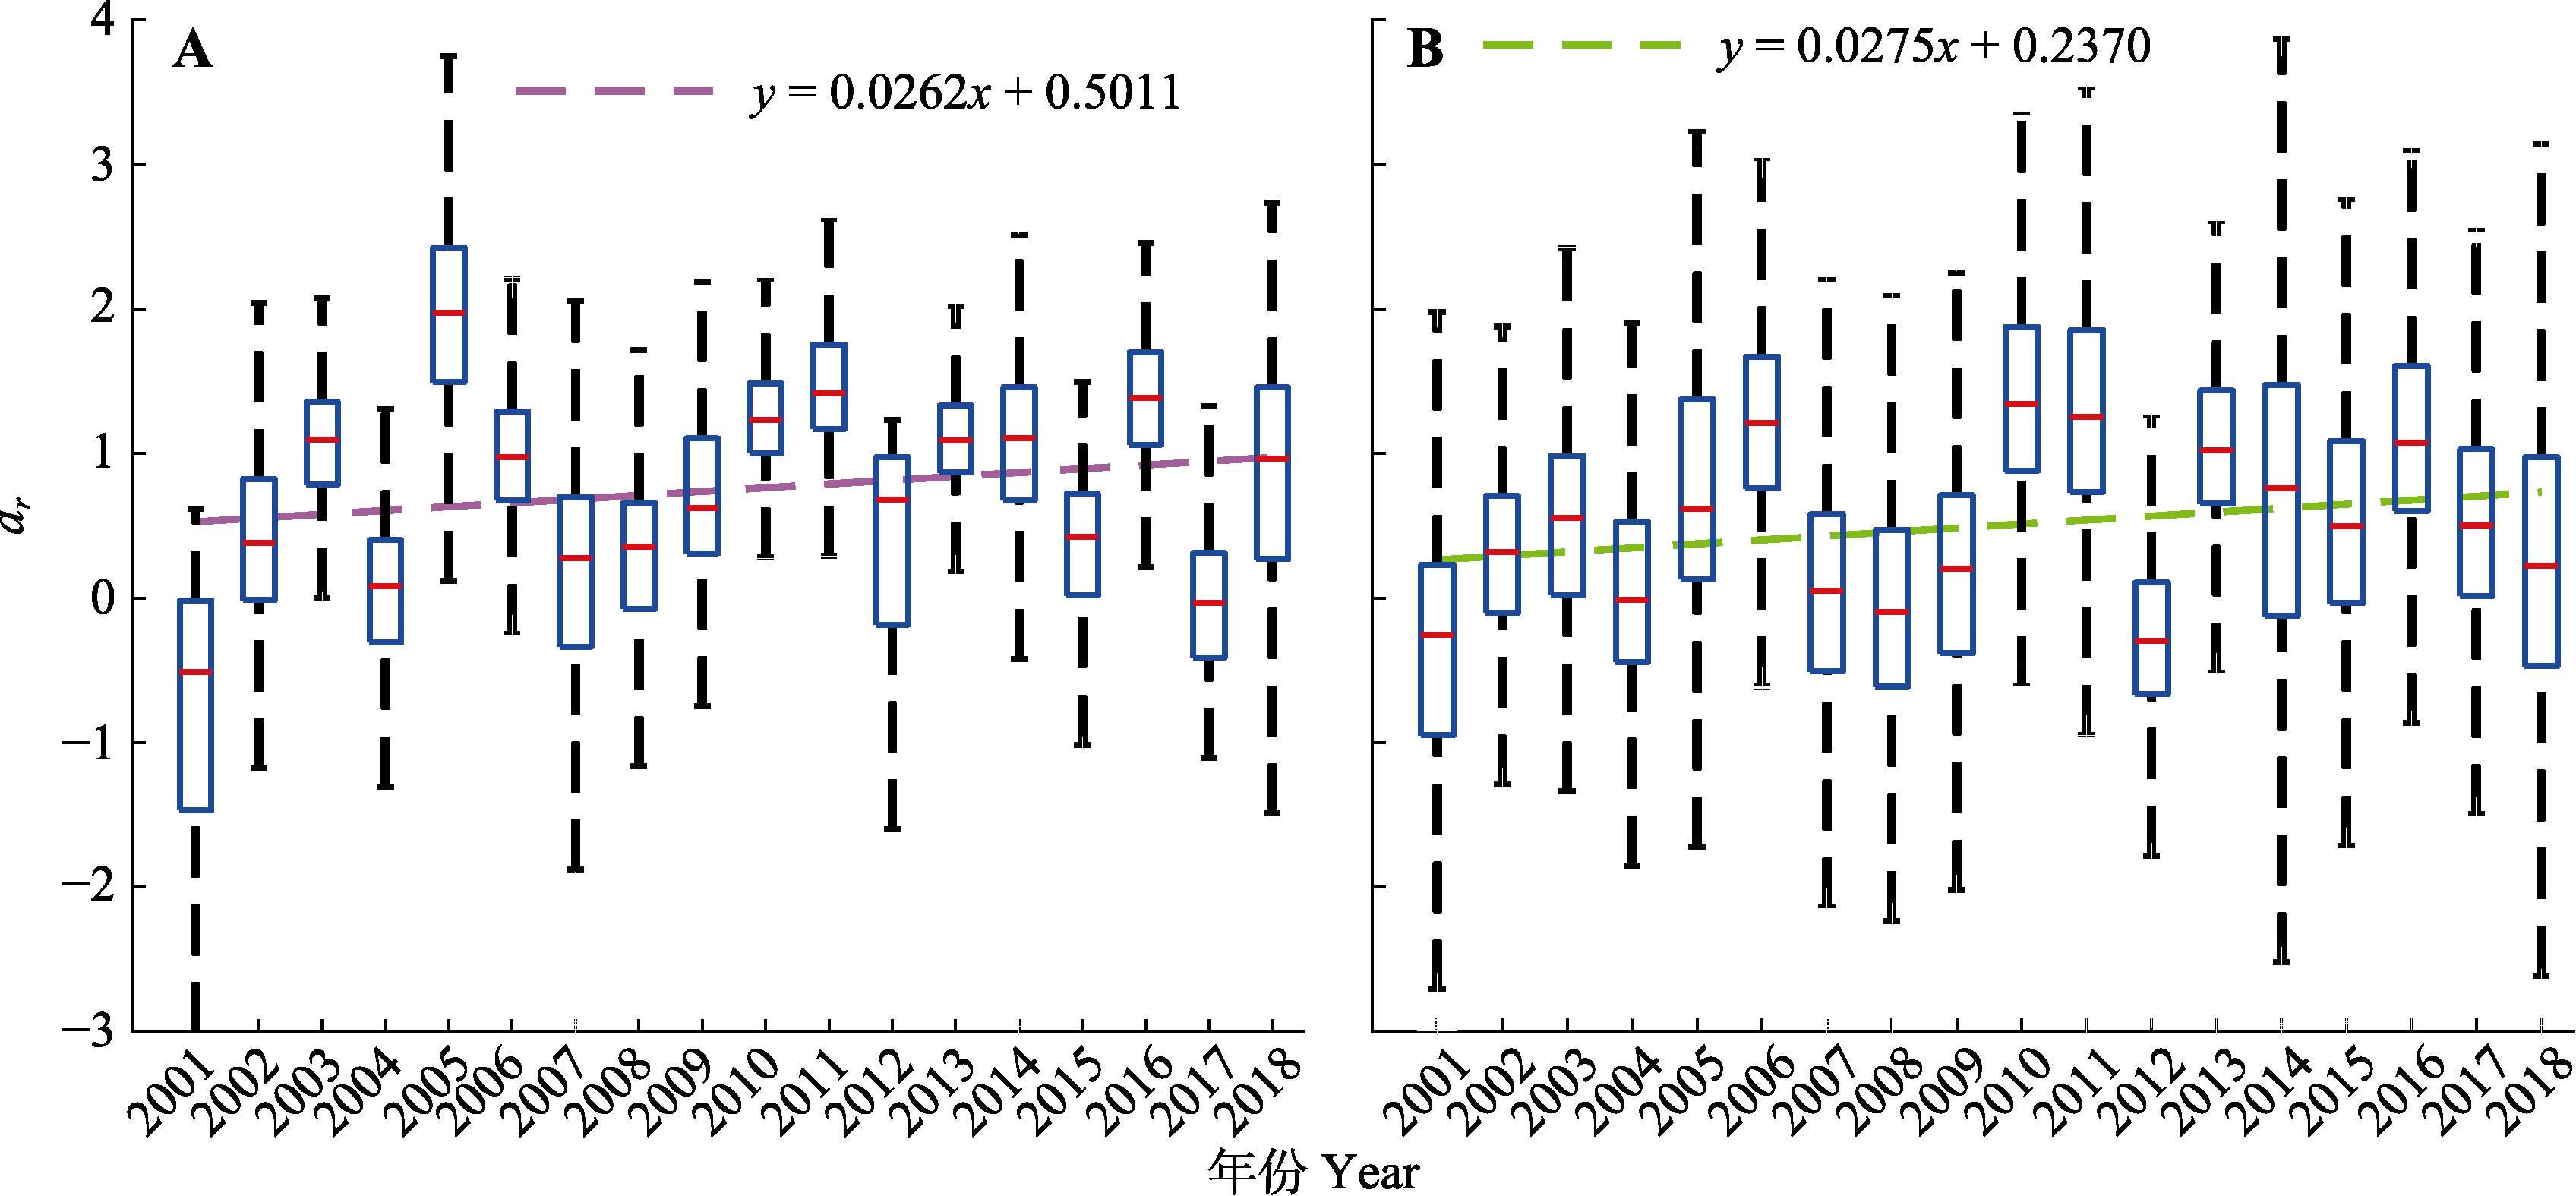
图14 2001-2018年海河流域森林类(A)和灌草类(B)植被弹性幅度(ar)分布图。
Fig. 14 Distribution of forest (A) and shrub/grass (B) vegetation resilience amplitude (ar) in the Hai River Basin, 2001-2018.
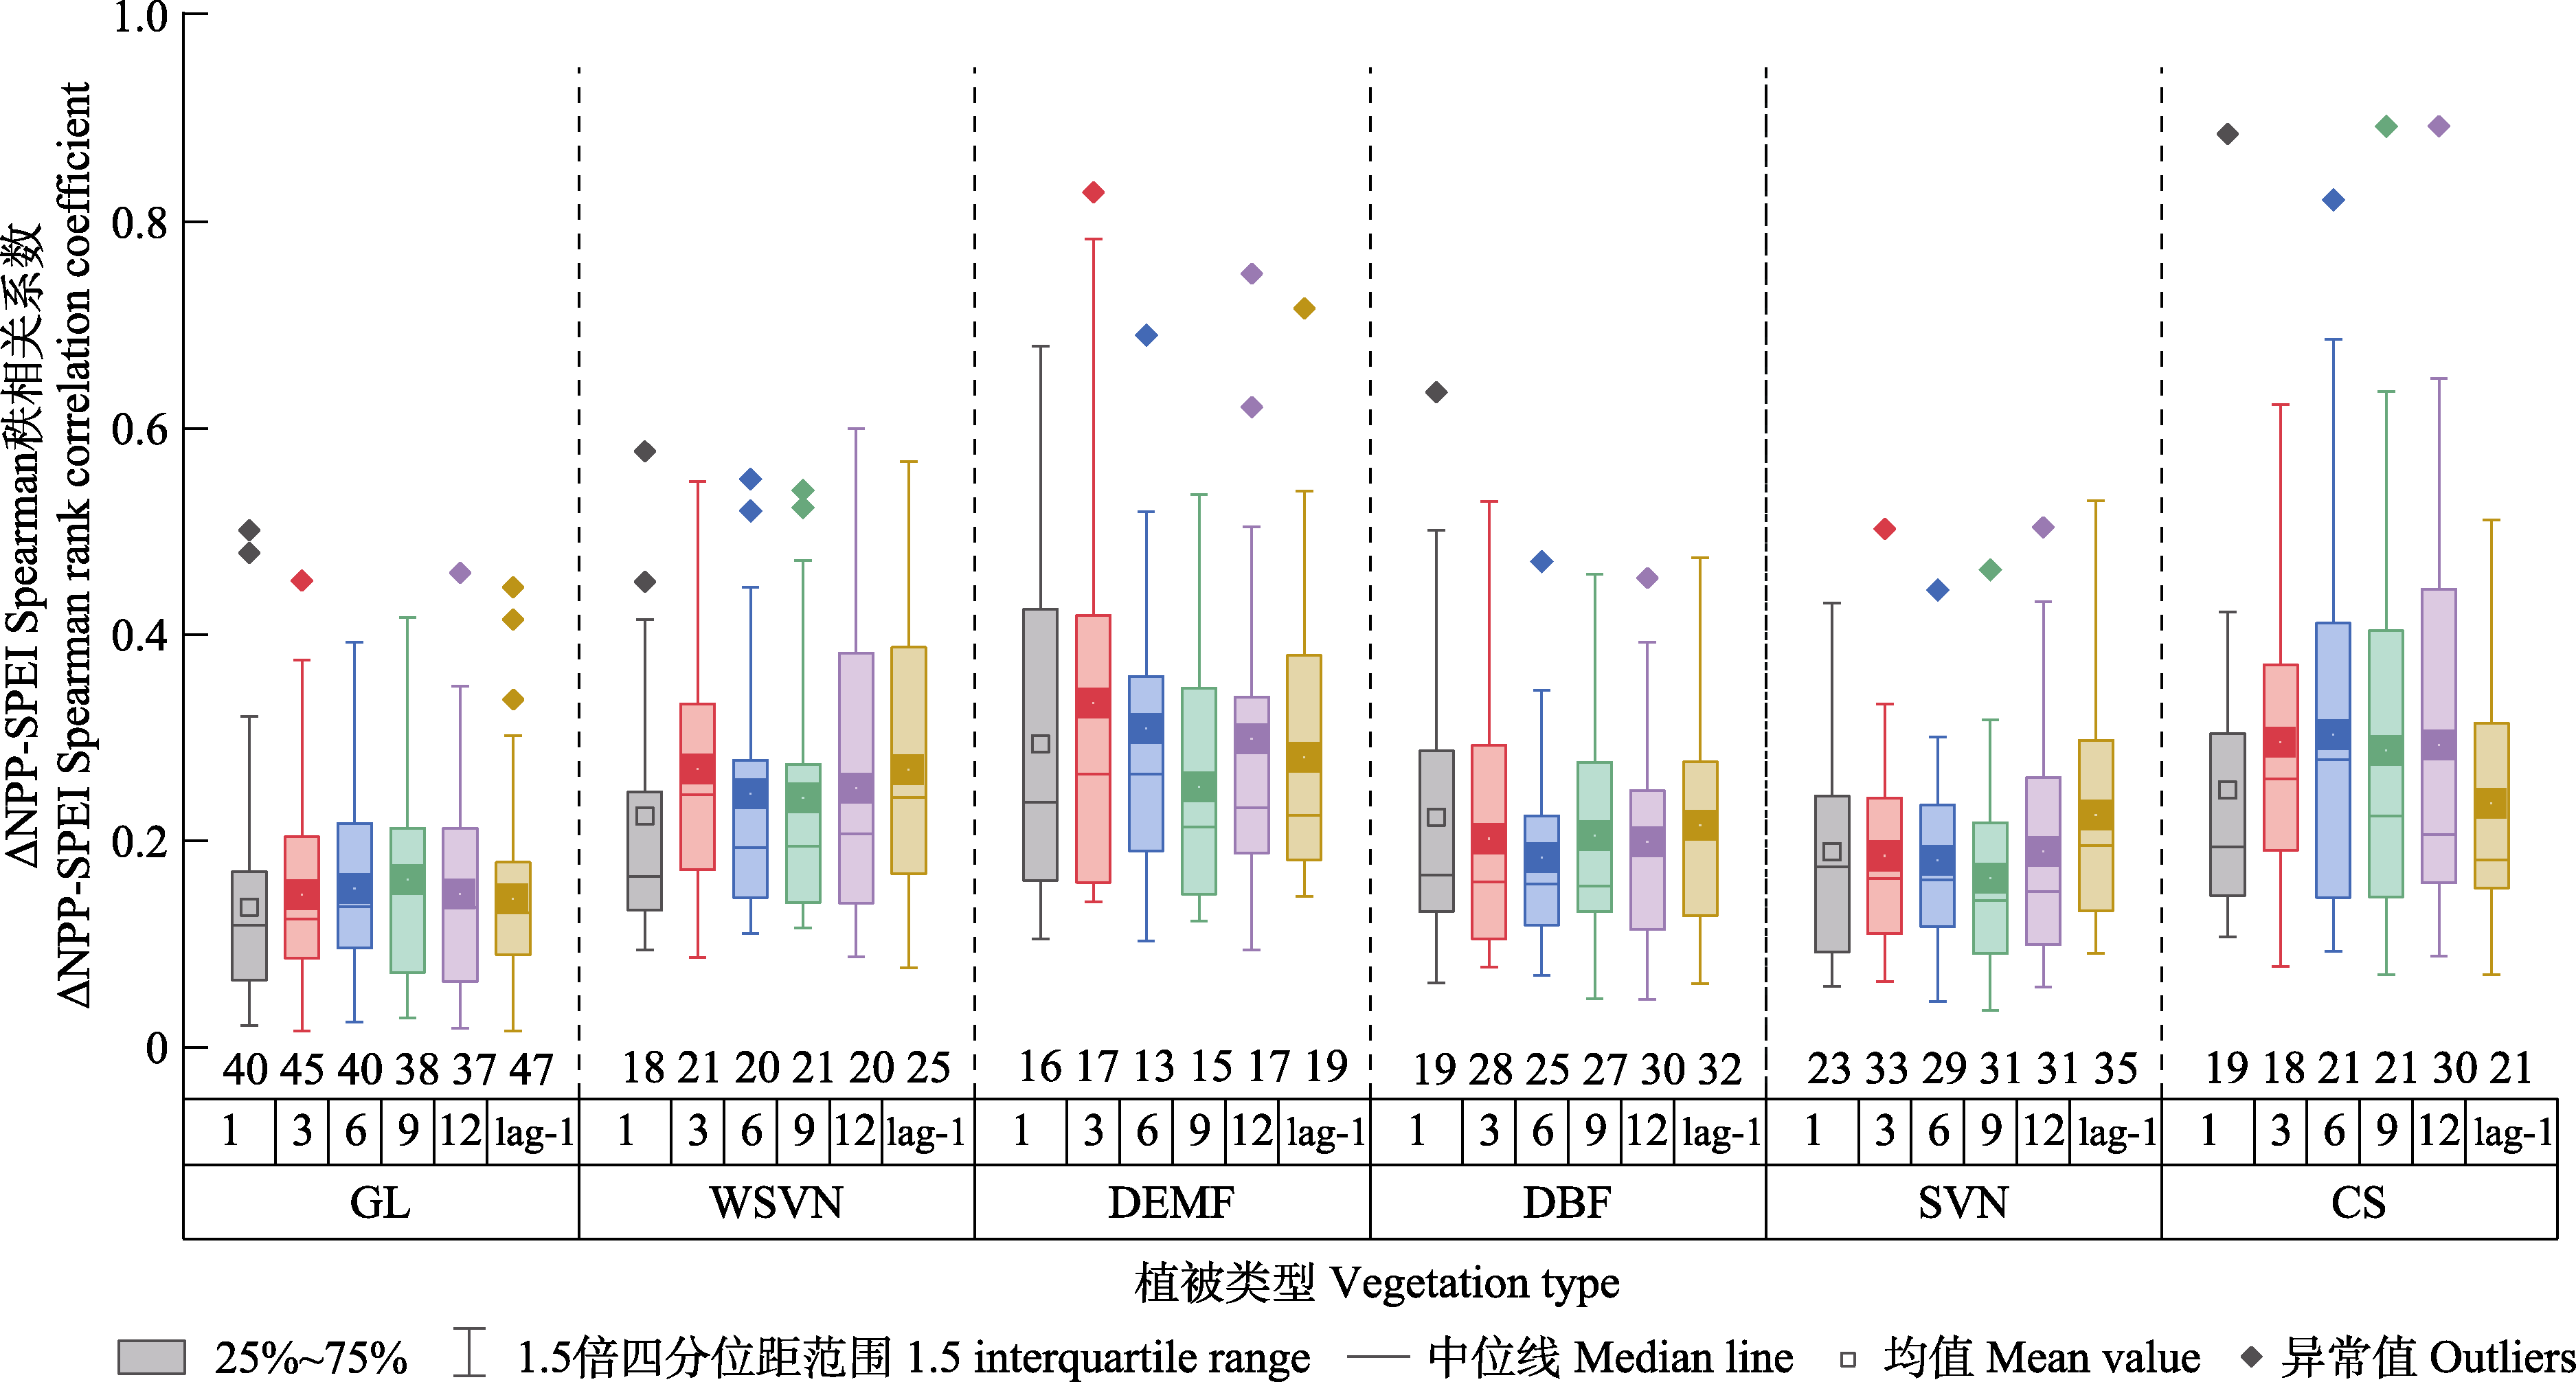
图15 海河流域净初级生产力变幅(ΔNPP)-标准化降水蒸散指数(SPEI)呈显著正相关关系的样本分布。CS, 郁闭灌丛; DBF, 落叶阔叶林; DEMF, 落叶-常绿混交林; GL, 草原; SVN, 稀树草原; WSVN, 多树草原。x轴1, 3, 6, 9, 12, lag-1为SPEI时间尺度, 其上方数字为对应时间尺度SPEI与ΔNPP呈显著正相关关系的月份数。
Fig. 15 Distribution of samples presenting significant positive correlation between net primary productivity changes (∆NPP) and standardized precipitation evapotranspiration index (SPEI) in the Hai River Basin. CS, closed shrubland; DBF, deciduous broadleaf forest; DEMF, deciduous-evergreen mixed forest; GL, grassland; SVN, savanna; WSVN, woody savanna. 1, 3, 6, 9, 12 and lag-1 under x axis are SPEI time scales, and the numbers above are the number of months in which the corresponding time scale SPEI is significantly positively correlated with ∆NPP.
| [1] | Allen CD, Macalady AK, Chenchouni H, Bachelet D, McDowell N, Vennetier M, Kitzberger T, Rigling A, Breshears DD, Hogg EH, Gonzalez P, Fensham R, Zhang Z, Castro J, Demidova N, et al. (2010). A global overview of drought and heat-induced tree mortality reveals emerging climate change risks for forests. Forest Ecology and Management, 259, 660-684. |
| [2] | Anderegg WRL, Konings AG, Trugman AT, Yu K, Bowling DR, Gabbitas R, Karp DS, Pacala S, Sperry JS, Sulman BN, Zenes N (2018). Hydraulic diversity of forests regulates ecosystem resilience during drought. Nature, 561, 538-541. |
| [3] | Anderegg WRL, Trugman AT, Badgley G, Konings AG, Shaw J (2020). Divergent forest sensitivity to repeated extreme droughts. Nature Climate Change, 10, 1091-1095. |
| [4] | Ayantobo OO, Li Y, Song S, Yao N (2017). Spatial comparability of drought characteristics and related return periods in mainland China over 1961-2013. Journal of Hydrology, 550, 549-567. |
| [5] | Constenla-Villoslada S, Liu Y, Wen J, Sun Y, Chonabayashi S (2022). Large-scale land restoration improved drought resilience in Ethiopiaʼs degraded watersheds. Nature Sustainability, 5, 488-497. |
| [6] | Crausbay SD, Ramirez AR, Carter SL, Cross MS, Hall KR, Bathke DJ, Betancourt JL, Colt S, Cravens AE, Dalton MS, Dunham JB, Hay LE, Hayes MJ, McEvoy J, McNutt CA, et al. (2017). Defining ecological drought for the twenty-first century. Bulletin of the American Meteorological Society, 98, 2543-2550. |
| [7] | Deng SS, Liu SX, Mo XG (2021a). Assessment and attribution of China’s droughts using an integrated drought index derived from GRACE and GRACE-FO data. Journal of Hydrology, 603, 127170. DOI: 10.1016/j.jhydrol.2021.127170. |
| [8] | Deng Y, Wang X, Wang K, Ciais P, Tang S, Jin L, Li L, Piao S (2021b). Responses of vegetation greenness and carbon cycle to extreme droughts in China. Agricultural and Forest Meteorology, 298-299, 108307. DOI: 10.1016/j.agrformet.2020.108307. |
| [9] | Doughty CE, Metcalfe DB, Girardin CAJ, Amezquita FF, Cabrera DG, Huasco WH, Silva-Espejo JE, Araujo-Murakami A, da Costa MC, Rocha W, Feldpausch TR, Mendoza ALM, da Costa ACL, Meir P, Phillips OL, Malhi Y (2015). Drought impact on forest carbon dynamics and fluxes in Amazonia. Nature, 519, 78-82. |
| [10] |
Field CB, Behrenfeld MJ, Randerson JT, Falkowski P (1998). Primary production of the biosphere: integrating terrestrial and oceanic components. Science, 281, 237-240.
DOI PMID |
| [11] | Field CB, Randerson JT, Malmström CM (1995). Global net primary production: combining ecology and remote sensing. Remote Sensing of Environment, 51, 74-88. |
| [12] | Gampe D, Zscheischler J, Reichstein M, OʼSullivan M, Smith WK, Sitch S, Buermann W (2021). Increasing impact of warm droughts on northern ecosystem productivity over recent decades. Nature Climate Change, 11, 772-779. |
| [13] | Gao Q, Zhao P, Zeng X, Cai X, Shen W (2002). A model of stomatal conductance to quantify the relationship between leaf transpiration, microclimate and soil water stress. Plant, Cell & Environment, 25, 1373-1381. |
| [14] |
He J, Yang K, Tang WJ, Lu H, Qin J, Chen YY, Li X (2020). The first high-resolution meteorological forcing dataset for land process studies over China. Scientific Data, 7, 25. DOI: 10.1038/s41597-020-0369-y.
PMID |
| [15] | Hu S, Mo XG, Lin ZH (2015). Projections of spatial-temporal variation of drought in North China. Arid Land Geography, 38, 239-248. |
| [ 胡实, 莫兴国, 林忠辉 (2015). 未来气候情景下我国北方地区干旱时空变化趋势. 干旱区地理, 38, 239-248.] | |
| [16] | IPCC (Intergovernmental Panel on Climate Change) (2007). Climate change 2007:impacts, adaptation and vulnerability// Working Group II Contribution to the IPCC Fourth Assessment Report of the IPCC. Cambridge University Press, Cambridge. |
| [17] | IPCC (Intergovernmental Panel on Climate Change) (2014). Climate change 2014: impacts, adaptation, and vulnerability: part B:regional aspects// Working Group II Contribution to the IPCC Fifth Assessment Report of the IPCC. Cambridge University Press, Cambridge. |
| [18] | IPCC (Intergovernmental Panel on Climate Change) (2021). Climate change 2021:the physical science basis// Working Group II Contribution to the IPCC Sixth Assessment Report of the IPCC. Cambridge University Press, Cambridge. |
| [19] | Jayanthi H, Husak GJ, Funk C, Magadzire T, Chavula A, Verdin JP (2013). Modeling rain-fed maize vulnerability to droughts using the standardized precipitation index from satellite estimated rainfall—Southern Malawi case study. International Journal of Disaster Risk Reduction, 4, 71-81. |
| [20] | Jiang B, Ouyang ZY, Miao H, Zheng H, Bai Y, Zhuang CW, Fang Y (2011). Ecosystem services valuation of the Haihe River Basin wetlands. Acta Ecologica Sinica, 31, 2236-2244. |
| [ 江波, 欧阳志云, 苗鸿, 郑华, 白杨, 庄长伟, 方瑜 (2011). 海河流域湿地生态系统服务功能价值评价. 生态学报, 31, 2236-2244.] | |
| [21] | Jiang DB, Wang XX (2021). A brief interpretation of drought change from IPCC Sixth Assessment Report. Transactions of Atmospheric Sciences, 44, 650-653. |
| [ 姜大膀, 王晓欣 (2021). 对IPCC第六次评估报告中有关干旱变化的解读. 大气科学学报, 44, 650-653.] | |
| [22] |
Jump AS, Ruiz-Benito P, Greenwood S, Allen CD, Kitzberger T, Fensham R, Martínez-Vilalta J, Lloret F (2017). Structural overshoot of tree growth with climate variability and the global spectrum of drought-induced forest dieback. Global Change Biology, 23, 3742-3757.
DOI PMID |
| [23] | Keyantash J, Dracup JA (2002). The quantification of drought: an evaluation of drought indices. Bulletin of the American Meteorological Society, 83, 1167-1180. |
| [24] | Khoury S, Coomes DA (2020). Resilience of Spanish forests to recent droughts and climate change. Global Change Biology, 26, 7079-7098. |
| [25] | Li KW, Tong ZJ, Liu XP, Zhang JQ, Tong SQ (2020a). Quantitative assessment and driving force analysis of vegetation drought risk to climate change: methodology and application in Northeast China. Agricultural and Forest Meteorology, 282-283, 107865. DOI: 10.1016/j.agrformet.2019.107865. |
| [26] | Li X, Piao S, Wang K, Wang X, Wang T, Ciais P, Chen AP, Lian X, Peng S, Peñuelas J (2020b). Temporal trade-off between gymnosperm resistance and resilience increases forest sensitivity to extreme drought. Nature Ecology & Evolution, 4, 1075-1083. |
| [27] | Liu D, Wang T, Peñuelas J, Piao S (2022). Drought resistance enhanced by tree species diversity in global forests. Nature Geoscience, 15, 800-804. |
| [28] | Los SO, Justice CO, Tucker CJ (1994). A global 1° by 1° NDVI data set for climate studies derived from the GIMMS continental NDVI data. International Journal of Remote Sensing, 15, 3493-3518. |
| [29] | Lv Y, He HL, Ren XL, Zhang L, Qin KY, Wu XJ, Niu ZE, Feng LL, Xu Q, Zhang MY (2022). High resistance of deciduous forests and high recovery rate of evergreen forests under moderate droughts in China. Ecological Indicators, 144, 109469. DOI: 10.1016/j.ecolind.2022.109469. |
| [30] | Mishra AK, Singh VP (2010). A review of drought concepts. Journal of Hydrology, 391, 202-216. |
| [31] | Mo XG, Lin ZH, Liu SX (2000). An improvement of the dual-source model based on Penman-Monteith formula. Journal of Hydraulic Engineering, 31(5), 6-11. |
| [ 莫兴国, 林忠辉, 刘苏峡 (2000). 基于Penman-Monteith公式的双源模型的改进. 水利学报, 31(5), 6-11.] | |
| [32] |
Mo XG, Liu SX, Hu S (2022). Co-evolution of climate-vegetation-hydrology and its mechanisms in the source region of Yellow River. Acta Geographica Sinica, 77, 1730-1744.
DOI |
|
[ 莫兴国, 刘苏峡, 胡实 (2022). 黄河源区气候-植被-水文协同演变及成因辨析. 地理学报, 77, 1730-1744.]
DOI |
|
| [33] | Mo XG, Liu SX, Lin ZH, Zhao WM (2004). Simulating temporal and spatial variation of evapotranspiration over the Lushi basin. Journal of Hydrology, 285, 125-142. |
| [34] |
Mo XG, Xue L, Lin ZH (2005). Spatio-temporal distribution of crop evapotranspiration from 1981-2001 over the North China Plain. Journal of Natural Resources, 20, 181-187.
DOI |
| [ 莫兴国, 薛玲, 林忠辉 (2005). 华北平原1981-2001年作物蒸散量的时空分异特征. 自然资源学报, 20, 181-187.] | |
| [35] | Potter C, Randerson J, Field C, Matson P, Vitousek P, Mooney H, Klooster S (1993). Terrestrial ecosystem production: a process model based on global satellite and surface data. Global Biogeochemical Cycles, 7, 811-841. |
| [36] | Ruimy A, Saugier B, Dedieu G (1994). Methodology for the estimation of terrestrial net primary production from remotely sensed data. Journal of Geophysical Research: Atmospheres, 99, 5263-5283. |
| [37] | Sharma A, Goyal MK (2018). Assessment of ecosystem resilience to hydroclimatic disturbances in India. Global Change Biology, 24, e432-e441. |
| [38] | Singh VP, Guo H, Yu FX (1993). Parameter estimation for 3-parameter log-logistic distribution (LLD3) by Pome. Stochastic Hydrology and Hydraulics, 7, 163-177. |
| [39] | Smith T, Traxl D, Boers N (2022). Empirical evidence for recent global shifts in vegetation resilience. Nature Climate Change, 12, 477-484. |
| [40] | Song LS, Li Y, Ren YH, Wu XC, Guo B, Tang XG, Shi WY, Ma MG, Han XJ, Zhao L (2019). Divergent vegetation responses to extreme spring and summer droughts in Southwestern China. Agricultural and Forest Meteorology, 279, 107703. DOI: 10.1016/j.agrformet.2019.107703. |
| [41] | Towfiqul Islam ARM, Shen S, Hu Z, Atiqu Rahman M (2017). Drought hazard evaluation in boro paddy cultivated areas of western Bangladesh at current and future climate change conditions. Advances in Meteorology, 2017, 3514381. DOI: 10.1155/2017/3514381. |
| [42] | Vicente-Serrano SM, Beguería S, López-Moreno JI (2010). A multiscalar drought index sensitive to global warming: the standardized precipitation evapotranspiration index. Journal of Climate, 23, 1696-1718. |
| [43] | Wang Y, Zhang CS, Liu CL, Zhen L (2019). Research on the pattern and change of forest water conservation in Three-North Shelterbelt Forest Program region, China. Acta Ecologica Sinica, 39, 5847-5856. |
| [ 王耀, 张昌顺, 刘春兰, 甄霖 (2019). 三北防护林体系建设工程区森林水源涵养格局变化研究. 生态学报, 39, 5847-5856.] | |
| [44] | Wang YF, Mo XG, Hao YB, Guo RP, Huang XZ, Wang YF (2008). Simulating seasonal and interannual variations of ecosystem evapotranspiration and its components in Inner Mongolia steppe with VIP model. Journal of Plant Ecology (Chinese Version), 32, 1052-1060. |
|
[ 王永芬, 莫兴国, 郝彦宾, 郭瑞萍, 黄祥忠, 王艳芬 (2008). 基于VIP模型对内蒙古草原蒸散季节和年际变化的模拟. 植物生态学报, 32, 1052-1060.]
DOI |
|
| [45] | Wang YL, Ding Y, Hu Y, Chen J, Fan WW (2019). The study of shrubland drought dynamics in China and its impacts on vegetation growth. Acta Ecologica Sinica, 39, 2054-2062. |
| [ 王亚林, 丁忆, 胡艳, 陈静, 范文武 (2019). 中国灌木生态系统的干旱化趋势及其对植被生长的影响. 生态学报, 39, 2054-2062.] | |
| [46] | Wang ZL, Li J, Lai CG, Zeng ZY, Zhong RD, Chen XH, Zhou XW, Wang MY (2017). Does drought in China show a significant decreasing trend from 1961 to 2009? Science of the Total Environment, 579, 314-324. |
| [47] | Wu Y, Zeng Y, Zhao Y, Wu BF, Wu WB (2010). Monitoring and dynamic analysis of fractional vegetation cover in the Hai River Basin based on MODIS data. Resources Science, 32, 1417-1424. |
| [ 吴云, 曾源, 赵炎, 吴炳方, 武文波 (2010). 基于MODIS数据的海河流域植被覆盖度估算及动态变化分析. 资源科学, 32, 1417-1424.] | |
| [48] | Xie SD, Mo XG, Hu S, Liu SX (2020). Contributions of climate change, elevated atmospheric CO2 and human activities to ET and GPP trends in the Three-North Region of China. Agricultural and Forest Meteorology, 295, 108183. DOI: 10.1016/j.agrformet.2020.108183. |
| [49] | Xu HJ, Wang XP, Zhao CY, Yang XM (2018). Diverse responses of vegetation growth to meteorological drought across climate zones and land biomes in northern China from 1981 to 2014. Agricultural and Forest Meteorology, 262, 1-13. |
| [50] | Yan DH, Wu D, Huang R, Wang LN, Yang GY (2013). Drought evolution characteristics and precipitation intensity changes during alternating dry-wet changes in the Huang-Huai-Hai River basin. Hydrology and Earth System Sciences, 17, 2859-2871. |
| [51] | Yao TT, Liu SX, Hu S, Mo XG (2022). Response of vegetation ecosystems to flash drought with solar-induced chlorophyll fluorescence over the Hai River Basin, China during 2001-2019. Journal of Environmental Management, 313, 114947. DOI: 10.1016/j.jenvman.2022.114947. |
| [52] | Zhang L, Chu QQ, Jiang YL, Chen F, Lei YD (2021a). Impacts of climate change on drought risk of winter wheat in the North China Plain. Journal of Integrative Agriculture, 20, 2601-2612. |
| [53] | Zhang Q, Zhang JQ, Wang CY (2017). Risk assessment of drought disaster in typical area of corn cultivation in China. Theoretical and Applied Climatology, 128, 533-540. |
| [54] | Zhang Y, Keenan TF, Zhou S (2021b). Exacerbated drought impacts on global ecosystems due to structural overshoot. Nature Ecology & Evolution, 5, 1490-1498. |
| [55] | Zhang YC, Jiang HB, Zhang CW, Shen YJ (2020). Daily fluxes dataset of the typical irrigated agro-ecosystem in the North China Plain: a case study of Luancheng Station (2007-2013). China Scientific Data, 5(2), 36-46. |
| [ 张玉翠, 姜寒冰, 张传伟, 沈彦俊 (2020). 2007-2013年华北平原典型灌溉农田生态系统日通量数据集——以栾城站为例. 中国科学数据, 5(2), 36-46.] | |
| [56] | Zhao AZ, Zhang AB, Cao S, Liu XF, Liu JH, Cheng DY (2018). Responses of vegetation productivity to multi-scale drought in Loess Plateau, China. Catena, 163, 165-171. |
| [57] | Zhu WQ, Pan YZ, Zhang JS (2007). Estimation of net primary productivity of Chinese terrestrial vegetation based on remote sensing. Journal of Plant Ecology (Chinese Version), 31, 413-424. |
|
[ 朱文泉, 潘耀忠, 张锦水 (2007). 中国陆地植被净初级生产力遥感估算. 植物生态学报, 31, 413-424.]
DOI |
| [1] | 张义, 程杰, 苏纪帅, 程积民. 长期封育演替下典型草原植物群落生产力与多样性关系[J]. 植物生态学报, 2022, 46(2): 176-187. |
| [2] | 臧永新, 马剑英, 周晓兵, 陶冶, 尹本丰, 沙亚古丽•及格尔, 张元明. 极端干旱和降水对沙垄不同坡向坡位短命植物地上生产力的影响[J]. 植物生态学报, 2022, 46(12): 1537-1550. |
| [3] | 汲玉河, 周广胜, 王树东, 王丽霞, 周梦子. 2000-2019年秦岭地区植被生态质量演变特征及 驱动力分析[J]. 植物生态学报, 2021, 45(6): 617-625. |
| [4] | 方欧娅, 张永, 张启, 贾恒锋. 黄河上游甘蒙柽柳生长对极端旱涝的响应[J]. 植物生态学报, 2021, 45(6): 641-649. |
| [5] | 王奕丹, 李亮, 刘琪璟, 马泽清. 亚热带6个典型树种吸收细根寿命与形态属性格局[J]. 植物生态学报, 2021, 45(4): 383-393. |
| [6] | 嘎玛达尔基, 杨泽, 谭星儒, 王珊珊, 李伟晶, 游翠海, 王彦兵, 张兵伟, 任婷婷, 陈世苹. 凋落物输入变化和氮添加对半干旱草原群落生产力及功能群组成的影响[J]. 植物生态学报, 2020, 44(8): 791-806. |
| [7] | 舒树淼, 朱万泽, 冉飞, 孙守琴, 张元媛. 贡嘎山峨眉冷杉成熟林碳利用效率季节动态及其影响因子[J]. 植物生态学报, 2020, 44(11): 1127-1137. |
| [8] | 王玉冰,孙毅寒,丁威,张恩涛,李文怀,迟永刚,郑淑霞. 长期氮添加对典型草原植物多样性与初级生产力的影响及途径[J]. 植物生态学报, 2020, 44(1): 22-32. |
| [9] | 李建军, 刘恋, 陈迪马, 许丰伟, 程军回, 白永飞. 底座入土深度和面积对典型草原土壤呼吸测定结果的影响[J]. 植物生态学报, 2019, 43(2): 152-164. |
| [10] | 吴红宝, 高清竹, 干珠扎布, 李钰, 闫玉龙, 胡国铮, 王学霞, 严俊, 何世丞. 放牧和模拟增温对藏北高寒草地植物群落特征及生产力的影响[J]. 植物生态学报, 2019, 43(10): 853-862. |
| [11] | 李旭华, 孙建新. Biome-BGC模型模拟阔叶红松林碳水通量的参数敏感性检验和不确定性分析[J]. 植物生态学报, 2018, 42(12): 1131-1144. |
| [12] | 王亚林, 龚容, 吴凤敏, 范文武. 2001-2013年中国灌木生态系统净初级生产力的时空变化特征及其对气候变化的响应[J]. 植物生态学报, 2017, 41(9): 925-937. |
| [13] | 解雅麟, 王海燕, 雷相东. 基于过程模型的气候变化对长白落叶松人工林净初级生产力的影响[J]. 植物生态学报, 2017, 41(8): 826-839. |
| [14] | 李登秋, 张春华, 居为民, 刘丽娟. 江西省森林净初级生产力动态变化特征及其驱动因子分析[J]. 植物生态学报, 2016, 40(7): 643-657. |
| [15] | 潘石玉, 孔彬彬, 姚天华, 卫欣华, 李英年, 朱志红. 刈割和施肥对高寒草甸功能多样性与地上净初级生产力关系的影响[J]. 植物生态学报, 2015, 39(9): 867-877. |
| 阅读次数 | ||||||
|
全文 |
|
|||||
|
摘要 |
|
|||||
Copyright © 2022 版权所有 《植物生态学报》编辑部
地址: 北京香山南辛村20号, 邮编: 100093
Tel.: 010-62836134, 62836138; Fax: 010-82599431; E-mail: apes@ibcas.ac.cn, cjpe@ibcas.ac.cn
备案号: 京ICP备16067583号-19