
植物生态学报 ›› 2008, Vol. 32 ›› Issue (1): 152-160.DOI: 10.3773/j.issn.1005-264x.2008.01.017
宋开山1( ), 张柏1, 王宗明1, 刘殿伟1, 刘焕军1,2
收稿日期:2007-01-05
接受日期:2007-09-24
出版日期:2008-01-05
发布日期:2008-01-30
通讯作者:
宋开山
作者简介:* E-mail: songks@neigae.ac.cn基金资助:
SONG Kai-Shan1(), ZHANG Bai1, WANG Zong-Ming1, LIU Dian-Wei1, LIU Huan-Jun1,2
Received:2007-01-05
Accepted:2007-09-24
Online:2008-01-05
Published:2008-01-30
Contact:
SONG Kai-Shan
摘要:
2003和2004年分别在长春市良种场和中国科学院海伦黑土生态实验站实测了大田耕作与水肥耦合作用下大豆(Glycine max)冠层高光谱反射率与叶绿素a含量数据,对光谱反射率、微分光谱与叶绿素a含量进行了相关分析;采用归一化植被指数(Normalized difference vegetation index, NDVI)、土壤调和植被指数(Soil-adjusted vegetation index, SAVI)、再归一植被指数(Renormalized difference vegetation index, RDVI)、第二修正比值植被指数(Modified second ratio index, MSRI)等建立了大豆叶绿素a反演模型;应用小波分析对采集的光谱反射率数据进行了能量系数提取,并以小波能量系数作为自变量进行了单变量与多变量回归分析,对大豆叶绿素a进行了估算。研究结果表明,大豆叶绿素a与可见光光谱反射率相关性较好,并在红光波段取得最大值(R2>0.70),但在红边处,微分光谱与大豆叶绿素a的相关性较反射率好得多,在其它波段则相反;由NDVI、SAVI、RDVI、MSR等植被指数建立的估算模型可以提高大豆叶绿素a的估算精度(R2>0.75);小波能量系数回归模型可以进一步提高大豆叶绿素a含量的估算水平,以一个特定小波能量系数作为自变量的回归模型,大豆叶绿素a回归决定系数R2高达0.78;多变量回归分析结果表明,大豆叶绿素a实测值与预测值的线性回归决定系数R2均高达0.85。以上结果表明,小波分析可以对高光谱进行特征变量提取,并可在一定程度上提高大豆生理参数反演精度。
宋开山, 张柏, 王宗明, 刘殿伟, 刘焕军. 基于小波分析的大豆叶绿素a含量高光谱反演模型. 植物生态学报, 2008, 32(1): 152-160. DOI: 10.3773/j.issn.1005-264x.2008.01.017
SONG Kai-Shan, ZHANG Bai, WANG Zong-Ming, LIU Dian-Wei, LIU Huan-Jun. SOYBEAN CHLOROPHYLL A CONCENTRATION ESTIMATION MODELS BASED ON WAVELET-TRANSFORMED, IN SITU COLLECTED, CANOPY HYPERSPECTRAL DATA. Chinese Journal of Plant Ecology, 2008, 32(1): 152-160. DOI: 10.3773/j.issn.1005-264x.2008.01.017
| 植被指数 Vegetation index | 植被指数采用的公式及波段 Formula and bands applied | 文献来源 References |
|---|---|---|
| 归一化植被指数 Normalized difference vegetation index (NDVI) | (R801-R670)/(R801+R670) | |
| 土壤调和植被指数 Soil-adjusted vegetation index (SAVI) | (1+L)×(R801-R670)/(R801+R670+L) | |
| 再归一植被指数 Renormalized difference vegetation index (RDVI) | RDVI=(R801-R670)/ | |
| 第二修正比值植被指数 Modified second ratio index (MSR) | MSRI=( |
表1 本研究所采用的植被指数的相关信息
Table 1 Vegetation indices evaluated in the present study
| 植被指数 Vegetation index | 植被指数采用的公式及波段 Formula and bands applied | 文献来源 References |
|---|---|---|
| 归一化植被指数 Normalized difference vegetation index (NDVI) | (R801-R670)/(R801+R670) | |
| 土壤调和植被指数 Soil-adjusted vegetation index (SAVI) | (1+L)×(R801-R670)/(R801+R670+L) | |
| 再归一植被指数 Renormalized difference vegetation index (RDVI) | RDVI=(R801-R670)/ | |
| 第二修正比值植被指数 Modified second ratio index (MSR) | MSRI=( |
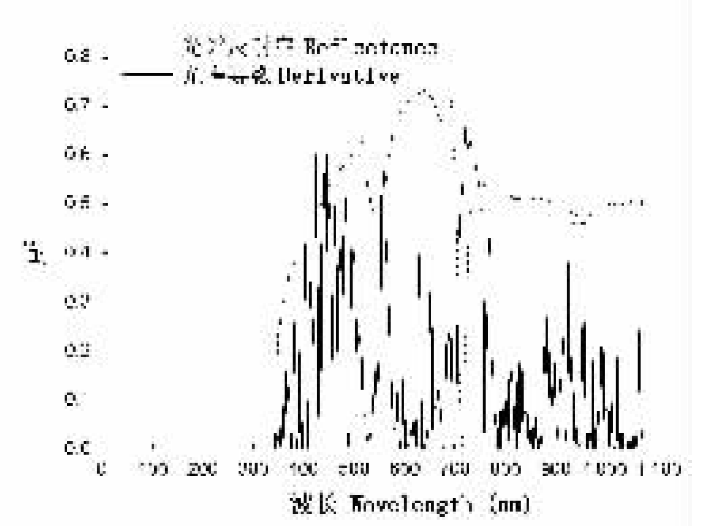
图1 光谱及其导数与叶绿素a逐波段回归的决定系数(R2)变化趋势
Fig.1 Coefficient of determination (R2) derived from a linear regression of reflectance and derivative against chlorophyll a concentration
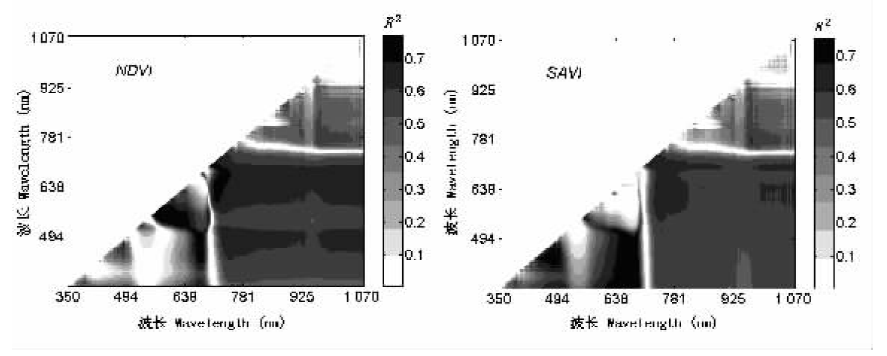
图2 所有NDVI、SAVI波段组合与叶绿素a的回归决定系数的变化趋势 NDVI、SAVI: 见表1
Fig.2 Coefficient of determination for all combinations of wavelength used for linear regression analysis of NDVI and SAVI against chlorophyll a concentration,respectively NDVI、SAVI: See Table 1
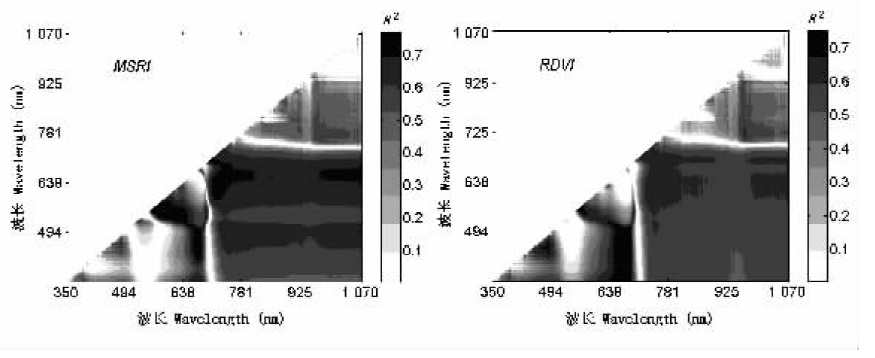
图3 所有MSRI、RDVI波段组合与叶绿素a的回归决定系数的变化趋势 MSRI、RDVI: 见表1
Fig.3 Coefficient of determination for all combinations of wavelength used for linear regression analysis of MSRI and RDVI against chlorophyll a concentration,respectively MSRI、RDVI: See Table 1
| 植被指数 Vegetation indices | 线性估算模型 Linear regression model (n=100) | 模型验证 Model validation (n=44) | ||||||
|---|---|---|---|---|---|---|---|---|
| 回归公式 Regression formula | R2 | RMSE (mg·g-1) | R2 | RMSE (mg·g-1) | ||||
| NDVI (441,223) | y=5.317x-3.223 | 0.782 | 0.168 | 0.754 | 0.173 | |||
| SAVI (502,32) | y=-20.621x+1.644 | 0.762 | 0.171 | 0.734 | 0.181 | |||
| RDVI (488,28) | y=-17.073 0x+1.757 8 | 0.759 | 0.172 | 0.722 | 0.189 | |||
| MSRI (257,128) | y=10.358 0x-9.512 9 | 0.769 | 0.170 | 0.731 | 0.182 | |||
| 植被指数 Vegetation indices | 非线性估算模型 Non-linear regression model (n=100) | 模型验证 Model validation (n=44) | ||||||
| 回归公式 Regression formula | R2 | RMSE (mg·g-1) | R2 | RMSE (mg·g-1) | ||||
| NDVI (441,223) | y=0.019e4.722x | 0.793 | 0.164 | 0.726 | 0.186 | |||
| SAVI (502,32) | y=2.077e-18.03x | 0.798 | 0.162 | 0.732 | 0.182 | |||
| RDVI (488,28) | y=1.851e-14.91x | 0.778 | 0.171 | 0.717 | 0.193 | |||
| MSRI (257,128) | y=0.880x5.81 | 0.805 | 0.158 | 0.747 | 0.176 | |||
表2 各种植被指数的最佳波段组合与叶绿素a的线性与非线性回归结果
Table 2 Linear and non-linear regression models based on optimum spectral vegetation indices against chlorophyll a concentration
| 植被指数 Vegetation indices | 线性估算模型 Linear regression model (n=100) | 模型验证 Model validation (n=44) | ||||||
|---|---|---|---|---|---|---|---|---|
| 回归公式 Regression formula | R2 | RMSE (mg·g-1) | R2 | RMSE (mg·g-1) | ||||
| NDVI (441,223) | y=5.317x-3.223 | 0.782 | 0.168 | 0.754 | 0.173 | |||
| SAVI (502,32) | y=-20.621x+1.644 | 0.762 | 0.171 | 0.734 | 0.181 | |||
| RDVI (488,28) | y=-17.073 0x+1.757 8 | 0.759 | 0.172 | 0.722 | 0.189 | |||
| MSRI (257,128) | y=10.358 0x-9.512 9 | 0.769 | 0.170 | 0.731 | 0.182 | |||
| 植被指数 Vegetation indices | 非线性估算模型 Non-linear regression model (n=100) | 模型验证 Model validation (n=44) | ||||||
| 回归公式 Regression formula | R2 | RMSE (mg·g-1) | R2 | RMSE (mg·g-1) | ||||
| NDVI (441,223) | y=0.019e4.722x | 0.793 | 0.164 | 0.726 | 0.186 | |||
| SAVI (502,32) | y=2.077e-18.03x | 0.798 | 0.162 | 0.732 | 0.182 | |||
| RDVI (488,28) | y=1.851e-14.91x | 0.778 | 0.171 | 0.717 | 0.193 | |||
| MSRI (257,128) | y=0.880x5.81 | 0.805 | 0.158 | 0.747 | 0.176 | |||
| 小波能量系数 Wavelet energy coefficient | 估算模型 Regression model (n=100) | 模型验证 Model validation (n=44) | ||||||
|---|---|---|---|---|---|---|---|---|
| 回归公式 Regression formula | R2 | RMSE (mg·g-1) | R2 | RMSE (mg·g-1) | ||||
| 第一系数 First coef. | y=0.378 2x-0.058 0 | 0.656 | 0.203 | 0.648 | 0.211 | |||
| 第二系数 Second coef. | y=1.191 2x+0.455 0 | 0.674 | 0.192 | 0.653 | 0.203 | |||
| 第三系数 Third coef. | y=2.871 3x+0.251 9 | 0.76 | 0.170 | 0.755 | 0.173 | |||
| 第四系数 Fourth coef. | y=4.915 6x+0.203 0 | 0.708 | 0.188 | 0.699 | 0.191 | |||
| 第五系数 Fifth coef. | y=23.110 0x-0.302 8 | 0.491 | 0.248 | 0.479 | 0.257 | |||
| 第六系数Sixth coef. | y=80.002 0x+0.107 5 | 0.784 | 0.162 | 0.778 | 0.167 | |||
| 第七系数 Seventh coef. | y=333.510 0x+0.055 7 | 0.658 | 0.203 | 0.649 | 0.208 | |||
| 第八系数Eighth coef. | y=544.510 0x+0.621 7 | 0.230 | 0.305 | 0.210 | 0.312 | |||
| 第九系数 Ninth coef. | y=483.310 0x+0.993 0 | 0.029 | 0.343 | 0.007 | 0.348 | |||
表3 各级小波能量系数与叶绿素a的回归模型及验证
Table 3 Regression models based on different levels of wavelet energy coefficients of soybean spectra and their validation
| 小波能量系数 Wavelet energy coefficient | 估算模型 Regression model (n=100) | 模型验证 Model validation (n=44) | ||||||
|---|---|---|---|---|---|---|---|---|
| 回归公式 Regression formula | R2 | RMSE (mg·g-1) | R2 | RMSE (mg·g-1) | ||||
| 第一系数 First coef. | y=0.378 2x-0.058 0 | 0.656 | 0.203 | 0.648 | 0.211 | |||
| 第二系数 Second coef. | y=1.191 2x+0.455 0 | 0.674 | 0.192 | 0.653 | 0.203 | |||
| 第三系数 Third coef. | y=2.871 3x+0.251 9 | 0.76 | 0.170 | 0.755 | 0.173 | |||
| 第四系数 Fourth coef. | y=4.915 6x+0.203 0 | 0.708 | 0.188 | 0.699 | 0.191 | |||
| 第五系数 Fifth coef. | y=23.110 0x-0.302 8 | 0.491 | 0.248 | 0.479 | 0.257 | |||
| 第六系数Sixth coef. | y=80.002 0x+0.107 5 | 0.784 | 0.162 | 0.778 | 0.167 | |||
| 第七系数 Seventh coef. | y=333.510 0x+0.055 7 | 0.658 | 0.203 | 0.649 | 0.208 | |||
| 第八系数Eighth coef. | y=544.510 0x+0.621 7 | 0.230 | 0.305 | 0.210 | 0.312 | |||
| 第九系数 Ninth coef. | y=483.310 0x+0.993 0 | 0.029 | 0.343 | 0.007 | 0.348 | |||
| 小波母函数 Mother wavelet functions | 估算模型 Regression model (n=100) | 模型验证 Model validation (n=44) | ||||||
|---|---|---|---|---|---|---|---|---|
| 回归公式 Regression formula | R2 | RMSE (mg·g-1) | R2 | RMSE (mg·g-1) | ||||
| db2 | y=71.020 0x+0.115 0 | 0.780 | 0.162 | 0.759 | 0.171 | |||
| db4 | y=6.626 4x+0.471 5 | 0.732 | 0.180 | 0.724 | 0.221 | |||
| db6 | y=23.437 0x+0.101 5 | 0.762 | 0.169 | 0.757 | 0.172 | |||
| db8 | y=16.055 0x-0.213 8 | 0.763 | 0.168 | 0.759 | 0.171 | |||
| bior33 | y=5.864 1x+0.282 1 | 0.755 | 0.172 | 0.750 | 0.173 | |||
| bior68 | y=19.846 0x+0.651 2 | 0.749 | 0.174 | 0.743 | 0.176 | |||
| rbio33 | y=52.416 0x+0.079 0 | 0.807 | 0.157 | 0.790 | 0.160 | |||
| ciof5 | y=8.524 6x+0.224 8 | 0.751 | 0.173 | 0.742 | 0.178 | |||
| dmey | y=19.333 0x+0.268 2 | 0.757 | 0.172 | 0.748 | 0.175 | |||
| sym8 | y=18.266 0x+0.609 8 | 0.755 | 0.173 | 0.747 | 0.175 | |||
表4 不同小波函数获得的小波能量系数与叶绿素a的回归模型及验证
Table 4 Regression models based on wavelet energy coefficients from various mother functions and their validation
| 小波母函数 Mother wavelet functions | 估算模型 Regression model (n=100) | 模型验证 Model validation (n=44) | ||||||
|---|---|---|---|---|---|---|---|---|
| 回归公式 Regression formula | R2 | RMSE (mg·g-1) | R2 | RMSE (mg·g-1) | ||||
| db2 | y=71.020 0x+0.115 0 | 0.780 | 0.162 | 0.759 | 0.171 | |||
| db4 | y=6.626 4x+0.471 5 | 0.732 | 0.180 | 0.724 | 0.221 | |||
| db6 | y=23.437 0x+0.101 5 | 0.762 | 0.169 | 0.757 | 0.172 | |||
| db8 | y=16.055 0x-0.213 8 | 0.763 | 0.168 | 0.759 | 0.171 | |||
| bior33 | y=5.864 1x+0.282 1 | 0.755 | 0.172 | 0.750 | 0.173 | |||
| bior68 | y=19.846 0x+0.651 2 | 0.749 | 0.174 | 0.743 | 0.176 | |||
| rbio33 | y=52.416 0x+0.079 0 | 0.807 | 0.157 | 0.790 | 0.160 | |||
| ciof5 | y=8.524 6x+0.224 8 | 0.751 | 0.173 | 0.742 | 0.178 | |||
| dmey | y=19.333 0x+0.268 2 | 0.757 | 0.172 | 0.748 | 0.175 | |||
| sym8 | y=18.266 0x+0.609 8 | 0.755 | 0.173 | 0.747 | 0.175 | |||
| 小波母函数 Mother wavelet functions | 估算模型 Regression model (n=100) | 模型验证 Model validation (n=44) | ||||||
|---|---|---|---|---|---|---|---|---|
| 回归公式 Regression formula | R2 | RMSE (mg·g-1) | R2 | RMSE (mg·g-1) | ||||
| db2 | y=0.292+164.4x6-0.296x1-184.5x7+4.46x5 | 0.831 | 0.142 | 0.825 | 0.145 | |||
| db4 | y=0.692+34.72x6-0.77x1+8.08x3 | 0.803 | 0.152 | 0.810 | 0.150 | |||
| db6 | y=0.459+10.525x5-0.399x1+7.41x3-2.22x2 | 0.814 | 0.148 | 0.807 | 0.151 | |||
| db8 | y=0.342+27.72x4-19.1x5-0.369x1+127.50x8 | 0.817 | 0.147 | 0.819 | 0.146 | |||
| bior33 | y=0.51+10.66x4-0.231x1+76.66x7 | 0.800 | 0.153 | 0.790 | 0.156 | |||
| bior68 | y=0.432+26.72x5-89.19x7+8.89x3-5.64x2 | 0.843 | 0.132 | 0.854 | 0.139 | |||
| rbior33 | y=0.045+103.76x6-173.59x7-3.10x3 | 0.855 | 0.130 | 0.859 | 0.129 | |||
| ciof5 | y=0.377+54.97x4+0.188x1-6.73x2-11.70x3-31.21x6 | 0.828 | 0.142 | 0.822 | 0.144 | |||
| dmey | y=0.499+41.14x4-0.234x1-77.90x7-6.61x2+8.61x3 | 0.818 | 0.146 | 0.810 | 0.150 | |||
| sym8 | y=18.266x5+0.610 | 0.755 | 0.173 | 0.747 | 0.175 | |||
表5 基于小波分析的多元回归方程的决定系数(R2)与剩余残差(RMSE)的变化趋势
Table 5 The trend of determination coefficient (R2) and root mean square error (RMSE) from multivariate regression model based on soybean canopy reflectance wavelet transforms energy and chlorophyll a concentration
| 小波母函数 Mother wavelet functions | 估算模型 Regression model (n=100) | 模型验证 Model validation (n=44) | ||||||
|---|---|---|---|---|---|---|---|---|
| 回归公式 Regression formula | R2 | RMSE (mg·g-1) | R2 | RMSE (mg·g-1) | ||||
| db2 | y=0.292+164.4x6-0.296x1-184.5x7+4.46x5 | 0.831 | 0.142 | 0.825 | 0.145 | |||
| db4 | y=0.692+34.72x6-0.77x1+8.08x3 | 0.803 | 0.152 | 0.810 | 0.150 | |||
| db6 | y=0.459+10.525x5-0.399x1+7.41x3-2.22x2 | 0.814 | 0.148 | 0.807 | 0.151 | |||
| db8 | y=0.342+27.72x4-19.1x5-0.369x1+127.50x8 | 0.817 | 0.147 | 0.819 | 0.146 | |||
| bior33 | y=0.51+10.66x4-0.231x1+76.66x7 | 0.800 | 0.153 | 0.790 | 0.156 | |||
| bior68 | y=0.432+26.72x5-89.19x7+8.89x3-5.64x2 | 0.843 | 0.132 | 0.854 | 0.139 | |||
| rbior33 | y=0.045+103.76x6-173.59x7-3.10x3 | 0.855 | 0.130 | 0.859 | 0.129 | |||
| ciof5 | y=0.377+54.97x4+0.188x1-6.73x2-11.70x3-31.21x6 | 0.828 | 0.142 | 0.822 | 0.144 | |||
| dmey | y=0.499+41.14x4-0.234x1-77.90x7-6.61x2+8.61x3 | 0.818 | 0.146 | 0.810 | 0.150 | |||
| sym8 | y=18.266x5+0.610 | 0.755 | 0.173 | 0.747 | 0.175 | |||
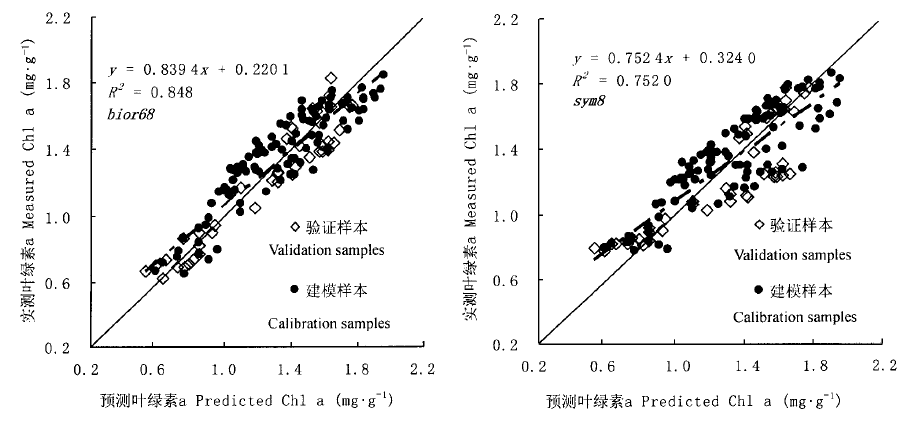
图4 基于小波变换特征量的多元回归模型预测叶绿素a与实测值之间的关系
Fig.4 Relationship between multivariate regression based on wavelet-transformed soybean canopy spectral reflectance predicted chlorophyll a and measured chlorophyll a concentration
| [1] | Adams ML, Norvell WA, Peverly JH, Philpot WD (1993). Fluorescence and reflectance characteristics of Manganese deficient soybean leaves:effects of leaf age and choice of leaflet. Plant and Soil, 155/156, 235-238. |
| [2] | Bannari A, Morin D, Bonn F, Huete AR (1995). A review of vegetation indices. Remote Sensing Review, 13, 95-120. |
| [3] | Blackburn GA (1998). Spectral indices for estimating photosynthetic pigment concentrations:a test using senescent tree leaves. International Journal of Remote Sensing, 19, 657-675. |
| [4] | Bruce LM, Li J (2001). Wavelet for computationally efficient hyperspectral derivative analysis. IEEE Transactions on Geosciences and Remote Sensing, 39, 1540-1546. |
| [5] | Bruce LM, Koger CH, Li J (2002). Dimensionality reduction of hyperspectral data using discrete transform feature extraction. IEEE Transactions on Geosciences and Remote Sensing, 40, 2331-2338. |
| [6] | Chen J, Cihlar J (1996). Retrieving leaf area index of boreal conifer forests using Landsat TM images. Remote Sensing of Environment, 55, 153-162. |
| [7] | Gupta RK, Woolley JT (1971). Spectral properties of soybean leaves. Agronomy Journal, 63, 123-126. |
| [8] | Huang WJ (黄文江), Wang JH (王纪华), Liu LY (刘良云), Zhao CJ (赵春江), Song XY (宋晓宇), Ma ZH (马智宏) (2004). Correlation between grain quality indicators and spectral reflectance properties of wheat canopies by using hyperspectral data from winter wheat. Transactions of the Chinese Society of Agricultural Engineering (农业工程学报), 20, 203-207. (in Chinese with English abstract) |
| [9] | Huete AR (1988). A soil vegetation adjusted index (SAVI). Remote Sensing of Environment, 25, 295-309. |
| [10] | Jacquemoud S, Bacour C, Poilve H, Frangi JP (2000). Comparison of four radiative transfer models to simulate plant canopies reflectance:direct and inverse mode. Remote Sensing of Environment, 74, 417-481. |
| [11] | Lichtenthaler HK (1998). The stress concept in plants:an introduction. Annals of the New York Academy of Sciences, 851, 187-198. |
| [12] | Milton NM, Ager CM, Eiswerth BA, Power MS (1989). Arsenic- and Selenium-induced changes in spectral reflectance and morphology of soybean plants. Remote Sensing of Environment, 30, 263-269. |
| [13] | Myneni RB, Hall FG, Sellers PJ (1995). The interpretation of special vegetation indexes. IEEE Transactions on Geosciences and Remote Sensing, 33, 481-486. |
| [14] | Pu RL, Gong P (2004). Wavelet transform applied to EO-1 hyperspectral data for forest LAI and crown closure mapping. Remote Sensing of Environment, 91, 212-224. |
| [15] | Roujean JL, Breon FM (1995). Estimating PAR absorbed by vegetation from bidirectional reflectance measurements. Remote Sensing of Environment, 51, 375-384. |
| [16] | Rouse JW, Haas RH, Schell JA, Deering DW (1974). Monitoring the Vernal Advancements and Retrogradation of Natural Vegetation. NASA/GSFC, Final Report, Greenbelt, MD, USA, 1-137. |
| [17] | Song KS (宋开山), Zhang B (张柏), Li F (李方), Duan HT (段洪涛), Wang ZM (王宗明) (2005). Correlative analyses of hyperspectral reflectance, soybean LAI and aboveground biomass. Transactions of the Chinese Society of Agricultural Engineering (农业工程学报), 21, 36-40. (in Chinese with English abstract) |
| [18] | Wang D, Wilson C, Shannon M (2002). Interpretation of salinity and irrigation effects on soybean canopy reflectance in visible and near-infrared spectrum domain. International Journal of Remote Sensing, 23, 811-824. |
| [19] | Wang XZ (王秀珍), Huang JF (黄敬峰), Li YM (李云梅), Shen ZQ (沈掌泉), Wang RC (王人潮) (2002). Relationships between rice agricultural parameter and hyperspectral data. Journal of Zhejiang University (Agriculture & Life Sciences Edition) (浙江大学学报 (农业与生命科学版)), 28, 283-288. (in Chinese with English abstract) |
| [20] | Zhang XY (张兴义), Meng K (孟凯), Sui YY (隋跃宇) (1999). Change of stomatal resistance in soybean canopy at different nutritional level. System Sceinces and Comprehensive Studies in Agriculture (农业系统科学与综合研究), 15, 302-305. (in Chinese with English abstract) |
| [21] | Zhao CJ (赵春江), Huang WJ (黄文江), Wang JH (王纪华), Yang MH (杨敏华), Xue XZ (薛绪掌) (2002). Studies on the red edge parameters of spectrum in winter wheat under different varieties, fertilizer and water treatments. Scientia Agricultura Sinica (中国农业科学), 35, 980-987. (in Chinese with English abstract) |
| [1] | 陈雪萍, 赵学勇, 张晶, 王瑞雄, 卢建男. 基于地理探测器的科尔沁沙地植被NDVI时空变化特征及其驱动因素[J]. 植物生态学报, 2023, 47(8): 1082-1093. |
| [2] | 缪丽娟, 张宇阳, 揣小伟, 包刚, 何昱, 朱敬雯. 亚洲旱区草地NDVI对气候变化的响应及滞后效应[J]. 植物生态学报, 2023, 47(10): 1375-1385. |
| [3] | 朱玉英, 张华敏, 丁明军, 余紫萍. 青藏高原植被绿度变化及其对干湿变化的响应[J]. 植物生态学报, 2023, 47(1): 51-64. |
| [4] | 文可, 姚焕玫, 龚祝清, 纳泽林, 韦毅明, 黄以, 陈华权, 廖鹏任, 唐丽萍. 水淹频率变化对鄱阳湖增强型植被指数的影响[J]. 植物生态学报, 2022, 46(2): 148-161. |
| [5] | 原媛, 母艳梅, 邓钰洁, 李鑫豪, 姜晓燕, 高圣杰, 查天山, 贾昕. 植被覆盖度和物候变化对典型黑沙蒿灌丛生态系统总初级生产力的影响[J]. 植物生态学报, 2022, 46(2): 162-175. |
| [6] | 田佳玉, 王彬, 张志明, 林露湘. 光谱多样性在植物多样性监测与评估中的应用[J]. 植物生态学报, 2022, 46(10): 1129-1150. |
| [7] | 严正兵, 刘树文, 吴锦. 高光谱遥感技术在植物功能性状监测中的应用与展望[J]. 植物生态学报, 2022, 46(10): 1151-1166. |
| [8] | 刘宁, 彭守璋, 陈云明. 气候因子对青藏高原植被生长的时间效应[J]. 植物生态学报, 2022, 46(1): 18-26. |
| [9] | 倪铭, 张曦月, 姜超, 王鹤松. 中国西南部地区植被对极端气候事件的响应[J]. 植物生态学报, 2021, 45(6): 626-640. |
| [10] | 汲玉河, 周广胜, 王树东, 王丽霞, 周梦子. 2000-2019年秦岭地区植被生态质量演变特征及 驱动力分析[J]. 植物生态学报, 2021, 45(6): 617-625. |
| [11] | 陈哲, 汪浩, 王金洲, 石慧瑾, 刘慧颖, 贺金生. 基于物候相机归一化植被指数估算高寒草地植物地上生物量的季节动态[J]. 植物生态学报, 2021, 45(5): 487-495. |
| [12] | 周明星, 李登秋, 邹建军. 基于稠密Landsat数据的邛崃山大熊猫栖息地植被变化研究[J]. 植物生态学报, 2021, 45(4): 355-369. |
| [13] | 徐光来, 李爱娟, 徐晓华, 杨先成, 杨强强. 中国生态功能保护区归一化植被指数动态及气候因子驱动[J]. 植物生态学报, 2021, 45(3): 213-223. |
| [14] | 衣海燕, 曾源, 赵玉金, 郑朝菊, 熊杰, 赵旦. 利用聚类算法监测森林乔木物种多样性[J]. 植物生态学报, 2020, 44(6): 598-615. |
| [15] | 郭庆华, 胡天宇, 马勤, 徐可心, 杨秋丽, 孙千惠, 李玉美, 苏艳军. 新一代遥感技术助力生态系统生态学研究[J]. 植物生态学报, 2020, 44(4): 418-435. |
| 阅读次数 | ||||||||||||||||||||||||||||||||||||||||||||||||||
|
全文 3028
|
|
|||||||||||||||||||||||||||||||||||||||||||||||||
|
摘要 6411
|
|
|||||||||||||||||||||||||||||||||||||||||||||||||
Copyright © 2022 版权所有 《植物生态学报》编辑部
地址: 北京香山南辛村20号, 邮编: 100093
Tel.: 010-62836134, 62836138; Fax: 010-82599431; E-mail: apes@ibcas.ac.cn, cjpe@ibcas.ac.cn
备案号: 京ICP备16067583号-19 51La