
植物生态学报 ›› 2006, Vol. 30 ›› Issue (4): 675-681.DOI: 10.17521/cjpe.2006.0088
薛利红, 卢萍, 杨林章*( ), 单玉华, 范晓晖, 韩勇
收稿日期:2005-01-12
接受日期:2005-10-30
出版日期:2006-01-12
发布日期:2006-07-30
通讯作者:
杨林章
作者简介:*E-mail:lzyang@issas.ac.cn基金资助:
XUE Li-Hong, LU Ping, YANG Lin-Zhang*(), SHAN Yu-Hua, FAN Xiao-Hui, HAN Yong
Received:2005-01-12
Accepted:2005-10-30
Online:2006-01-12
Published:2006-07-30
Contact:
YANG Lin-Zhang
摘要:
系统测定了不同秸秆还田和氮肥处理下水稻(Oryza sativa)关键生育期的冠层反射光谱及土壤速效氮含量,并对两者之间的关系进行了详尽的分析。结果表明: 土壤速效氮含量在整个水稻生育期内均与可见光波段反射率呈负相关,与近红外波段反射率呈正相关。归一化及比值植被指数与土壤速效氮含量有更好的相关性,分蘖期要优于其它生育时期,以870、1 220 nm波段与560和710 nm波段的组合最佳,但两者的关系易受土壤等背景的干扰。而转换型土壤调节植被指数TSAVI能较好地消除分蘖期土壤背景的影响,两生态点可用统一的方程来拟合,用该研究中所筛选出的最佳波段组合计算出的TSAVI的表现更好,尤其是870 nm波段和710 nm波段的组合,决定系数(R2)由0.46提高到0.60。抽穗期和灌浆期由1 220和760 nm计算的比值指数R(1 220, 760)和新土壤调节植被指数SAVI(1 220,760)与土壤速效氮含量的关系则不受生态点的影响,可用统一回归方程来拟合。这说明水稻冠层反射光谱可以用来评价稻田土壤肥力状况,但仍需进一步研究。
薛利红, 卢萍, 杨林章, 单玉华, 范晓晖, 韩勇. 利用水稻冠层光谱特征诊断土壤氮素营养状况. 植物生态学报, 2006, 30(4): 675-681. DOI: 10.17521/cjpe.2006.0088
XUE Li-Hong, LU Ping, YANG Lin-Zhang, SHAN Yu-Hua, FAN Xiao-Hui, HAN Yong. ESTIMATION OF SOIL NITROGEN STATUS WITH CANOPY REFLECTANCE SPECTRA IN RICE. Chinese Journal of Plant Ecology, 2006, 30(4): 675-681. DOI: 10.17521/cjpe.2006.0088
| 波段 Band (nm) | 460 | 510 | 560 | 610 | 660 | 680 | 710 | 760 | 810 | 870 | 950 | 1 100 | 1 220 | 1 480 | 1 500 | 1 650 |
|---|---|---|---|---|---|---|---|---|---|---|---|---|---|---|---|---|
| 中心波长 Center wave- length | 460.4 | 511.4 | 560.9 | 610.7 | 661.7 | 682.0 | 711.4 | 761.2 | 812.6 | 871.6 | 951.2 | 1 099.5 | 1 222.8 | 1 480.2 | 1 500.2 | 1 669.0 |
| 带宽 Band width | 8.3 | 8.8 | 8.7 | 9.7 | 9.4 | 11.7 | 12.4 | 9.9 | 11.2 | 12.6 | 10.6 | 16.3 | 11.5 | 13.1 | 15.3 | 195.0 |
表1 MSR-16多光谱辐射仪的中心波长和带宽
Table 1 The center wavelength and band width of MSR-16 Multi-spectral radiometer
| 波段 Band (nm) | 460 | 510 | 560 | 610 | 660 | 680 | 710 | 760 | 810 | 870 | 950 | 1 100 | 1 220 | 1 480 | 1 500 | 1 650 |
|---|---|---|---|---|---|---|---|---|---|---|---|---|---|---|---|---|
| 中心波长 Center wave- length | 460.4 | 511.4 | 560.9 | 610.7 | 661.7 | 682.0 | 711.4 | 761.2 | 812.6 | 871.6 | 951.2 | 1 099.5 | 1 222.8 | 1 480.2 | 1 500.2 | 1 669.0 |
| 带宽 Band width | 8.3 | 8.8 | 8.7 | 9.7 | 9.4 | 11.7 | 12.4 | 9.9 | 11.2 | 12.6 | 10.6 | 16.3 | 11.5 | 13.1 | 15.3 | 195.0 |
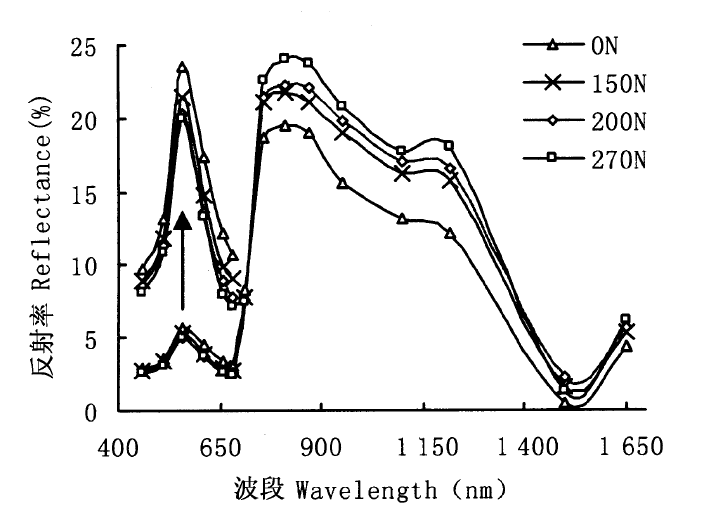
图1 分蘖期不同氮肥处理下的水稻冠层光谱反射率 ON: 无氮 Zero N 150N:低氮 Low N 200N:减氮 Reduced N 270N:常氮 Common N
Fig.1 Canopy spectral reflectance of rice under different N levels
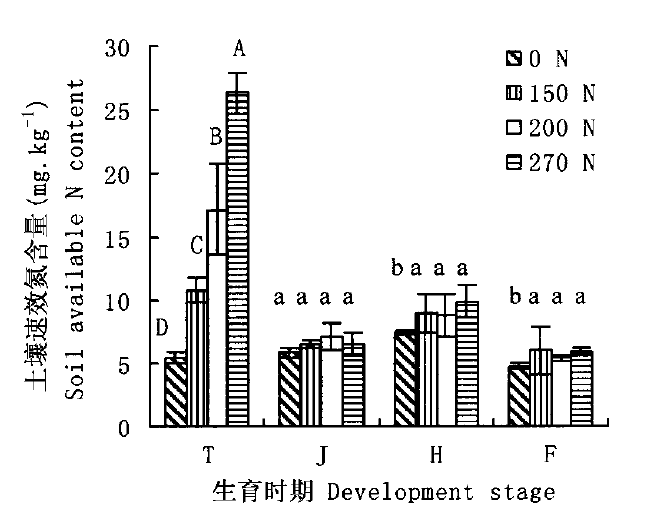
图2 不同氮肥处理下的速效氮含量 T: 分蘖期Tillering J: 拔节期Jointing H:抽穗期Heading F: 灌浆期Filling ON,150N,200N,270N:同图1 See Fig.1
Fig.2 Soil available N content under different N levels at different developing stage
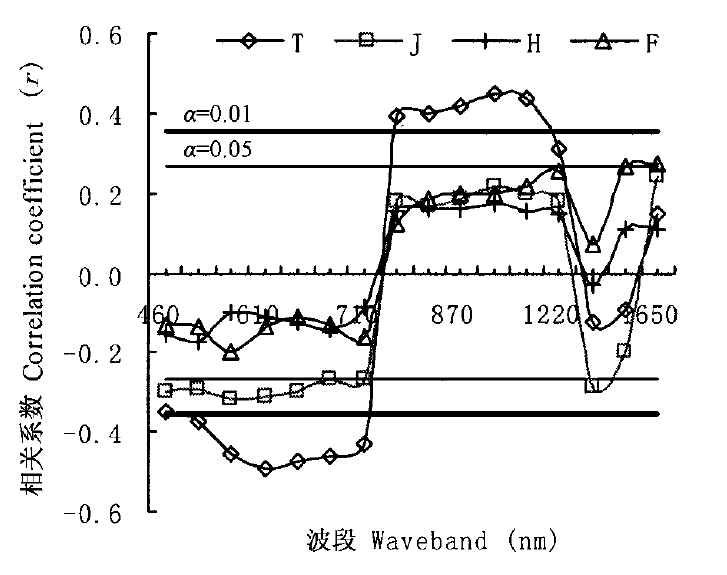
图3 土壤速效氮含量与水稻冠层光谱反射率的相关系数(r) T, J, H, F: 同图2 See Fig.2
Fig.3 Correlation coefficient (r) of soil available N content to canopy reflectance at different developing stage
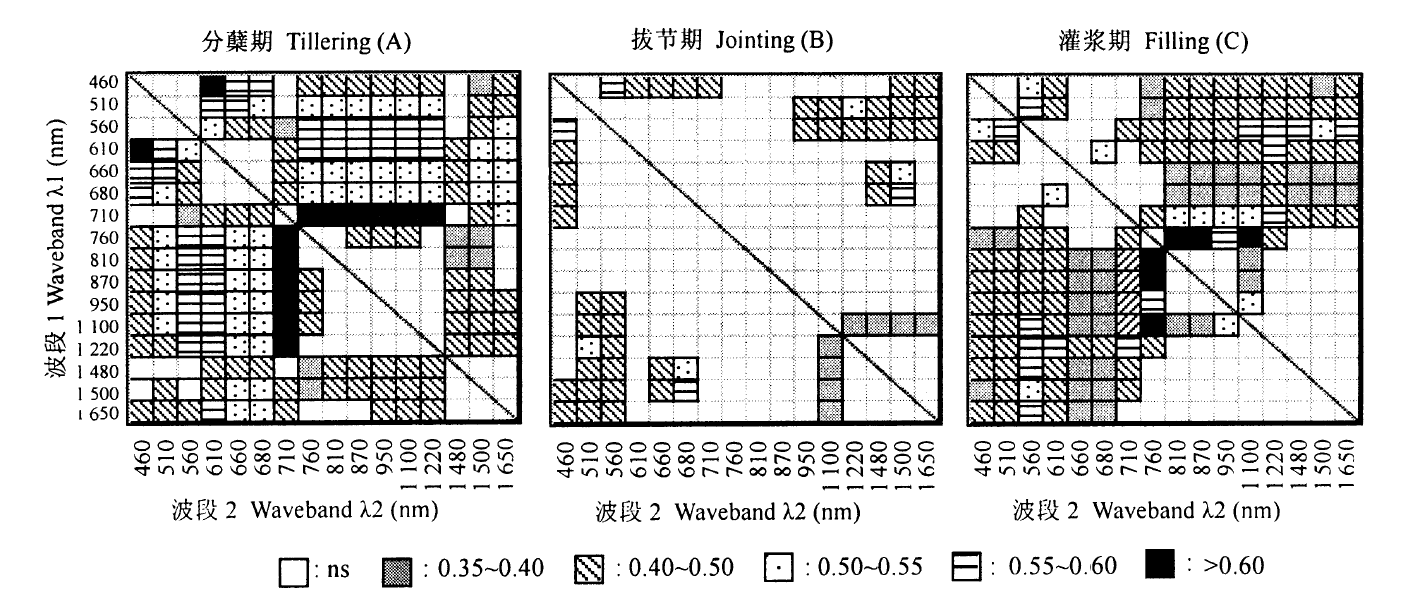
图4 宜兴土壤速效氮含量与两波段比值和归一化组合之间的相关系数(r)图 ns指不显著,上三角为归一化组合,下三角为比值组合
Fig.4 Correlation coefficient (r) of all combinations of wavelengths to soil available N content The right triangle means the normalized differences vegetation index, the below triangle below the diagonal means the ratio vegetation index
| 生育期 Developing stage | 宜兴 Yixing | 常熟 Changshu |
|---|---|---|
| 分蘖期Tillering | $\frac{760,810,870,950,1100,1220}{710,560,610} \quad \frac{610}{460}$ | $ \frac{810,870,1220,1500}{460,510,560,710}$ |
| 拔节期Jointing | $\frac{1500,1650}{460} \quad \frac{950 \sim 1650}{510,560}, \frac{1480,1500}{660,680}$ | - |
| 抽穗期Heading | $\begin{array}{c}\frac{760,810,870,950,1220}{680} \frac{680}{460,510,560} \\\frac{1220}{760}\end{array}$ | $\begin{array}{c}\frac{760,810,870,950,1100,1220}{460,510,560,610,660,680} \\\frac{1480,1500,1650}{560,610,680} \quad \frac{1220}{760}\end{array}$ |
| 灌浆期Filling | $ \frac{810,870,1220}{760} \quad \frac{1220}{710,810,870}$ |
表2 不同生育时期最佳的光谱植被指数比较
Table 2 Best vegetation indices for evaluating soil available N content at different development stage of rice
| 生育期 Developing stage | 宜兴 Yixing | 常熟 Changshu |
|---|---|---|
| 分蘖期Tillering | $\frac{760,810,870,950,1100,1220}{710,560,610} \quad \frac{610}{460}$ | $ \frac{810,870,1220,1500}{460,510,560,710}$ |
| 拔节期Jointing | $\frac{1500,1650}{460} \quad \frac{950 \sim 1650}{510,560}, \frac{1480,1500}{660,680}$ | - |
| 抽穗期Heading | $\begin{array}{c}\frac{760,810,870,950,1220}{680} \frac{680}{460,510,560} \\\frac{1220}{760}\end{array}$ | $\begin{array}{c}\frac{760,810,870,950,1100,1220}{460,510,560,610,660,680} \\\frac{1480,1500,1650}{560,610,680} \quad \frac{1220}{760}\end{array}$ |
| 灌浆期Filling | $ \frac{810,870,1220}{760} \quad \frac{1220}{710,810,870}$ |
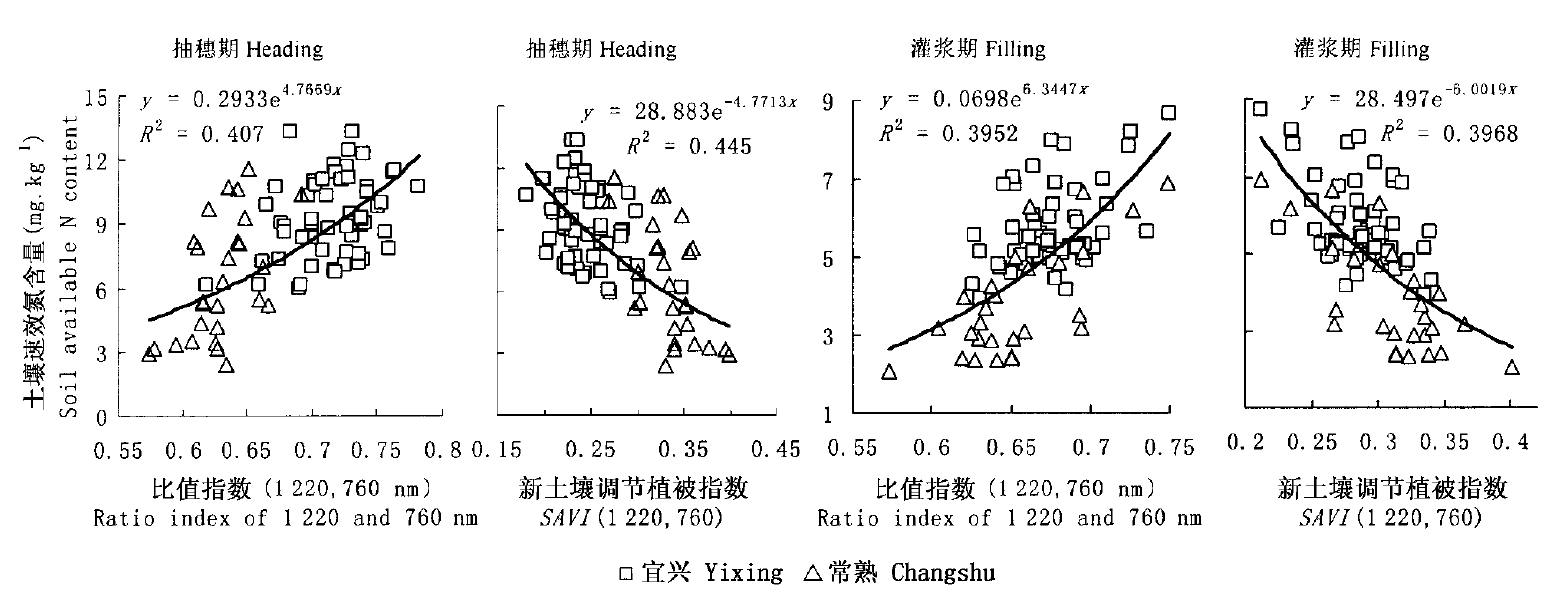
图5 抽穗期和灌浆期土壤速效氮与比值指数R(1 220,760) 和 SAVI(1 220,760)的关系
Fig.5 Relationships of soil available content to ratio vegetation index of 1 220 and 760 nm, and SAVI calculated by 1 220 and 760 nm at heading stage and filling stage
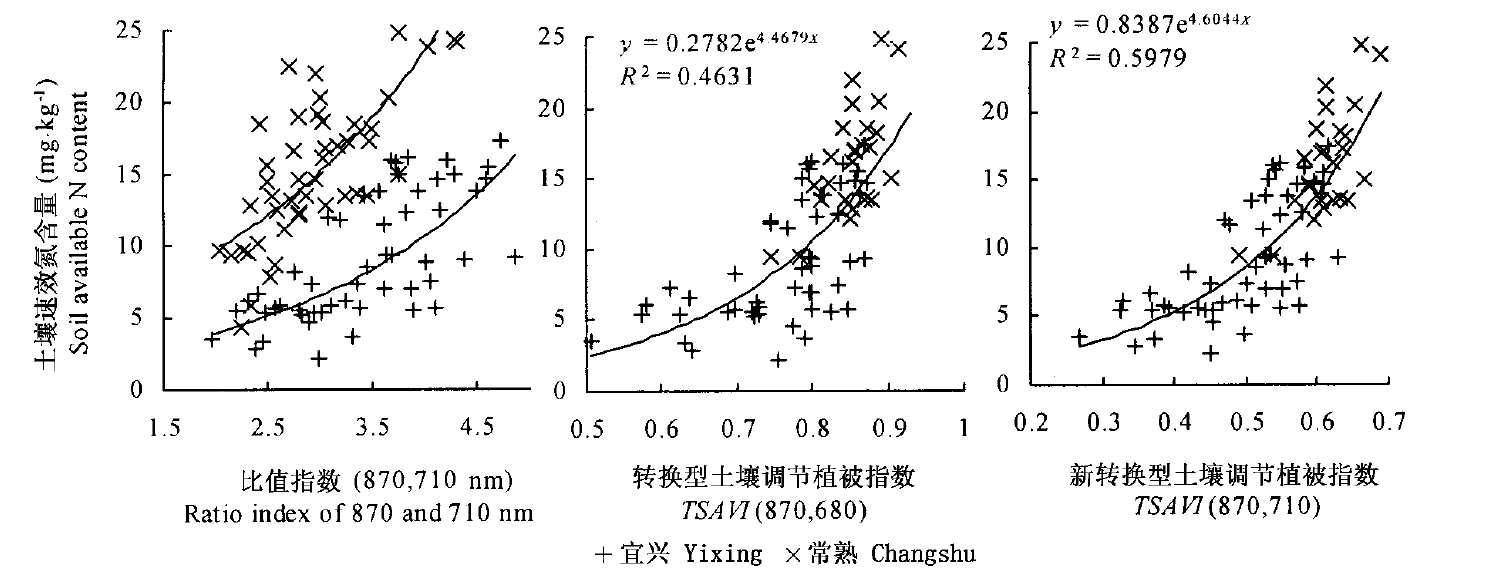
图6 分蘖期不同地点土壤速效氮与比值植被指数R(870,710)、TSAVI(870,680)及TSAVI(870,710)的关系
Fig.6 Relationships of soil available content to ratio vegetation index of 870 and 710 nm, TSAVI and TSAVI calculated by 870 and 710 nm at two different sites at tillering stage
| [1] | Chris TL, David RS, Michael SC, Melinda JA, Brain W, Milton CW (2003). Utility of remote sensing in predicting crop and soil characteristics. Precision Agriculture, 4, 359-384. |
| [2] | Diker K, Bausch WC (2003). Radiometric field measurements of maize for estimating soil and plant nitrogen. Biosystems Engineering, 86, 411-420. |
| [3] | Galvao LS, Pizarro MA, Epiphanio JCN (2001). Variations in reflectance of tropical soils: spectral-chemical composition relationships from AVIRIS data. Remote Sensensing of Environment, 75, 245-255. |
| [4] | Huang YF( 黄应丰), Liu TH( 刘腾辉) (1995). Spectral characteristics of main types of soils in Southern China and soil classification. Aata Pedologica Sinica(土壤学报), 32, 58-68. (in Chinese with English abstract) |
| [5] | Li MZ (2003). Evaluating soil parameters with visible spectroscopy. Transactions of the CSAE(农业工程学报), 19, 36-41. |
| [6] | Li MZ, Sasao A, Shibusawa S (2000). Soil parameters estimation with NIR spectroscopy. Journal of the Japanese Society of Agricultural Machinery, 62, 111-120. (in Japanese with English abstract) |
| [7] |
Muller E, Decamps H (2000). Modeling soil moisture reflectance. Remote Sensing of Environment, 76, 173-180.
DOI URL |
| [8] | Sha JM( 沙晋明), Chen PC( 陈鹏程), Chen SL( 陈松林) (2003). Charateristics analysis of soil spectrum response resulted from organic material. Research of Soil and Water Conservation (水土保持研究), 10, 103-107. (in Chinese with English abstract) |
| [9] | Wang XZ( 王秀珍), Wang RC( 王人潮), Huang JF( 黄敬峰) (2002). Derivative spectrum remote sensing and its application in measurement of rice agronomic parameter. Transactions of the CSAE (农业工程学报), 18, 9-13. (in Chinese with English abstract) |
| [10] | Xue LH( 薛利红), Cao WX( 曹卫星), Luo WH( 罗卫红), Jiang D( 姜东), Meng YL( 孟亚丽), Zhu Y( 朱艳) (2003). Diagnosis of nitrogen status in rice leaves with the canopy spectral reflectance. Scientia Agricultura Sinica(中国农业科学), 36, 808-812. (in Chinese with English abstract) |
| [11] | Xue LH( 薛利红), Cao WX( 曹卫星), Luo WH( 罗卫红), Wang SH( 王绍华)(2004). Relationship between spectral vegetation indices and LAI in rice. Acta Phytoecologica Sinica(植物生态学报), 28, 47-52. (in Chinese with English abstract) |
| [12] | Xue LH, Cao WX, Luo WH, Dai TB, Zhu Y (2004). Monitoring leaf nitrogen status in rice with canopy spectral reflectance. Agronomy Journal, 96, 135-142. |
| [1] | 陈雪萍, 赵学勇, 张晶, 王瑞雄, 卢建男. 基于地理探测器的科尔沁沙地植被NDVI时空变化特征及其驱动因素[J]. 植物生态学报, 2023, 47(8): 1082-1093. |
| [2] | 缪丽娟, 张宇阳, 揣小伟, 包刚, 何昱, 朱敬雯. 亚洲旱区草地NDVI对气候变化的响应及滞后效应[J]. 植物生态学报, 2023, 47(10): 1375-1385. |
| [3] | 朱玉英, 张华敏, 丁明军, 余紫萍. 青藏高原植被绿度变化及其对干湿变化的响应[J]. 植物生态学报, 2023, 47(1): 51-64. |
| [4] | 文可, 姚焕玫, 龚祝清, 纳泽林, 韦毅明, 黄以, 陈华权, 廖鹏任, 唐丽萍. 水淹频率变化对鄱阳湖增强型植被指数的影响[J]. 植物生态学报, 2022, 46(2): 148-161. |
| [5] | 原媛, 母艳梅, 邓钰洁, 李鑫豪, 姜晓燕, 高圣杰, 查天山, 贾昕. 植被覆盖度和物候变化对典型黑沙蒿灌丛生态系统总初级生产力的影响[J]. 植物生态学报, 2022, 46(2): 162-175. |
| [6] | 刘宁, 彭守璋, 陈云明. 气候因子对青藏高原植被生长的时间效应[J]. 植物生态学报, 2022, 46(1): 18-26. |
| [7] | 倪铭, 张曦月, 姜超, 王鹤松. 中国西南部地区植被对极端气候事件的响应[J]. 植物生态学报, 2021, 45(6): 626-640. |
| [8] | 汲玉河, 周广胜, 王树东, 王丽霞, 周梦子. 2000-2019年秦岭地区植被生态质量演变特征及 驱动力分析[J]. 植物生态学报, 2021, 45(6): 617-625. |
| [9] | 陈哲, 汪浩, 王金洲, 石慧瑾, 刘慧颖, 贺金生. 基于物候相机归一化植被指数估算高寒草地植物地上生物量的季节动态[J]. 植物生态学报, 2021, 45(5): 487-495. |
| [10] | 周明星, 李登秋, 邹建军. 基于稠密Landsat数据的邛崃山大熊猫栖息地植被变化研究[J]. 植物生态学报, 2021, 45(4): 355-369. |
| [11] | 徐光来, 李爱娟, 徐晓华, 杨先成, 杨强强. 中国生态功能保护区归一化植被指数动态及气候因子驱动[J]. 植物生态学报, 2021, 45(3): 213-223. |
| [12] | 张文强, 罗格平, 郑宏伟, 王浩, HAMDI Rafiq, 何惠丽, 蔡鹏, 陈春波. 基于随机森林模型的内陆干旱区植被指数变化与驱动力分析: 以北天山北坡中段为例[J]. 植物生态学报, 2020, 44(11): 1113-1126. |
| [13] | 史娜娜, 肖能文, 王琦, 韩煜, 高晓奇, 冯瑾, 全占军. 锡林郭勒植被NDVI时空变化及其驱动力定量分析[J]. 植物生态学报, 2019, 43(4): 331-341. |
| [14] | 赵芸, 贾荣亮, 高艳红, 周媛媛, 滕嘉玲. 腾格里沙漠人工固沙植被演替过程中生物土壤结皮归一化植被指数的变化特征[J]. 植物生态学报, 2017, 41(9): 972-984. |
| [15] | 王克清, 王鹤松, 孙建新. 遥感GPP模型在中国地区多站点的应用与比较[J]. 植物生态学报, 2017, 41(3): 337-347. |
| 阅读次数 | ||||||
|
全文 |
|
|||||
|
摘要 |
|
|||||
Copyright © 2026 版权所有 《植物生态学报》编辑部
地址: 北京香山南辛村20号, 邮编: 100093
Tel.: 010-62836134, 62836138; Fax: 010-82599431; E-mail: apes@ibcas.ac.cn, cjpe@ibcas.ac.cn
备案号: 京ICP备16067583号-19
![]()