
植物生态学报 ›› 2021, Vol. 45 ›› Issue (3): 213-223.DOI: 10.17521/cjpe.2020.0096 cstr: 32100.14.cjpe.2020.0096
所属专题: 生态系统结构与功能; 青藏高原植物生态学:遥感生态学
• 研究论文 • 下一篇
徐光来1,2, 李爱娟1,2, 徐晓华1,*( ), 杨先成1,2, 杨强强1,2
收稿日期:2020-04-07
接受日期:2020-06-03
出版日期:2021-03-20
发布日期:2021-05-17
作者简介:* (xuxh1113@126.com)基金资助:
XU Guang-Lai1,2, LI Ai-Juan1,2, XU Xiao-Hua1,*(), YANG Xian-Cheng1,2, YANG Qiang-Qiang1,2
Received:2020-04-07
Accepted:2020-06-03
Online:2021-03-20
Published:2021-05-17
Supported by:摘要:
为揭示生态功能保护区归一化植被指数(NDVI)与气候因子相关性, 为今后该区域植被动态监测提供有用的信息, 该研究基于2000-2015年MODIS NDVI数据和逐月格点降水与气温数据, 采用生态功能保护区和像元两种空间尺度, 应用线性倾向分析、偏相关分析、复相关分析等方法研究了46个生态功能保护区NDVI变化及其与气候因子的关系, 在此基础上基于相关系数显著性水平对生态功能保护区NDVI动态进行了气候因子驱动分区。主要结果: (1)生态功能保护区NDVI总体呈增加趋势, 其增率加权平均值为0.045·a-1。像元分析表明, NDVI显著增加的区域主要分布在中部和东北部。(2)生态功能保护区NDVI与降水的偏相关系数在-0.30-0.72之间, 在32个分区呈正相关关系。NDVI与气温的偏相关性在-0.36-0.92之间, 在39个分区呈正相关关系。像元分析表明, 50.6%的像元NDVI与降水呈显著正偏相关关系, 主要分布在东北及西北地区。64.6%的像元NDVI与气温呈显著正偏相关关系, 主要分布在东北及青藏高原北缘地区。(3)气温-降水强驱动型是主要驱动类型, 占总面积的38.7%; 气温驱动型为次要驱动类型, 占27.3%; 非气候因子驱动型占17.6%。以上结果表明, 生态功能保护区NDVI与气温、降水气候因子改变具有显著相关性, 气候因子驱动的地区共占82.4%。研究气候变暖背景下生态功能保护区NDVI变化及其对气候因子的响应, 对于认识该区植被动态变化规律具有重要作用。
徐光来, 李爱娟, 徐晓华, 杨先成, 杨强强. 中国生态功能保护区归一化植被指数动态及气候因子驱动. 植物生态学报, 2021, 45(3): 213-223. DOI: 10.17521/cjpe.2020.0096
XU Guang-Lai, LI Ai-Juan, XU Xiao-Hua, YANG Xian-Cheng, YANG Qiang-Qiang. NDVIdynamics and driving climatic factors in the Protected Zones for Ecological Functions in China. Chinese Journal of Plant Ecology, 2021, 45(3): 213-223. DOI: 10.17521/cjpe.2020.0096
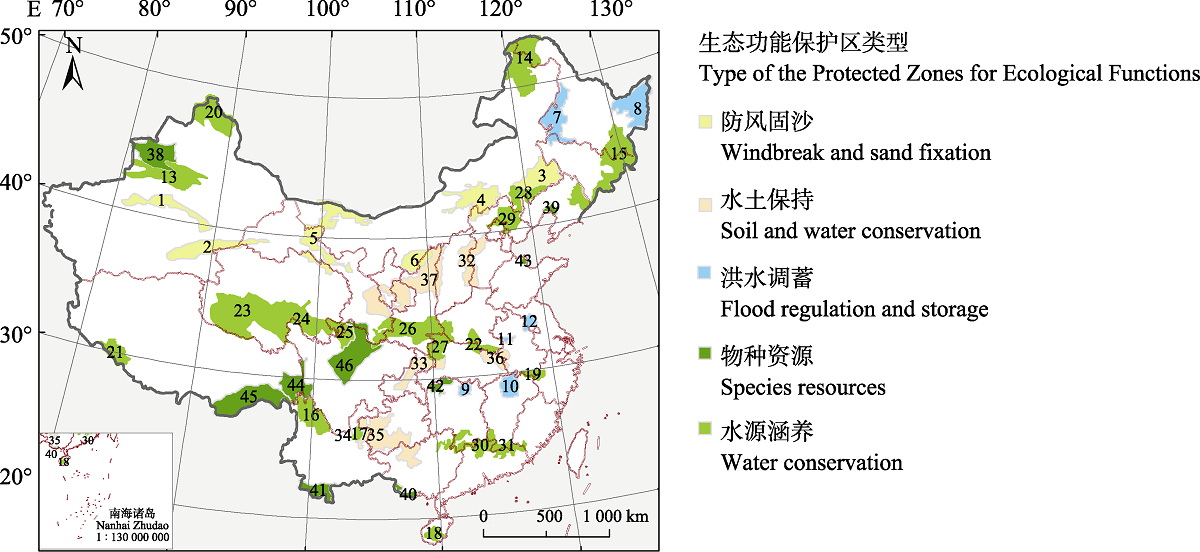
图1 中国生态功能保护区分布图。防风固沙生态功能区: 1, 塔里木河流域; 2, 阿尔金荒漠草原; 3, 科尔沁沙地; 4, 阴山北麓-浑善达克沙地; 5, 黑河流域生态功能区; 6, 毛乌素沙地。洪水调蓄生态功能保护区: 7, 松嫩平原湿地; 8, 三江平原湿地; 9, 洞庭湖区; 10, 鄱阳湖区; 11, 沿淮河蓄洪区; 12, 南水北调东段工程水源区。水源涵养生态功能区: 13, 天山山地; 14, 大兴安岭; 15, 长白山山地; 16, 滇西北; 17, 珠江源(云南部分); 18, 海南岛中部山区; 19, 新安江上游水源涵养; 20, 阿尔泰山地; 21, 雅鲁藏布江源头; 22, 淮河源; 23, 长江源; 24, 黄河源; 25, 若尔盖-玛曲; 26, 秦岭山地; 27, 南水北调中线工程水源区; 28, 西辽河源; 29, 京津水源涵养; 30, 南岭山地; 31, 江西东江源。水土保持生态功能保护区: 32, 太行山地; 33, 三峡库区; 34, 云南东川; 35, 西南喀斯特; 36, 大别山山地; 37, 黄土高原。物种资源生态功能保护区: 38, 伊犁-天山山地西段; 39, 辽河三角洲湿地; 40, 桂西南石灰岩; 41, 西双版纳; 42, 武陵山山地; 43, 黄河三角洲湿地; 44, 横断山南部; 45, 藏东南山地; 46, 岷山-邛崃山。
Fig. 1 Map of the Protected Zones for Ecological Functions in China. Ecological function zones of windbreak and sand fixation type: 1, Tarim River basin; 2, Altun desert grassland; 3, Horqin Sandy Land; 4, sandy land of the northern foot of Yinshan Mountain and Onqin Daga; 5, Heihe River basin ecological function protection area; 6, Mu Us sandy land. Ecological function zones of flood regulation and storage: 7, Songnen Plain wetland; 8, Sanjiang Plain wetland; 9, Dongting Lake area; 10, Poyang Lake area; 11, flood storage area along Huaihe River; 12, water source area of east route of south-north water transfer project. Ecological functional zones of water conservation: 13, Tianshan Mountain; 14, Da Hinggan Mountains; 15, Changbai Mountain; 16, Northwest Yunnan; 17, Source regions of Pearl River (located in Yunnan); 18, central mountain area of Hainan Island; 19, water conservation of the upper reaches of Xin?an River; 20, Altai Mountain; 21, source of Yarlung Zangbo River; 22, source regions of Huaihe River; 23, source regions of Yangtze River; 24, source regions of Yellow River; 25, Zoigê-Maqu; 26, Qinling Mountain; 27, water source area of the middle route of south-north water transfer project; 28, source regions of west Liaohe River; 29, water conservation of Beijing and Tianjin; 30, Nanling Mountain; 31, source regions of Dongjiang of Jiangxi Province. Ecological function zones of soil and water conservation: 32, Taihang Mountain; 33, Three Gorges Reservoir area; 34, Dongchuan of Yunnan province; 35, Southwest Karst; 36, Dabie Mountain; 37, Loess Plateau. Ecological function zones of species resources: 38, west section of Ili and Tianshan Mountain; 39, Liaohe Delta wetland; 40, Limestone in Southwest Guangxi; 41, Xishuangbanna; 42, Wuling Mountain; 43, Yellow River Delta wetland; 44, south of Hengduan Mountain; 45, Southeast Xizang mountain; 46, Minshan and Qionglai Mountain.
| NDVI变化驱动因子 NDVIchanges driving factor | NDVI变化驱动类型 NDVIchange driving type | 准则 Rule | ||
|---|---|---|---|---|
| rNDVI-P,T | rNDVI-T,P | rNDVI-PT | ||
| 气候因子 Climate factor | 气温降水强驱动型 [T+P]+ Strong temperature-precipitation driving type | |t| > t0.01 | |t| > t0.01 | F > F0.01 |
| 降水驱动型 P Precipitation driving type | |t| > t0.01 | F>F0.01 | ||
| 气温驱动型 T Temperature driving type | |t| > t0.01 | F>F0.01 | ||
| 气温降水弱驱动型 [T+P]- Weak temperature-precipitation driving type | |t| ≤ t0.01 | |t| ≤ t0.01 | F>F0.01 | |
| 非气候因子 Non-climate factor | 非气候因子驱动型 NC Non-climatic driving type | F≤F0.01 | ||
表1 归一化植被指数(NDVI)变化驱动力分区准则
Table 1 Zoning rules for drivers of normalized difference vegetation index (NDVI) changes
| NDVI变化驱动因子 NDVIchanges driving factor | NDVI变化驱动类型 NDVIchange driving type | 准则 Rule | ||
|---|---|---|---|---|
| rNDVI-P,T | rNDVI-T,P | rNDVI-PT | ||
| 气候因子 Climate factor | 气温降水强驱动型 [T+P]+ Strong temperature-precipitation driving type | |t| > t0.01 | |t| > t0.01 | F > F0.01 |
| 降水驱动型 P Precipitation driving type | |t| > t0.01 | F>F0.01 | ||
| 气温驱动型 T Temperature driving type | |t| > t0.01 | F>F0.01 | ||
| 气温降水弱驱动型 [T+P]- Weak temperature-precipitation driving type | |t| ≤ t0.01 | |t| ≤ t0.01 | F>F0.01 | |
| 非气候因子 Non-climate factor | 非气候因子驱动型 NC Non-climatic driving type | F≤F0.01 | ||
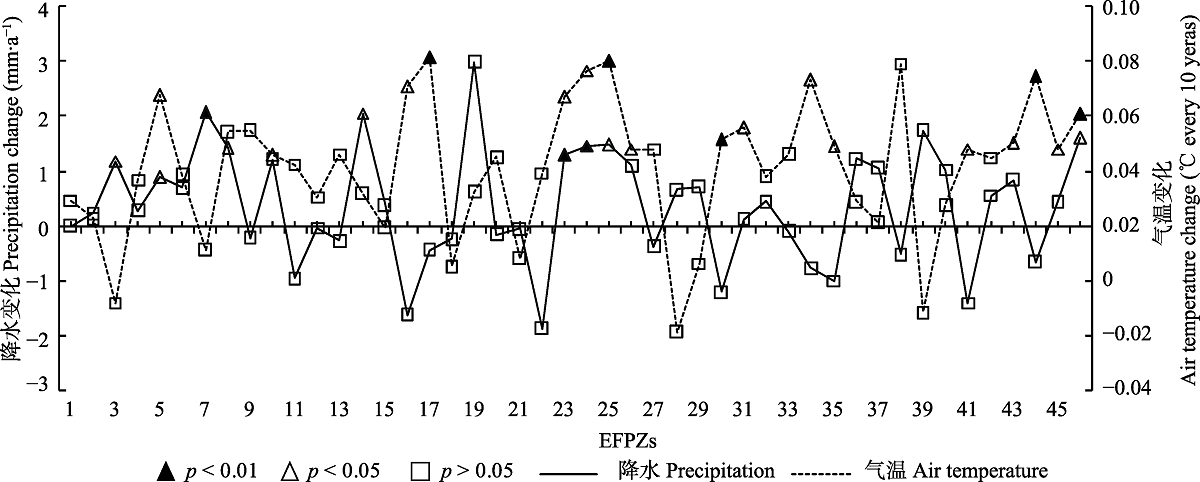
图2 中国生态功能保护区(EFPZs)降水和气温变化率。生态功能保护区编号见图1。
Fig. 2 Rates of changes in precipitation and temperatures in Protected Zones for Ecological Functions (EFPZs) in China. See Fig. 1 for the numbering of EFPZs.
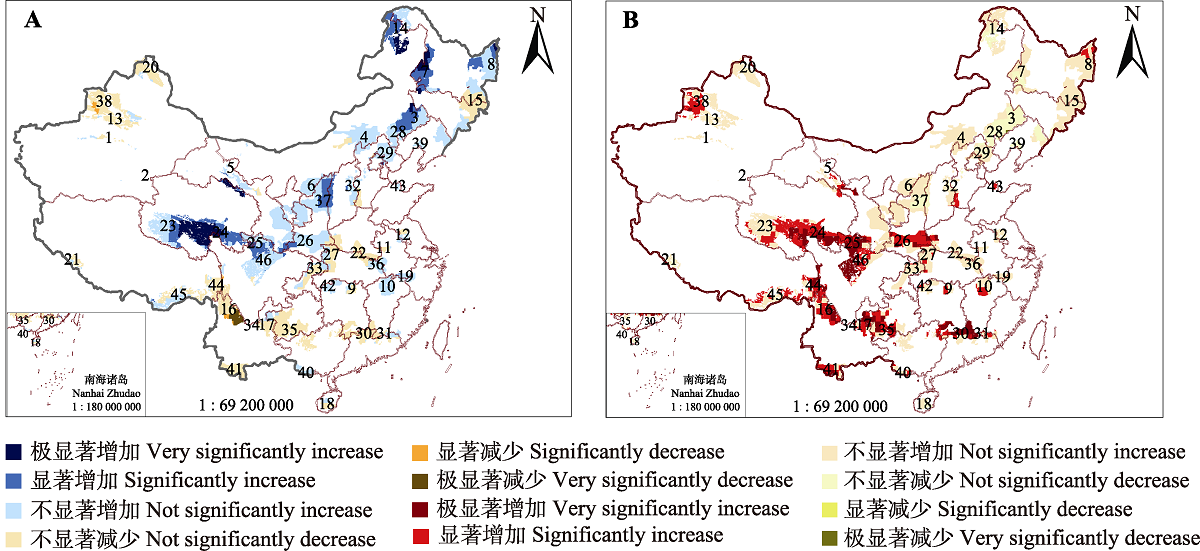
图3 中国生态功能保护区气候因子变化。A, 降水。B, 气温。生态功能保护区编号见图1。
Fig. 3 Changes of climatic factors in Protected Zones for Ecological Functions (EFPZs) in China. A, Precipitation. B, Air temperature. See Fig. 1 for the numbering of EFPZs.
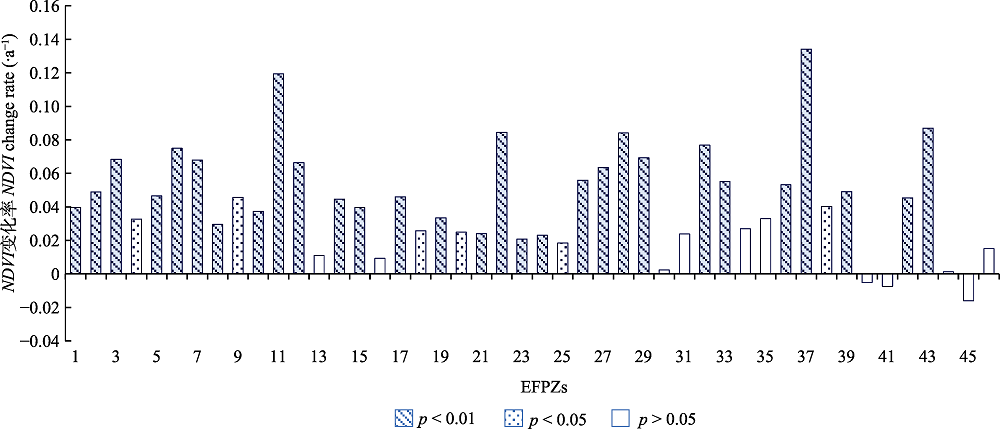
图4 中国生态功能保护区(EFPZs)归一化植被指数(NDVI)年变化。生态功能保护区编号见图1。
Fig. 4 Rate of changes in annual cumulative normalized difference vegetation index (NDVI) in Protected Zones for Ecological Functions (EFPZs) in China. See Fig. 1 for the numbering of EFPZs.
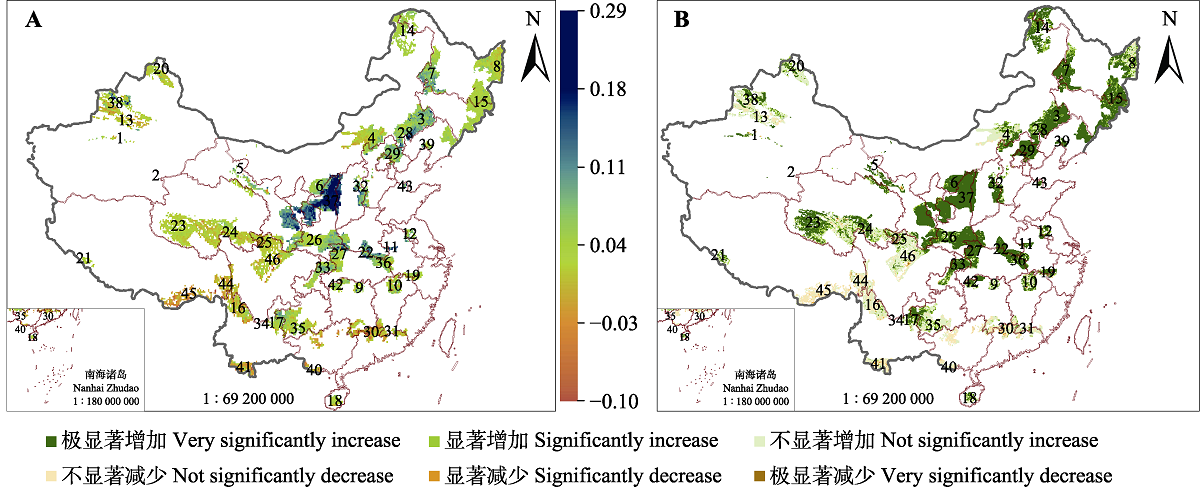
图5 中国生态功能保护区像元尺度归一化植被指数(NDVI)年变化。A, 变化率(·a-1)。B, 显著水平。生态功能保护区编号见图1。
Fig. 5 Annual change in normalized difference vegetation index (NDVI) at pixel scale in Protected Zones for Ecological Functions (EFPZs) in China. A, Change rate (·a-1). B, Significance level. See Fig. 1 for the numbering of EFPZs.
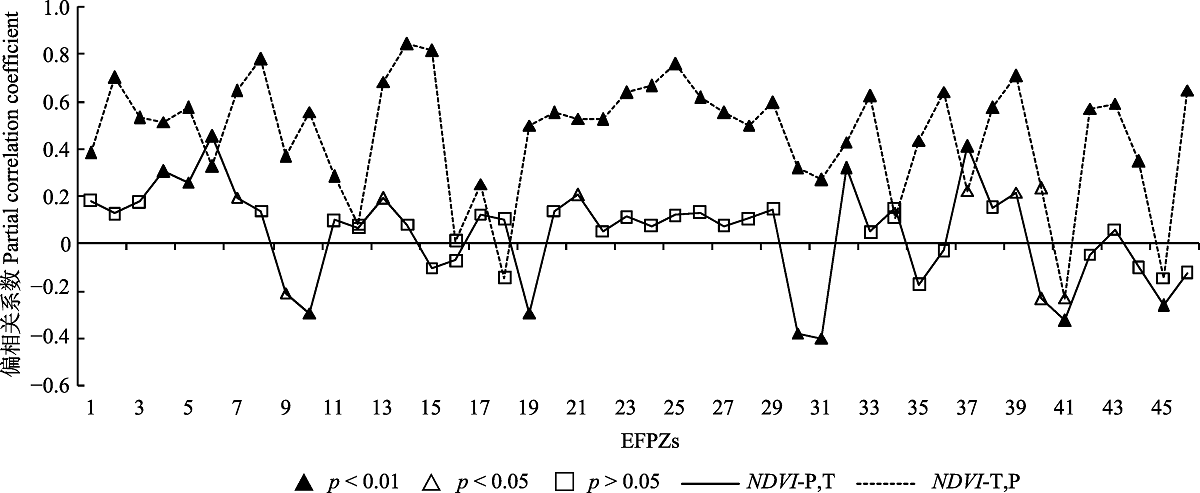
图6 中国生态功能保护区(EFPZs)归一化植被指数(NDVI)与降水(NDVI-P,T)、气温(NDVI-T,P)偏相关系数。生态功能保护区编号见图1。
Fig. 6 Partial correlation coefficients of normalized difference vegetation index (NDVI) with precipitation (NDVI-P,T) and air temperature (NDVI-T,P) in Protected Zones for Ecological Functions (EFPZs) in China. See Fig. 1 for numbering of EFPZs.
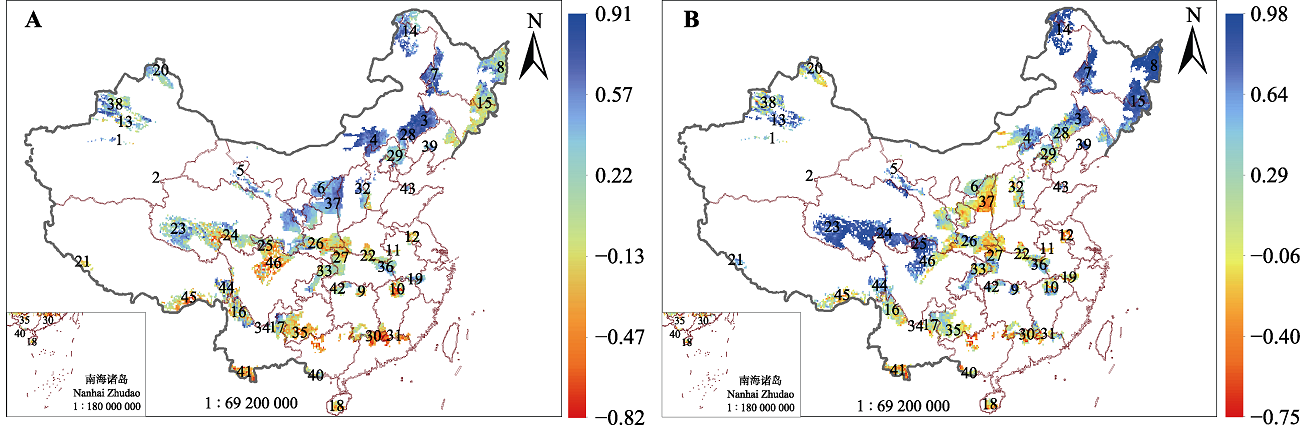
图7 中国生态功能保护区像元尺度归一化植被指数(NDVI)与气候因子偏相关性空间分布。A, 降水。B, 气温。生态功能保护区编号见图1。
Fig. 7 Spatial pattern of partial correlations between normalized difference vegetation index (NDVI) and climate factors at pixel scale in Protected Zones for Ecological Functions (EFPZs) in China. A, Precipitation. B, Air temperature. See Fig. 1 for numbering of EFPZs.
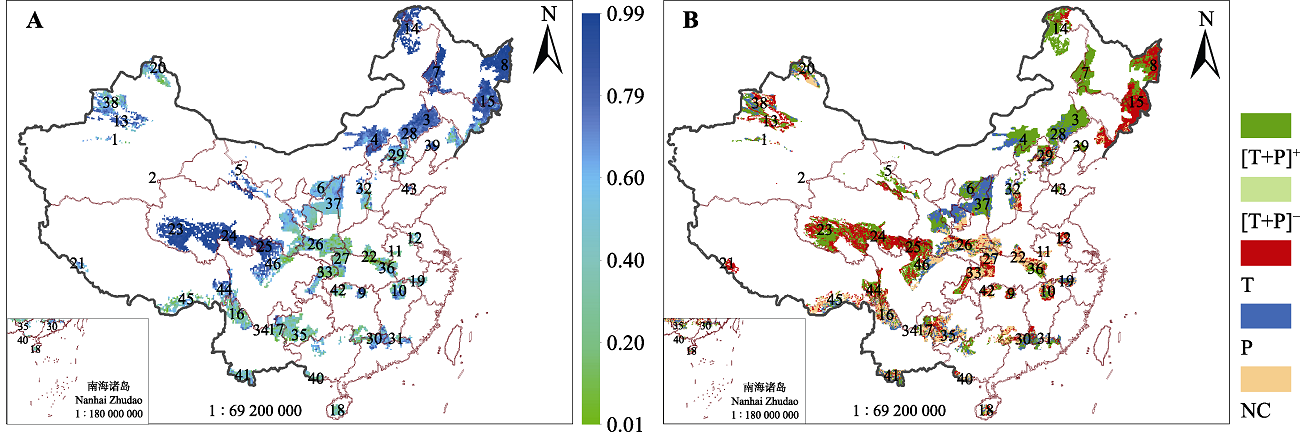
图8 中国生态功能保护区像元尺度归一化植被指数(NDVI)的气候因子驱动分区。A, 复相关性。B, 驱动类型区。生态功能保护区编号见图1。NDVI的气候因子驱动类型见表1。
Fig. 8 Zoning of driving types in normalized difference vegetation index (NDVI) changes at pixel scale. A, Multiple correlations between NDVI and climatic factors in Protected Zones for Ecological Functions (EFPZs) in China. B, Driving type zone. See Fig. 1 for numbering of EFPZs. See Table 1 for driving type of climatic influences on NDVI changes.
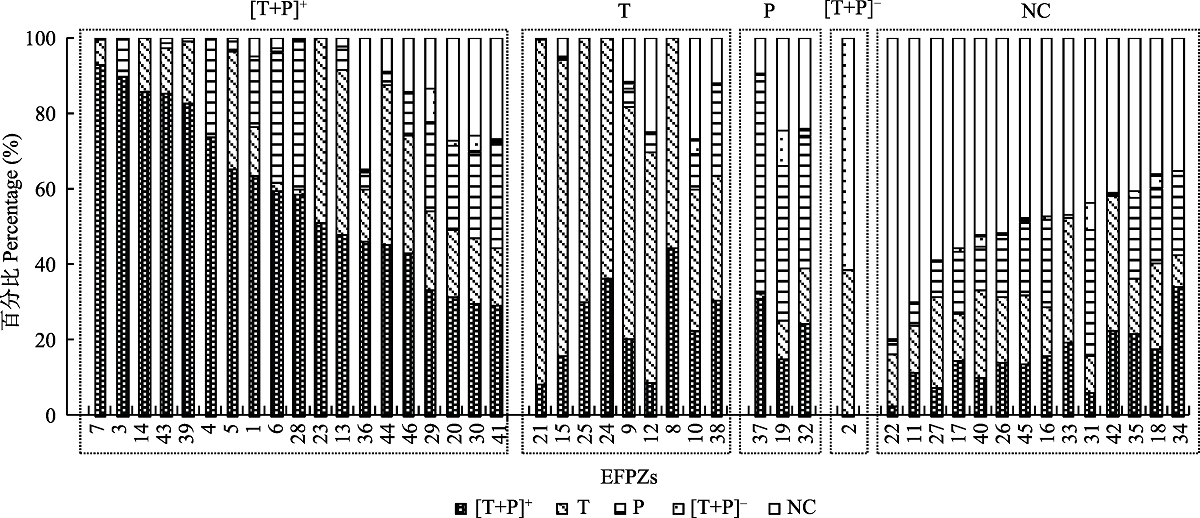
图9 中国生态功能保护区(EFPZs)归一化植被指数(NDVI)气候驱动分区。生态功能保护区编号见图1。NDVI的气候因子驱动类型见表1。
Fig. 9 Zoning of climatic driving types in normalized difference vegetation index (NDVI) in Protected Zones for Ecological Functions (EFPZs) in China. See Fig. 1 for numbering of EFPZs. See Table 1 for driving type of climatic influences on NDVI changes.
| [1] | Chen YH, Li XB, Shi PJ (2001). Variation in NDVI driven by climate factors across china, 1983-1992. Acta Phytoecologica Sinica, 25, 716-720. |
| [陈云浩, 李晓兵, 史培军 (2001). 1983-1992年中国陆地 NDVI变化的气候因子驱动分析. 植物生态学报, 25, 716-720.] | |
| [2] | China’s Third National Assessment Report on Climate Change Editing Committee (2015). The Third National Assessment Report on Climate Change. Science Press, Beijing.192-193. |
| [第三次气候变化国家评估报告编写委员会 (2015). 第三次气候变化国家评估报告. 科学出版社, 北京. 192-193.] | |
| [3] |
Chu H, Venevsky S, Wu C, Wang M (2019). NDVI-based vegetation dynamics and its response to climate changes at Amur-Heilongjiang River Basin from 1982 to 2015. Science of the Total Environment, 650, 2051-2062.
DOI URL |
| [4] | Climate Change Center of China Meteorological Administration (2019). Blue Paper on Climate Change in China. Climate Change Center of China Meteorological Administration, Beijing. 5. |
| [中国气象局气候变化中心 (2019). 中国气候变化蓝皮书. 中国气象局气候变化中心, 北京. 5.] | |
| [5] |
Gong Z, Kawamura K, Ishikawa N, Goto M, Wulan T, Alateng D, Yin T, Ito Y (2015). MODIS normalized difference vegetation index (NDVI) and vegetation phenology dynamics in the Inner Mongolia grassland. Solid Earth, 6, 1185-1194.
DOI URL |
| [6] | Guo J, Hu Y, Xiong Z, Yan X, Ren B, Bu R (2017). Spatiotemporal variations of growing-season NDVI associated with climate change in northeastern Chinaʼs permafrost zone. Polish Journal of Environmental Studies, 26, 1521- 1530. |
| [7] |
Han JC, Huang Y, Zhang H, Wu X (2019). Characterization of elevation and land cover dependent trends of NDVI variations in the Hexi region, northwest China. Journal of Environmental Management, 232, 1037-1048.
DOI URL |
| [8] |
Hou P, Wang Q, Fang Z, Wang CZ, Wei YC (2013). Satellite- based monitoring and appraising vegetation growth in national key regions of ecological protection. Acta Ecologica Sinica, 33, 780-788.
DOI URL |
| [侯鹏, 王桥, 房志, 王昌佐, 魏彦昌 (2013). 国家生态保护重要区域植被长势遥感监测评估. 生态学报, 33, 780-788.] | |
| [9] |
Hou W, Gao J, Wu S, Dai E (2015). Interannual variations in growing-season NDVI and its correlation with climate variables in the southwestern karst region of China. Remote Sensing, 7, 11105-11124.
DOI URL |
| [10] |
Jin J, Wang Y, Jiang H, Cheng M (2016). Recent NDVI-based variation in growth of boreal intact forest landscapes and its correlation with climatic variables. Sustainability, 8(326), 1-10.
DOI URL |
| [11] | Li LL, Wang DW, Han T (2018). Spatial-temporal dynamics of vegetation coverage and responding to climate change in Shiyang River basin during 2000-2015. Journal of Desert Research, 38, 1108-1118. |
| [李丽丽, 王大为, 韩涛 (2018). 2000-2015年石羊河流域植被覆盖度及其对气候变化的响应. 中国沙漠, 38, 1108-1118.] | |
| [12] |
Li S, Yang S, Liu X, Liu Y, Shi M (2015). NDVI-based analysis on the influence of climate change and human activities on vegetation restoration in the Shaanxi-Gansu-Ningxia region, central China. Remote Sensing, 7, 11163-11182.
DOI URL |
| [13] |
Liu X, Tian Z, Zhang A, Zhao A, Liu H (2019). Impacts of climate on spatiotemporal variations in vegetation NDVI from 1982-2015 in Inner Mongolia, China. Sustainability, 11(768), 122.
DOI URL |
| [14] |
Lu YH, Zhang LW, Feng XM, Zeng Y, Fu BJ, Yao XL, Li JR, Wu BF (2015). Recent ecological transitions in China: greening, browning, and influential factors. Scientific Reports, 5, 8732. DOI: 10.1038/srep08732.
DOI URL |
| [15] | Luo M, Guli J, Guo H, Guo H, Guo H, Zhang PF, Meng FH, Liu T (2017). Spatial-temporal variation of growing- season NDVI and its responses to hydrothermal condition in the Tarim river basin from 2000 to 2013. Journal of Natural Resources, 32, 50-63. |
| [罗敏, 古丽•加帕尔, 郭浩, 郭辉, 张鹏飞, 孟凡浩, 刘铁 (2017). 2000-2013年塔里木河流域生长季 NDVI时空变化特征及其影响因素分析. 自然资源学报, 32, 50-63.] | |
| [16] |
Mbatha N, Xulu S (2018). Time series analysis of MODIS- derived NDVI for the Hluhluwe-Imfolozi park, south Africa: impact of recent intense drought. Climate, 6(95), 1-24.
DOI URL |
| [17] | Ministry of Environmental Protection of the Peopleʼs Republic of China, Chinese Academy of Sciences (2008). National Ecological Function Zoning. Ministry of Ecology and Environment of the People’s Republic of China, Beijing. 17. |
| [中华人民共和国生态环境部和中国科学院 (2008). 全国生态功能区划. 中华人民共和国生态环境部, 北京. 17.] | |
| [18] | Ministry of Environmental Protection of the Peopleʼs Republic of China, Chinese Academy of Sciences (2015). National Ecological Function Zoning, Revised Edition. Ministry of Ecology and Environment of the People’s Republic of China, Beijing.8-9. |
| [中华人民共和国生态环境部和中国科学院 (2015). 全国生态功能区划(修编版). 中华人民共和国生态环境部, 北京.8-9.] | |
| [19] | Ning T, Liu W, Lin W, Song X (2015). NDVI variation and its responses to climate change on the northern Loess Plateau of China from 1998 to 2012. Advances in Meteorology,1-10. |
| [20] |
Piedallu C, Cheret V, Denux JP, Perez V, Azcona JS, Seynave I, Gegout JC (2019). Soil and climate differently impact NDVI patterns according to the season and the stand type. Science of the Total Environment, 651, 2874-2885.
DOI |
| [21] | Tian YC, Liang MZ (2016). The NDVI Characteristics of vegetation and its ten-day response to temperature and precipitation in Beibu gulf coastal region. Journal of Natural Resources, 31, 488-502. |
| [田义超, 梁铭忠 (2016). 北部湾沿海地区植被覆盖对气温和降水的旬响应特征. 自然资源学报, 31, 488-502.] | |
| [22] |
Verbyla D (2015). Remote sensing of interannual boreal forest NDVI in relation to climatic conditions in interior Alaska. Environmental Research Letters, 10, 125016. DOI: 10.1088/1748-9326/10/12/125016.
DOI URL |
| [23] | Wang F, Wang Z, Zhang Y (2018). Spatio-temporal variations in vegetation net primary productivity and their driving factors in Anhui Province from 2000 to 2015. Acta Ecologica Sinica, 38, 2754-2767. |
| [王芳, 汪左, 张运 (2018). 2000-2015年安徽省植被净初级生产力时空分布特征及其驱动因素. 生态学报, 38, 2754-2767.] | |
| [24] |
Wang H, Liu D, Lin H, Montenegro A, Zhu X (2015). NDVI and vegetation phenology dynamics under the influence of sunshine duration on the Tibetan Plateau. International Journal of Climatology, 35, 687-698.
DOI URL |
| [25] | Wang JP, Guo ZJ, Cheng F, Zhang QB, Ma H, Yu YL (2017). Spatio-temporal change in precipitation and surface temperature and their relationships with NDVI of different ecological function zones in north Xinjiang. Forest Resources Management, (1), 110-117. |
| [王计平, 郭仲军, 程复, 张启斌, 马欢, 于一雷 (2017). 北疆生态功能区降水气温时空变化及其与 NDVI相关性分析. 林业资源管理, (1), 110-117.] | |
| [26] | Wang L, Jing YS, Li K (2010). Spatio-temporal characteristics of vegetation net primary productivity and climate change effects in Jiangsu province. Ecology and Environmental Sciences, 19, 2529-2533. |
| [王琳, 景元书, 李琨 (2010). 江苏省植被NPP时空特征及气候因素的影响. 生态环境学报, 19, 2529-2533.] | |
| [27] | Wang Q, Zhang TB, Yi GH, Chen TT, Bie XJ, He YX (2017). Tempo-spatial variations and driving factors analysis of net primary productivity in the Hengduan Mountain area from 2004 to 2014. Acta Ecologica Sinica, 37, 3084-3095. |
| [王强, 张廷斌, 易桂花, 陈田田, 别小娟, 何奕萱 (2017). 横断山区2004-2014年植被NPP时空变化及其驱动因子. 生态学报, 37, 3084-3095.] | |
| [28] | Zhao DS, Guo CY, Guo YQ, Liu L, Gao X, Zhang JC, Zhu Y, Zhang XM (2019). Effects of climate change on major ecological projects of mountains-rivers-forests-farmlands- lakes-grasslands. Acta Ecologica Sinica, 39, 8780-8788. |
| [赵东升, 郭彩赟, 郭义强, 刘磊, 高璇, 张家诚, 朱瑜, 张雪梅 (2019). 气候变化对“山水林田湖草”重大生态工程的影响. 生态学报, 39, 8780-8788.] | |
| [29] | Zheng HL, Fang SF, Liu CC, Wu JH, Du JQ (2019). Dynamics of monthly vegetation activity and its responses to climate change in the Qinghai-Tibet Plateau. Journal of Geo- information Science, 21, 201-214. |
|
[郑海亮, 房世峰, 刘成程, 吴金华, 杜加强 (2019). 青藏高原月 NDVI时空动态变化及其对气候变化的响应. 地球信息科学学报, 21, 201-214.]
DOI |
|
| [30] |
Zheng Y, Han J, Huang Y, Fassnacht SR, Xie S, Lv E, Chen M (2018). Vegetation response to climate conditions based on NDVI simulations using stepwise cluster analysis for the Three-River Headwaters region of China. Ecological Indicators, 92, 18-29.
DOI URL |
| [1] | 吴瀚, 白洁, 李均力, 古丽•加帕尔, 包安明. 新疆地区植被覆盖度时空变化及其影响因素分析[J]. 植物生态学报, 2024, 48(1): 41-55. |
| [2] | 冯珊珊, 黄春晖, 唐梦云, 蒋维昕, 白天道. 细叶云南松针叶形态和显微性状地理变异及其环境解释[J]. 植物生态学报, 2023, 47(8): 1116-1130. |
| [3] | 陈雪萍, 赵学勇, 张晶, 王瑞雄, 卢建男. 基于地理探测器的科尔沁沙地植被NDVI时空变化特征及其驱动因素[J]. 植物生态学报, 2023, 47(8): 1082-1093. |
| [4] | 缪丽娟, 张宇阳, 揣小伟, 包刚, 何昱, 朱敬雯. 亚洲旱区草地NDVI对气候变化的响应及滞后效应[J]. 植物生态学报, 2023, 47(10): 1375-1385. |
| [5] | 朱玉英, 张华敏, 丁明军, 余紫萍. 青藏高原植被绿度变化及其对干湿变化的响应[J]. 植物生态学报, 2023, 47(1): 51-64. |
| [6] | 牟文博, 徐当会, 王谢军, 敬文茂, 张瑞英, 顾玉玲, 姚广前, 祁世华, 张龙, 苟亚飞. 排露沟流域不同海拔灌丛土壤碳氮磷化学计量特征[J]. 植物生态学报, 2022, 46(11): 1422-1431. |
| [7] | 刘宁, 彭守璋, 陈云明. 气候因子对青藏高原植被生长的时间效应[J]. 植物生态学报, 2022, 46(1): 18-26. |
| [8] | 张央, 安明态, 武建勇, 刘锋, 汪伟. 中国兜兰属宽瓣亚属植物地理分布格局及其主导气候因子[J]. 植物生态学报, 2022, 46(1): 40-50. |
| [9] | 倪铭, 张曦月, 姜超, 王鹤松. 中国西南部地区植被对极端气候事件的响应[J]. 植物生态学报, 2021, 45(6): 626-640. |
| [10] | 汲玉河, 周广胜, 王树东, 王丽霞, 周梦子. 2000-2019年秦岭地区植被生态质量演变特征及 驱动力分析[J]. 植物生态学报, 2021, 45(6): 617-625. |
| [11] | 陈哲, 汪浩, 王金洲, 石慧瑾, 刘慧颖, 贺金生. 基于物候相机归一化植被指数估算高寒草地植物地上生物量的季节动态[J]. 植物生态学报, 2021, 45(5): 487-495. |
| [12] | 周明星, 李登秋, 邹建军. 基于稠密Landsat数据的邛崃山大熊猫栖息地植被变化研究[J]. 植物生态学报, 2021, 45(4): 355-369. |
| [13] | 吴建波, 王小丹. 高寒草原优势种紫花针茅叶片解剖结构对青藏高原高寒干旱环境适应性分析[J]. 植物生态学报, 2021, 45(3): 265-273. |
| [14] | 王兆鹏, 张同文, 袁玉江, 张瑞波, 喻树龙, 刘蕊, 石仁娜•加汗, 郭冬, 王勇辉. 罗霄山南部4个针叶树种生长特征及其气候响应对比分析[J]. 植物生态学报, 2021, 45(12): 1303-1313. |
| [15] | 张文强, 罗格平, 郑宏伟, 王浩, HAMDI Rafiq, 何惠丽, 蔡鹏, 陈春波. 基于随机森林模型的内陆干旱区植被指数变化与驱动力分析: 以北天山北坡中段为例[J]. 植物生态学报, 2020, 44(11): 1113-1126. |
| 阅读次数 | ||||||
|
全文 |
|
|||||
|
摘要 |
|
|||||
Copyright © 2026 版权所有 《植物生态学报》编辑部
地址: 北京香山南辛村20号, 邮编: 100093
Tel.: 010-62836134, 62836138; Fax: 010-82599431; E-mail: apes@ibcas.ac.cn, cjpe@ibcas.ac.cn
备案号: 京ICP备16067583号-19
![]()