
植物生态学报 ›› 2022, Vol. 46 ›› Issue (4): 484-492.DOI: 10.17521/cjpe.2021.0360 cstr: 32100.14.cjpe.2021.0360
所属专题: 全球变化与生态系统; 青藏高原植物生态学:植被生态学; 青藏高原植物生态学:数据论文; 数据论文
• 数据论文 • 上一篇
胡潇飞1, 魏临风1, 程琦1, 吴星麒1, 倪健1,2,*( )(
)( )
)
收稿日期:2021-10-11
接受日期:2021-12-02
出版日期:2022-04-20
发布日期:2021-12-16
作者简介:*(nijian@zjnu.edu.cn) ORCID: 倪健: 0000-0001-5411-7050基金资助:
HU Xiao-Fei1, WEI Lin-Feng1, CHENG Qi1, WU Xing-Qi1, NI Jian1,2,*()()
Received:2021-10-11
Accepted:2021-12-02
Online:2022-04-20
Published:2021-12-16
摘要:
气候图解可以直观反映气象台站基本信息和气温、降水等气象数据, 是研究植被与气候关系的有效方式。为便于了解青藏高原不同植被区域气候特征, 进一步认识青藏高原植被与气候关系, 该文基于1951-1980年与1981-2010年青藏高原地区国家地面气象台站基本信息和各30年平均观测数据, 依据《中国植被》所述标准制作每个气象台站的气候图解。论文提供了青藏高原地区主要台站气候图解集, 包括两个30年时间段共计205幅图解。研究表明: (1)青藏高原地区气温和降水总体水平偏低, 前后30年年平均气温和年降水量整体呈上升趋势; (2)青藏高原地区各气象台站记录值随植被区域不同表现出较大差异。虽然青藏高原西部地区的气象台站数量很少, 但该数据集仍涵盖了高原面上的不同植被地带, 可有效运用于高原植被与气候关系研究, 为展示高原气候环境等提供便利。
胡潇飞, 魏临风, 程琦, 吴星麒, 倪健. 青藏高原地区气候图解数据集. 植物生态学报, 2022, 46(4): 484-492. DOI: 10.17521/cjpe.2021.0360
HU Xiao-Fei, WEI Lin-Feng, CHENG Qi, WU Xing-Qi, NI Jian. A climate diagram atlas of Qingzang Plateau. Chinese Journal of Plant Ecology, 2022, 46(4): 484-492. DOI: 10.17521/cjpe.2021.0360

图1 青藏高原地区气象台站分布。A, 1951-1980年。B, 1981-2010年。C, 植被区划图。D, 1951-2010年台站数量变化。III, 暖温带落叶阔叶林区域; IIIii, 暖温带南部落叶栎林地带; IV, 亚热带常绿阔叶林区域; IVAi, 北亚热带常绿、落叶阔叶混交林地带; IVAii, 中亚热带常绿阔叶林地带; IVBi, 中亚热带常绿阔叶林地带; IVBiii, 亚热带山地寒温性针叶林地带; V, 热带季雨林、雨林区域; VBi, 北热带季节雨林、半常绿季雨林地带; VI, 温带草原区域; VIAii, 温带南部草原地带; VII, 温带荒漠区域; VIIBi, 温带半灌木、灌木荒漠地带; VIIBii, 暖温带灌木、半灌木荒漠地带; VIII, 青藏高原高寒植被区域; VIIIAi, 高寒灌丛、高寒草甸地带; VIIIAii, 高寒草甸地带; VIIIBi, 高寒草原地带; VIIIBii, 温性草原地带; VIIICi, 高寒荒漠地带; VIIICii, 温性荒漠地带。植被区划图依据《中国植被图集(1:1 000 000)》(中国科学院中国植被图编辑委员会, 2001)绘制。
Fig. 1 Spatial distribution of weather stations on the Qingzang Plateau. A, 1951-1980. B, 1981-2010. C, Vegetation regionalization map. D, Temporal change of the number of stations. III, warm-temperate deciduous broadleaf forest region; IIIii, southern warm-temperate deciduous Quercus forest zone; IV, subtropical broadleaf evergreen forest region; IVAi, northern subtropical broadleaf evergreen and deciduous forest zone; IVAii, middle subtropical broadleaf evergreen forest zone; IVBi, middle subtropical broadleaf evergreen forest zone; IVBiii, subtropical mountains cold-temperate needleleaf forest zone; V, tropical monsoon rain forest and rain forest region; VBi, northern tropical seasonal rain forest, semi-evergreen monsoon rain forest zone; VI, temperate steppe region; VIAii, southern temperate steppe zone; VII, temperate desert region; VIIBi, temperate semi-shrubby and shrubby desert zone; VIIBii, warm-temperate shrubby and semi-shrubby desert zone; VIII, Qingzang Plateau alpine vegetation region; VIIIAi, subalpine scrub and alpine meadow zone; VIIIAii, alpine meadow zone; VIIIBi, alpine steppe zone; VIIIBii, temperate steppe zone; VIIICi, alpine desert zone; VIIICii, temperate desert zone. Vegetation regionalization map was drew based on Vegetation Atlas of China (1:1 000 000) (The Editorial Committee of Vegetation Map of China, Chinese Academy of Sciences, 2001).
| 气候指标 Climate variable | 年 Years | 平均数±标准差 Mean ± SD | 最大值 Maximum | 最小值 Minimum |
|---|---|---|---|---|
| 年平均气温 Mean annual air temperature (℃) | 1951-1980 | 3.0 ± 4.2 | 14.7 | -5.6 |
| 1981-2010 | 5.3 ± 4.7 | 17.0 | -5.0 | |
| 年降水量 Mean annual precipitation (mm) | 1951-1980 | 469.9 ± 235.2 | 1 667.6 | 17.6 |
| 1981-2010 | 528.5 ± 250.9 | 1 778.5 | 15.5 |
表1 青藏高原地区气温和降水变化
Table 1 Changes of temperature and precipitation on the Qingzang Plateau
| 气候指标 Climate variable | 年 Years | 平均数±标准差 Mean ± SD | 最大值 Maximum | 最小值 Minimum |
|---|---|---|---|---|
| 年平均气温 Mean annual air temperature (℃) | 1951-1980 | 3.0 ± 4.2 | 14.7 | -5.6 |
| 1981-2010 | 5.3 ± 4.7 | 17.0 | -5.0 | |
| 年降水量 Mean annual precipitation (mm) | 1951-1980 | 469.9 ± 235.2 | 1 667.6 | 17.6 |
| 1981-2010 | 528.5 ± 250.9 | 1 778.5 | 15.5 |
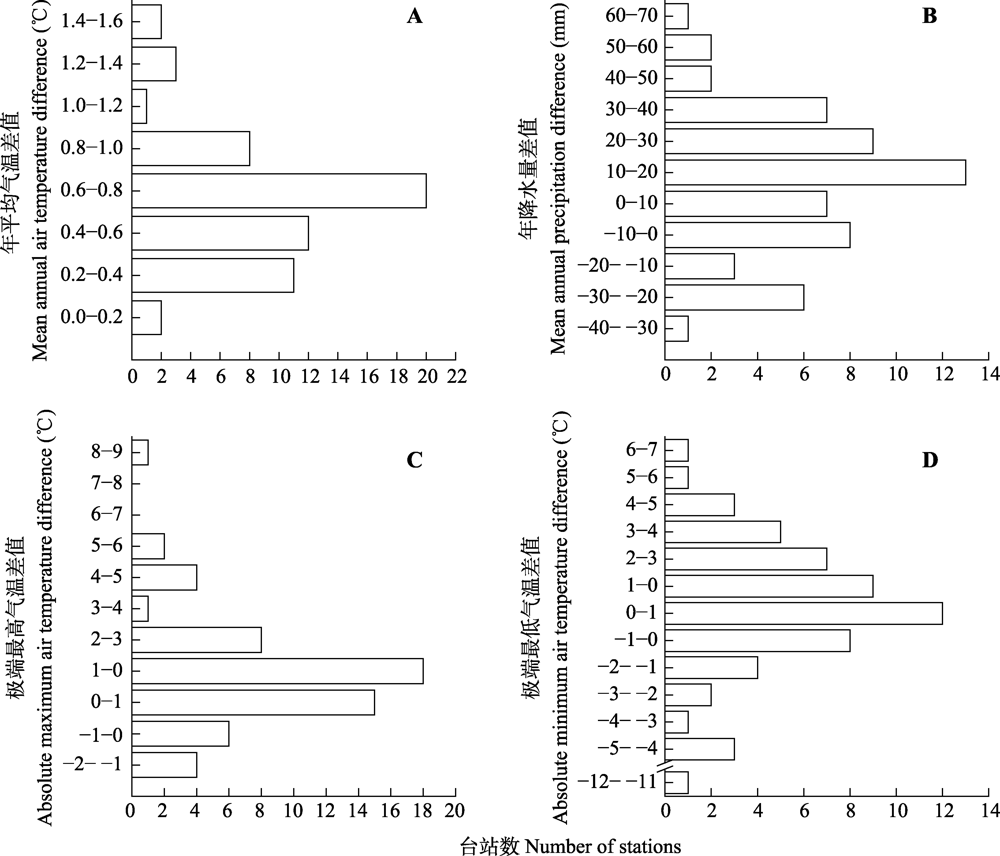
图2 1951-1980年和1981-2010年地理位置一致台站的气候指标差值。
Fig. 2 Differences of climatic variables in stations with the same location during 1951-1980 and 1981-2010.
| 气候指标 Climate variable | 年份 Years | 植被区域 Vegetation region | |||||
|---|---|---|---|---|---|---|---|
| III | IV | V | VI | VII | VIII | ||
| T (℃) | 1951-1980 | 3.2 | 7.0 | 3.7 | 4.2 | 1.6 | 0.4 |
| 1981-2010 | 4.1 | 8.9 | 8.0 | 6.2 | 3.3 | 1.3 | |
| T1 (℃) | 1951-1980 | -9.0 | -2.3 | -4.7 | -9.7 | -12.7 | -11.1 |
| 1981-2010 | -7.7 | -0.3 | 0.8 | -7.0 | -10.5 | -10.0 | |
| T7 (℃) | 1951-1980 | 13.7 | 15.0 | 11.2 | 15.6 | 14.2 | 10.6 |
| 1981-2010 | 14.3 | 16.8 | 14.9 | 17.4 | 15.8 | 11.4 | |
| Tmax (℃) | 1951-1980 | 32.0 | 36.7 | 31.9 | 35.1 | 35.5 | 32.0 |
| 1981-2010 | 35.0 | 39.0 | 32.6 | 40.3 | 36.4 | 33.7 | |
| Tmin (℃) | 1951-1980 | -28.5 | -33.7 | -33.2 | -34.1 | -39.6 | -48.1 |
| 1981-2010 | -27.9 | -30.6 | -19.1 | -31.9 | -32.0 | -45.2 | |
| P (mm) | 1951-1980 | 487.1 | 701.3 | 550.3 | 407.8 | 202.0 | 435.2 |
| 1981-2010 | 503.5 | 677.9 | 723.3 | 388.0 | 169.5 | 452.6 | |
| Ntmin < 0 | 1951-1980 | 5.3 | 5.2 | 6.0 | 6.3 | 7.4 | 8.0 |
| 1981-2010 | 6.2 | 4.2 | 4.0 | 5.5 | 6.9 | 7.7 | |
表2 青藏高原各植被区域气候特征
Table 2 Characteristics of climate in different vegetation regions on the Qingzang Plateau
| 气候指标 Climate variable | 年份 Years | 植被区域 Vegetation region | |||||
|---|---|---|---|---|---|---|---|
| III | IV | V | VI | VII | VIII | ||
| T (℃) | 1951-1980 | 3.2 | 7.0 | 3.7 | 4.2 | 1.6 | 0.4 |
| 1981-2010 | 4.1 | 8.9 | 8.0 | 6.2 | 3.3 | 1.3 | |
| T1 (℃) | 1951-1980 | -9.0 | -2.3 | -4.7 | -9.7 | -12.7 | -11.1 |
| 1981-2010 | -7.7 | -0.3 | 0.8 | -7.0 | -10.5 | -10.0 | |
| T7 (℃) | 1951-1980 | 13.7 | 15.0 | 11.2 | 15.6 | 14.2 | 10.6 |
| 1981-2010 | 14.3 | 16.8 | 14.9 | 17.4 | 15.8 | 11.4 | |
| Tmax (℃) | 1951-1980 | 32.0 | 36.7 | 31.9 | 35.1 | 35.5 | 32.0 |
| 1981-2010 | 35.0 | 39.0 | 32.6 | 40.3 | 36.4 | 33.7 | |
| Tmin (℃) | 1951-1980 | -28.5 | -33.7 | -33.2 | -34.1 | -39.6 | -48.1 |
| 1981-2010 | -27.9 | -30.6 | -19.1 | -31.9 | -32.0 | -45.2 | |
| P (mm) | 1951-1980 | 487.1 | 701.3 | 550.3 | 407.8 | 202.0 | 435.2 |
| 1981-2010 | 503.5 | 677.9 | 723.3 | 388.0 | 169.5 | 452.6 | |
| Ntmin < 0 | 1951-1980 | 5.3 | 5.2 | 6.0 | 6.3 | 7.4 | 8.0 |
| 1981-2010 | 6.2 | 4.2 | 4.0 | 5.5 | 6.9 | 7.7 | |
| [1] |
Afshar FA, Ayoubi S, Jafari A (2018). The extrapolation of soil great groups using multinomial logistic regression at regional scale in arid regions of Iran. Geoderma, 315, 36-48.
DOI URL |
| [2] | Breckle SW (2002). Walter’s Vegetation of the Earth. 4th ed. Springer-Verlag, Berlin. 22-23. |
| [3] | Chen LX, Zhou XJ, Li WL, Luo YF, Zhu WQ (2004). Characteristics of the climate change and its formation mechanism in China in last 80 years. Acta Meteorologica Sinica, 62, 634-646. |
| [ 陈隆勋, 周秀骥, 李维亮, 罗云峰, 朱文琴 (2004). 中国近80年来气候变化特征及其形成机制. 气象学报, 62, 634-646.] | |
| [4] | Gaussen H (1954). Geography of Plants. Armand Colin, Paris. 224. |
| [5] |
Li BY (2020). Data Set of Climatic Elements in Hoh Xil Area, Qinghai Province (1990). National Tibetan Plateau Data Center. [2020-09-04]. http://data.tpdc.ac.cn/zh-hans/data/b9c3c223-f5ab-4b53-be44-71fc9f4692e0/. DOI: 10.11888/Meteoro.tpdc.271026.
DOI URL |
|
李炳元 (2020). 青海可可西里地区气候要素数据集 (1990). 国家青藏高原科学数据中心. [2020-09-04]. http://data.tpdc.ac.cn/zh-hans/data/b9c3c223-f5ab-4b53-be44-71fc9f4692e0/. DOI: 10.11888/Meteoro.tpdc.271026.]
DOI URL |
|
| [6] | The Central Meteorological Administration Information Office (1984). The Dataset for Climate of China’s Mainland. Meteorological Press, Beijing. |
| [中央气象局资料室 (1984). 中国地面气候资料集. 气象出版社, 北京.] | |
| [7] | The Comprehensive Scientific Expedition to the Hoh Xil Region (1996). Physical Environment of Hoh Xil Region, Qinghai. Science Press, Beijing. |
| [可可西里综合科学考察队 (1996). 青海可可西里地区自然环境. 科学出版社, 北京.] | |
| [8] | The Editorial Committee of Dictionary of Atmospheric Sciences (1994). Dictionary of Atmospheric Sciences. Meteorological Press, Beijing. 104, 457, 464. |
| [大气科学辞典编委会 (1994). 大气科学辞典. 气象出版社, 北京. 104, 457, 464.] | |
| [9] | The Editorial Committee of List of Nationwide Weather Stations (1998). List of Nationwide Weather Stations. Meteorological Press, Beijing. |
| [全国气象局台站名录编委会 (1998). 全国气象局台站名录. 气象出版社, 北京.] | |
| [10] | The Editorial Committee of Vegetation Map of China, Chinese Academy of Sciences (2001). Vegetation Atlas of China (1:1 000 000). Science Press, Beijing. |
| [中国科学院中国植被图编辑委员会 (2001). 中国植被图集(1:1 000 000). 科学出版社, 北京.] | |
| [11] | The Editorial Committee of Vegetation of China (1980). Vegetation of China. Science Press, Beijing. 34-49. |
| [中国植被编辑委员会 (1980). 中国植被. 科学出版社, 北京. 34-49.] | |
| [12] | Walter H (1985). Vegetation of the Earth and Ecological Systems of the Geo-biosphere. 3rd ed. Springer-Verlag, Berlin, New York. 25. |
| [13] | Walter H, Lieth H (1960). World Atlas of Climate Diagrams. VEB Gustav Fischer Verlag, Jena. |
| [14] |
Zepner L, Karrasch P, Wiemann F, Bernard L (2021). ClimateCharts.net—An interactive climate analysis web platform. International Journal of Digital Earth, 14, 338-356.
DOI URL |
| [1] | 张安宁, 肖亚宁, 赵霞, 张淼, 崔瀚文, 陈书燕, 安黎哲. 青藏高原灌木化与氮添加对土壤线虫及功能性状的交互作用[J]. 植物生态学报, 2026, 50(预发表): 0-. |
| [2] | 张琳, 袁伟影, 宋创业, 吴冬秀. 1998-2010年中国典型生态系统长期监测样地环境要素、物种丰富度和生物量动态数据集[J]. 植物生态学报, 2025, 49(8): 1182-1190. |
| [3] | 范亚冉, 夏少攀, 于冰冰, 朱紫琪, 杨威, 范豫川, 刘晓雨, 张旭辉, 郑聚锋. 大气CO2浓度升高和增温对土壤有机碳库积累、分子组成和结构稳定性的影响[J]. 植物生态学报, 2025, 49(7): 1053-1069. |
| [4] | 陈龙, 郭柯, 勾晓华, 赵秀海, 马泓若. 祁连圆柏林群落组成及特征[J]. 植物生态学报, 2025, 49(6): 852-864. |
| [5] | 王世松, 曲孝云, 董劭琼, 李佳鸿, 杨琦, 侯满福, 赵利清, 郭柯, 刘长成, 胥晓. 西藏札达典型荒漠植被类型及群落特征[J]. 植物生态学报, 2025, 49(5): 801-812. |
| [6] | 王娟, 张登山, 肖元明, 裴全帮, 王博, 樊博, 周国英. 长期围封后高寒草原植物根系分泌物特征与环境因子关系[J]. 植物生态学报, 2025, 49(4): 596-609. |
| [7] | 王堃莹, 邱贵福, 刘子赫, 孟君, 刘宇轩, 贾国栋. 气候变化对不同退化程度小叶杨林分生长和内在水分利用效率的调节[J]. 植物生态学报, 2025, 49(2): 343-355. |
| [8] | 黄美红, 牛梦秋, 杨鹏飞, 林洁, 廖周瑜, 陈建国, 向建英. 不同温度和埋藏深度对高山垫状植物山生福禄草种子出苗及幼苗生长的影响[J]. 植物生态学报, 2025, 49(12): 2092-2104. |
| [9] | 贺艺, 周静, 陈宸, 房庭舟, 苏剑, 高浩杰, 曹嘉浩, 杨飞宇, 范淇博, 朱乐瑶, 陈薏名, 杨飞, 王毅腾, 冯雷, 刘飞, 梁爽, 蒋明凯, 陈军, 赵云鹏, 陈伟乐, 赵颖, 黄建国. 浙江海岛濒危树种的保护与恢复[J]. 植物生态学报, 2025, 49(10): 1583-1599. |
| [10] | 陈诚智, 高钰森, 罗力嘉, 王东. 川西高寒窄叶鲜卑花灌丛凋落枝和凋落叶生产与分解[J]. 植物生态学报, 2025, 49(10): 1733-1743. |
| [11] | 王麟, 李雪, 王愉, 王新, 胡小文, 杨梅, 朱剑霄. 不同配方种衣剂对高寒草地乡土草种种子生长与建植的影响[J]. 植物生态学报, 2025, 49(1): 118-128. |
| [12] | 王雯莹, 肖元明, 王小赟, 徐嘉昕, 马玉花, 李强峰, 周国英. 多功能群物种配置模式下退化高寒草甸植物多样性与生态系统多功能性的关联[J]. 植物生态学报, 2025, 49(1): 103-117. |
| [13] | 张辉, 赵赟鹏, 刘晓琛, 郭增鹏, 胡国瑞, 冯彦皓, 马妙君. 高寒草甸退化过程中土壤种子库的变化及其在植物群落更新中的潜在作用[J]. 植物生态学报, 2025, 49(1): 74-82. |
| [14] | 张鹏, 焦亮, 薛儒鸿, 魏梦圆, 杜达石, 吴璇, 王旭鸽, 李倩. 干旱强度影响祁连山西段不同海拔青海云杉的生长恢复[J]. 植物生态学报, 2024, 48(8): 977-987. |
| [15] | 史倩, 同小娟, 许玲玲, 孟平, 于裴洋, 李俊, 杨铭鑫. 油松早晚材径向生长对气候因子的响应[J]. 植物生态学报, 2024, 48(8): 988-1000. |
| 阅读次数 | ||||||
|
全文 |
|
|||||
|
摘要 |
|
|||||
Copyright © 2026 版权所有 《植物生态学报》编辑部
地址: 北京香山南辛村20号, 邮编: 100093
Tel.: 010-62836134, 62836138; Fax: 010-82599431; E-mail: apes@ibcas.ac.cn, cjpe@ibcas.ac.cn
备案号: 京ICP备16067583号-19
![]()