
Chin J Plant Ecol ›› 2007, Vol. 31 ›› Issue (1): 23-31.DOI: 10.17521/cjpe.2007.0004 cstr: 32100.14.cjpe.2007.0004
• Research Articles • Previous Articles Next Articles
LI Su-Ying( ), LI Xiao-Bing(), YING Ge, FU Na
Received:2006-05-09
Accepted:2006-08-28
Online:2007-05-09
Published:2007-01-30
Contact:
LI Xiao-Bing
About author:First author contact:E-mail of the first author: lisuying@ires.cn
LI Su-Ying, LI Xiao-Bing, YING Ge, FU Na. VEGETATION INDEXES-BIOMASS MODELS FOR TYPICAL SEMI-ARID STEPPE—A CASE STUDY FOR XILINHOT IN NORTHERN CHINA[J]. Chin J Plant Ecol, 2007, 31(1): 23-31.
Add to citation manager EndNote|Ris|BibTeX
URL: https://www.plant-ecology.com/EN/10.17521/cjpe.2007.0004
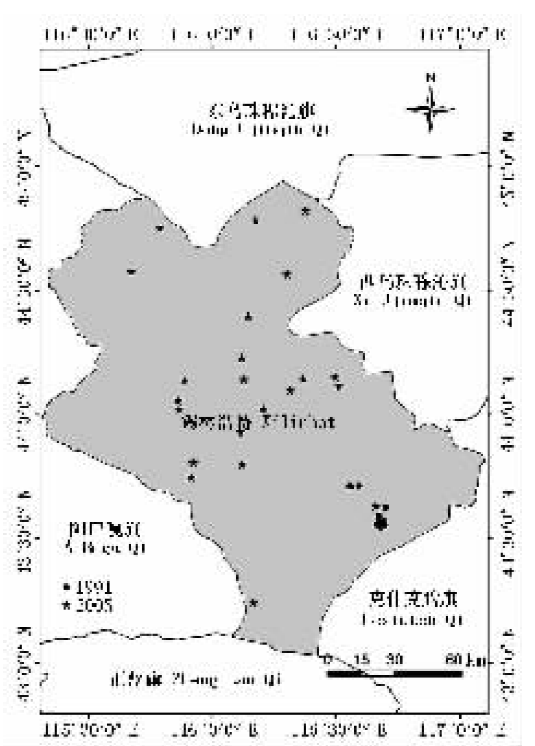
Fig.1 The map of research plot in typical steppe of Inner Mongolia
| 中文名称 Chinese name | 英文缩写 English abbreviation | 计算公式 Formula | 作者(年代) Author(year) | |||||||||||||
|---|---|---|---|---|---|---|---|---|---|---|---|---|---|---|---|---|
| 比值植被指数 Ratio vegetation index | RVI | R/NIR | Pearson et al., 1972 | |||||||||||||
| 归一化差异植被指数 Normalized difference vegetation index | NDVI | (NIR-R)/(NIR+R) | Rouse et al., | |||||||||||||
| 土壤调节植被指数 Soil-adjusted vegetation index | SAVI | | Huete, | |||||||||||||
| 修改型土壤调整植被指数 Modified soil-adjusted vegetation index | MSAVI | | Qi et al., | |||||||||||||
| 简化比率指数 Reduced simple ratio | RSR | | Brown et al., | |||||||||||||
Table 1 The vegetation index
| 中文名称 Chinese name | 英文缩写 English abbreviation | 计算公式 Formula | 作者(年代) Author(year) | |||||||||||||
|---|---|---|---|---|---|---|---|---|---|---|---|---|---|---|---|---|
| 比值植被指数 Ratio vegetation index | RVI | R/NIR | Pearson et al., 1972 | |||||||||||||
| 归一化差异植被指数 Normalized difference vegetation index | NDVI | (NIR-R)/(NIR+R) | Rouse et al., | |||||||||||||
| 土壤调节植被指数 Soil-adjusted vegetation index | SAVI | | Huete, | |||||||||||||
| 修改型土壤调整植被指数 Modified soil-adjusted vegetation index | MSAVI | | Qi et al., | |||||||||||||
| 简化比率指数 Reduced simple ratio | RSR | | Brown et al., | |||||||||||||
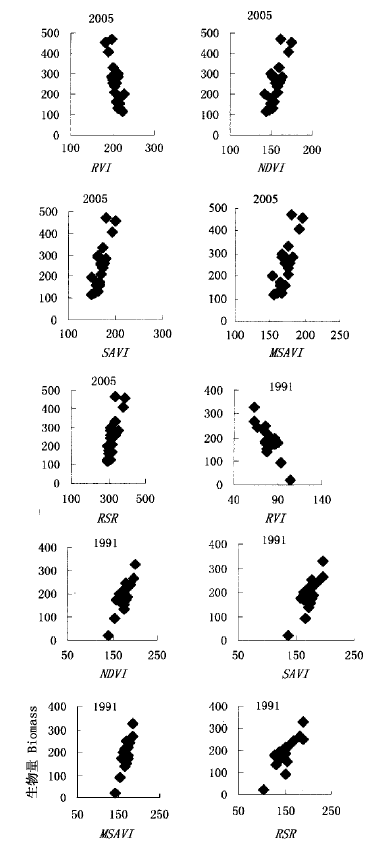
Fig.2 The scatter map between the vegetation biomass and the vegetation index of TM
| 生物量 Biomass | 比值植被指数 RVI | 归一化差异 植被指数 NDVI | 土壤调节 植被指数 SAVI | 修改型土壤调 整植被指数 MSAVI | 简化比率植 被指数 RSR | |
|---|---|---|---|---|---|---|
| 生物量Biomass | 1 | -0.786** | 0.797** | 0.788** | 0.787** | 0.782** |
| 比值植被指数RVI | 1 | -0.997** | -0.994** | -1.000** | -0.938** | |
| 归一化差异植被指数NDVI | 1 | 0.996** | 0.998** | 0.951** | ||
| 土壤调节植被指数SAVI | 1 | 0.994** | 0.945** | |||
| 修改型土壤调整植被指数MSAVI | 1 | 0.939** | ||||
| 简化比率植被指数RSR | 1 |
Table 2 Correlations between biomass and vegetation index
| 生物量 Biomass | 比值植被指数 RVI | 归一化差异 植被指数 NDVI | 土壤调节 植被指数 SAVI | 修改型土壤调 整植被指数 MSAVI | 简化比率植 被指数 RSR | |
|---|---|---|---|---|---|---|
| 生物量Biomass | 1 | -0.786** | 0.797** | 0.788** | 0.787** | 0.782** |
| 比值植被指数RVI | 1 | -0.997** | -0.994** | -1.000** | -0.938** | |
| 归一化差异植被指数NDVI | 1 | 0.996** | 0.998** | 0.951** | ||
| 土壤调节植被指数SAVI | 1 | 0.994** | 0.945** | |||
| 修改型土壤调整植被指数MSAVI | 1 | 0.939** | ||||
| 简化比率植被指数RSR | 1 |
| 年 Year | 植被指数 VI | 模型类型 Model types | 模型 Model | 复相关系数 Multiple correlation coefficient |
|---|---|---|---|---|
| 2005 (n=22) | RVI | 线性 Linear model | y=-7.565x+1 829.100 | R2=0.617 |
| 对数 Logarithm model | y=-1 565.600ln(x)+8 610.100 | R2=0.624 | ||
| 二次多项式Second-degree polynomial model | y=0.090x2-44.561x+5 639.400 | R2=0.636 | ||
| 三次多项式Cubic polynomial model | y=0.007x3-4.120x2+820.270x-53 430.000 | R2=0.649 | ||
| NDVI | 线性 Linear model | y=10.022x-1 308.000 | R2=0.636 | |
| 对数 Logarithm model | y=1 575.100ln(x)-7 696.800 | R2=0.631 | ||
| 二次多项式Second-degree polynomial model | y=0.081x2-15.622x+716.520 | R2=0.641 | ||
| 三次多项式Cubic polynomial model | y=-0.016x3+7.450x2-1 182.000x+62 109.000 | R2=0.654 | ||
| SAVI | 线性 Linear model | y=6.708x-885.270 | R2=0.621 | |
| 对数 Logarithm model | y=1 147.500ln(x)-5 635.900 | R2=0.612 | ||
| 二次多项式Second-degree polynomial model | y=0.043x2-8.245x+404.440 | R2=0.629 | ||
| 三次多项式Cubic polynomial model | y=-0.005x3 +2.681x2-464.400x+26 579.000 | R2=0.644 | ||
| MSAVI | 线性 Linear model | y=7.584x-1 055.2 | R2=0.619 | |
| 对数 Logarithm model | y=1 305.800ln(x)-6 470.100 | R2=0.609 | ||
| 二次多项式Second-degree polynomial model | y =0.089x2-23.343x+1 632.400 | R2=0.637 | ||
| 三次多项式Cubic polynomial model | y=-0.007x3+3.691x2-651.320x+37 995.000 | R2=0.650 | ||
| RSR | 线性 Linear model | y=3.039x-733.520 | R2=0.611 | |
| 对数 Logarithm model | y=1 027.500ln(x)-5 685.700 | R2=0.615 | ||
| 二次多项式Second-degree polynomial model | y=-0.010x2+9.835x-1 876.900 | R2=0.617 | ||
| 三次多项式Cubic polynomial model | y=0.001x3-0.512x2+179.380x-20 874.000 | R2=0.623 | ||
| 1991 (n=18) | RVI | 线性 Linear model | y=-5.593x+631.780 | R2=0.763 |
| 对数 Logarithm model | y=-447.920ln(x)+2 143.500 | R2=0.757 | ||
| 二次多项式Second-degree polynomial model | y=-0.010x2-4.033 1x+568.820 | R2=0.764 | ||
| 三次多项式Cubic polynomial model | y=-0.009x3+2.156x2-181.050x+5 315.200 | R2=0.814 | ||
| NDVI | 线性 Linear model | y=4.033x-515.400 | R2=0.771 | |
| 对数 Logarithm model | y=687.180ln(x)-3 356.500 | R2=0.773 | ||
| 二次多项式Second-degree polynomial model | y=-0.007x2+6.362x-714.010 | R2=0.772 | ||
| 三次多项式Cubic polynomial model | y=0.003x3-1.748x2+301.240x-17 238.000 | R2=0.832 | ||
| SAVI | 线性 Linear model | y=4.115x-520.190 | R2=0.724 | |
| 对数 Logarithm model | y=684.560ln(x)-3 334.000 | R2=0.722 | ||
| 二次多项式Second-degree polynomial model | y=0.002x2+3.582x-475.530 | R2=0.724 | ||
| 三次多项式Cubic polynomial model | y=0.003x3-1.607x2+269.170x-14 959.000 | R2=0.768 | ||
| MSAVI | 线性 Linear model | y=5.563x-745.670 | R2=0.721 | |
| 对数 Logarithm model | y=919.220ln(x)-4 519.500 | R2=0.724 | ||
| 二次多项式Second-degree polynomial model | y=-0.023x2+13.199x-1 375.500 | R2=0.723 | ||
| 三次多项式Cubic polynomial model | y=0.012x3-5.791x2+960.330x-53 029.000 | R2=0.799 | ||
| RSR | 线性 Linear model | y=2.508x-190.730 | R2=0.687 | |
| 对数 Logarithm model | y=376.490ln(x)-1 697.000 | R2=0.699 | ||
| 二次多项式Second-degree polynomial model | y=-0.009x2+5.271x-397.490 | R2=0.695 | ||
| 三次多项式Cubic polynomial model | y=0.001x3-0.550x2+83.298x-4 067.300 | R2=0.757 |
Table 3 Regression model from the vegetation biomass and the vegetation index (VI) of TM image
| 年 Year | 植被指数 VI | 模型类型 Model types | 模型 Model | 复相关系数 Multiple correlation coefficient |
|---|---|---|---|---|
| 2005 (n=22) | RVI | 线性 Linear model | y=-7.565x+1 829.100 | R2=0.617 |
| 对数 Logarithm model | y=-1 565.600ln(x)+8 610.100 | R2=0.624 | ||
| 二次多项式Second-degree polynomial model | y=0.090x2-44.561x+5 639.400 | R2=0.636 | ||
| 三次多项式Cubic polynomial model | y=0.007x3-4.120x2+820.270x-53 430.000 | R2=0.649 | ||
| NDVI | 线性 Linear model | y=10.022x-1 308.000 | R2=0.636 | |
| 对数 Logarithm model | y=1 575.100ln(x)-7 696.800 | R2=0.631 | ||
| 二次多项式Second-degree polynomial model | y=0.081x2-15.622x+716.520 | R2=0.641 | ||
| 三次多项式Cubic polynomial model | y=-0.016x3+7.450x2-1 182.000x+62 109.000 | R2=0.654 | ||
| SAVI | 线性 Linear model | y=6.708x-885.270 | R2=0.621 | |
| 对数 Logarithm model | y=1 147.500ln(x)-5 635.900 | R2=0.612 | ||
| 二次多项式Second-degree polynomial model | y=0.043x2-8.245x+404.440 | R2=0.629 | ||
| 三次多项式Cubic polynomial model | y=-0.005x3 +2.681x2-464.400x+26 579.000 | R2=0.644 | ||
| MSAVI | 线性 Linear model | y=7.584x-1 055.2 | R2=0.619 | |
| 对数 Logarithm model | y=1 305.800ln(x)-6 470.100 | R2=0.609 | ||
| 二次多项式Second-degree polynomial model | y =0.089x2-23.343x+1 632.400 | R2=0.637 | ||
| 三次多项式Cubic polynomial model | y=-0.007x3+3.691x2-651.320x+37 995.000 | R2=0.650 | ||
| RSR | 线性 Linear model | y=3.039x-733.520 | R2=0.611 | |
| 对数 Logarithm model | y=1 027.500ln(x)-5 685.700 | R2=0.615 | ||
| 二次多项式Second-degree polynomial model | y=-0.010x2+9.835x-1 876.900 | R2=0.617 | ||
| 三次多项式Cubic polynomial model | y=0.001x3-0.512x2+179.380x-20 874.000 | R2=0.623 | ||
| 1991 (n=18) | RVI | 线性 Linear model | y=-5.593x+631.780 | R2=0.763 |
| 对数 Logarithm model | y=-447.920ln(x)+2 143.500 | R2=0.757 | ||
| 二次多项式Second-degree polynomial model | y=-0.010x2-4.033 1x+568.820 | R2=0.764 | ||
| 三次多项式Cubic polynomial model | y=-0.009x3+2.156x2-181.050x+5 315.200 | R2=0.814 | ||
| NDVI | 线性 Linear model | y=4.033x-515.400 | R2=0.771 | |
| 对数 Logarithm model | y=687.180ln(x)-3 356.500 | R2=0.773 | ||
| 二次多项式Second-degree polynomial model | y=-0.007x2+6.362x-714.010 | R2=0.772 | ||
| 三次多项式Cubic polynomial model | y=0.003x3-1.748x2+301.240x-17 238.000 | R2=0.832 | ||
| SAVI | 线性 Linear model | y=4.115x-520.190 | R2=0.724 | |
| 对数 Logarithm model | y=684.560ln(x)-3 334.000 | R2=0.722 | ||
| 二次多项式Second-degree polynomial model | y=0.002x2+3.582x-475.530 | R2=0.724 | ||
| 三次多项式Cubic polynomial model | y=0.003x3-1.607x2+269.170x-14 959.000 | R2=0.768 | ||
| MSAVI | 线性 Linear model | y=5.563x-745.670 | R2=0.721 | |
| 对数 Logarithm model | y=919.220ln(x)-4 519.500 | R2=0.724 | ||
| 二次多项式Second-degree polynomial model | y=-0.023x2+13.199x-1 375.500 | R2=0.723 | ||
| 三次多项式Cubic polynomial model | y=0.012x3-5.791x2+960.330x-53 029.000 | R2=0.799 | ||
| RSR | 线性 Linear model | y=2.508x-190.730 | R2=0.687 | |
| 对数 Logarithm model | y=376.490ln(x)-1 697.000 | R2=0.699 | ||
| 二次多项式Second-degree polynomial model | y=-0.009x2+5.271x-397.490 | R2=0.695 | ||
| 三次多项式Cubic polynomial model | y=0.001x3-0.550x2+83.298x-4 067.300 | R2=0.757 |
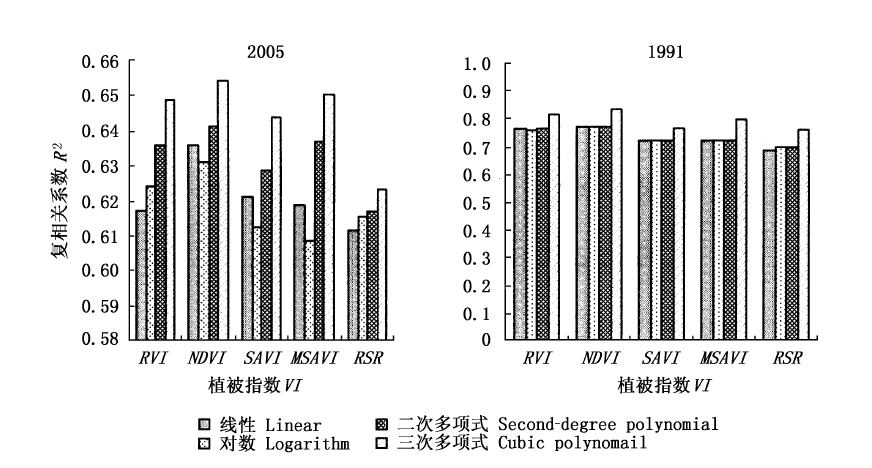
Fig.3 Contrast of correlation parameters of regression model on different vegetation index (VI)
| 实测值 Observation value | 模拟值* Simulation value | 差值(实测值-模拟值) Subtraction (observation value-simulation value) | 百分比(%)(差值/实测值) Percentage (subtraction/observation value) | |
|---|---|---|---|---|
| 1 | 231.73 | 198.10 | 33.63 | 15.14 |
| 2 | 154.43 | 156.30 | -1.87 | -1.21 |
| 3 | 178.80 | 177.30 | 1.50 | 0.84 |
| 4 | 179.60 | 214.20 | -34.59 | -19.26 |
| 5 | 163.65 | 255.00 | -91.35 | -55.82 |
| 6 | 260.00 | 255.00 | 5.00 | 1.92 |
| 7 | 283.00 | 244.30 | 38.80 | 13.71 |
| 8 | 144.27 | 153.40 | -9.13 | -6.33 |
| 9 | 189.07 | 164.10 | 24.97 | 13.21 |
| 10 | 191.23 | 174.30 | 16.93 | 8.85 |
| 11 | 201.47 | 226.20 | -24.73 | -12.28 |
| 12 | 164.67 | 174.60 | -9.93 | -6.03 |
| 13 | 269.90 | 250.10 | 19.80 | 7.34 |
| 14 | 61.33 | 54.60 | 6.73 | 10.98 |
Table 4 Error contrast of the observation value and the simulation value based on the experiential model
| 实测值 Observation value | 模拟值* Simulation value | 差值(实测值-模拟值) Subtraction (observation value-simulation value) | 百分比(%)(差值/实测值) Percentage (subtraction/observation value) | |
|---|---|---|---|---|
| 1 | 231.73 | 198.10 | 33.63 | 15.14 |
| 2 | 154.43 | 156.30 | -1.87 | -1.21 |
| 3 | 178.80 | 177.30 | 1.50 | 0.84 |
| 4 | 179.60 | 214.20 | -34.59 | -19.26 |
| 5 | 163.65 | 255.00 | -91.35 | -55.82 |
| 6 | 260.00 | 255.00 | 5.00 | 1.92 |
| 7 | 283.00 | 244.30 | 38.80 | 13.71 |
| 8 | 144.27 | 153.40 | -9.13 | -6.33 |
| 9 | 189.07 | 164.10 | 24.97 | 13.21 |
| 10 | 191.23 | 174.30 | 16.93 | 8.85 |
| 11 | 201.47 | 226.20 | -24.73 | -12.28 |
| 12 | 164.67 | 174.60 | -9.93 | -6.03 |
| 13 | 269.90 | 250.10 | 19.80 | 7.34 |
| 14 | 61.33 | 54.60 | 6.73 | 10.98 |
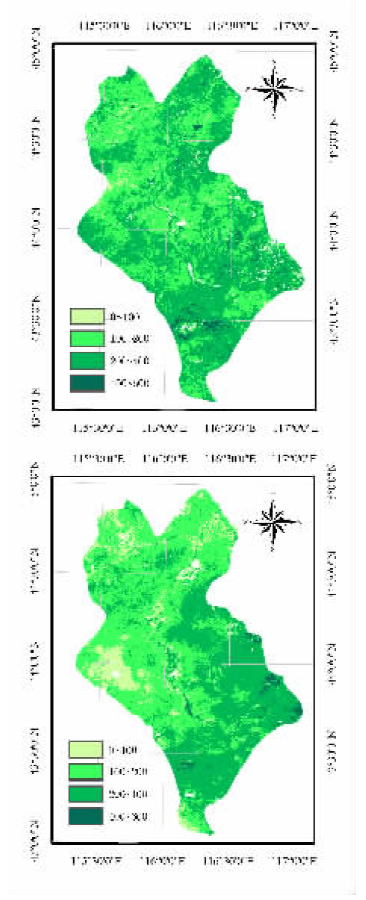
Fig.4 The map of biomass based on NDVI model in Xilinhot
| [1] | Brown L, Chen J, Leblanc S, Cihlar J (2000). A shortwave infrared modification to the simple ratio for LAI retrieval in boreal forests: an image and model analysis . Remote Sensing of Environment, 71,16-25. |
| [2] | Cheng Q (程乾), Huang JF (黄敬峰), Wang RC (王人潮) (2005). Preliminary analysis of difference between MODIS and NOAA/AVHRR vegetation indices. Bulletin of Science and Technology (科技通报), 21,205-209. (in Chinese with English abstract) |
| [3] | Fabio M, Stefano R, Lorenzo B, Gaetano Z (2003). Use of NOAA-AVHRR NDVI images for the estimation of dynamic fire risk in Mediterranean areas. Remote Sensing of Environment, 86,187-197. |
| [4] | Fernando S, Gong P, Manuel F (2005). Land cover assessment with MODIS imagery in southern African Miombo ecosystems. Remote Sensing of Environment, 98,429-441. |
| [5] | Hame T, Salli A, Andersson K (1997). A new methodology for the estimation of biomass of conifer dominated boreal forest using NOAA/AVHRR data. International Journal of Remote Sensing, 18,3211-3243. |
| [6] | Huang JF (黄敬峰), Wang XZ (王秀珍), Hu XB (胡新博) (1999). Studies on grass yield monitoring for different natural grassland types using remote sensing data in northern Xinjiang. Grassland of China (中国草地), (1),7-11. (in Chinese with English abstract) |
| [7] | Huete AR (1988). A soil adjusted vegetation index (SAVI). Remote Sensing of Environment, 25,295-309. |
| [8] | Lefsky MA, Harding D, Cohen WB (1999). Surface lidar remote sensing of basal area and biomass in deciduous forests of eastern Maryland, USA. Remote Sensing of Environment, 67,83-98. |
| [9] | Li J (李净), Wang J (王建) (2004). Estimating plant biomass in Junma Chang of Shandan County using Landsat TM data. Remote Sensing Technology and Application (遥感技术与应用), 19,343-347. (in Chinese with English abstract) |
| [10] | Li JL (李建龙), Jiang P (蒋平), Dai RL (戴若兰) (1998). Advances in study on the remote sensing technology and GPS and GIS integration systems in estimating grassland yield applications in the north of Xinjiang, China. Acta Ecologica Sinica (生态学报), 18,504-510. (in Chinese with English abstract) |
| [11] | Ma XZ (马秀枝), Wang YF (王艳芬), Wang SP (汪诗平), Wang JZ (王金枝), Li CS (李长生) (2005). Impacts of grazing on soil carbon fraction in the grasslands of Xilin River Basin, Inner Mongolia. Acta Phytoecologica Sinina (植物生态学报), 29,569-576. (in Chinese with English abstract) |
| [12] | Michael JH, Peter JV, Peter E, Graham ED (1999). Pasture land cover in eastern Australia from NOAA-AVHRR NDVI and classified Landsat TM. Remote Sensing of Environment, 67,32-50. |
| [13] | Miina R (2005). Retrieval of leaf area index for a coniferous forest by inverting a forest reflectance model. Remote Sensing of Environment, 99,295-303. |
| [14] | Niu ZC (牛志春), Ni SX (倪绍祥) (2003). Study on models for monitoring of grassland biomass around Qinghai Lake assisted by remote sensing. Acta Geographica Sinica (地理学报), 58,695-702. (in Chinese with English abstract) |
| [15] | Pieter SA, Clement A, Kjell AH, Bernt J, Andrew KS (2006). Improved monitoring of vegetation dynamics at very high latitudes: a new method using MODIS NDVI. Remote Sensing of Environment, 100,321-334. |
| [16] | Qi J, Chehbouni A, Huete AR, Kerr Y (1994). A modified soil adjusted vegetation index. Remote Sensing of Environment, 48,119-126. |
| [17] | Rouse JW, Haas RH, Schell JA, Deering DW (1974). Monitoring vegetation systems in the Great Plains with ERTS. In: Freden SC, Becker M eds. Proceedings of Third Earth Resources Technology Satellite—1Symposium. NASA SP-351, Greenbelt,310-317. |
| [18] | Steven MD, Biscoe PV, Jaggard KW (1983). Estimation of sugar beet productivity from reflection in the red and infrared spectral bands. International Journal of Remote Sensing, 4,325-334. |
| [19] | Sun R (孙睿), Zhu QJ (朱启疆) (2000). Distribution and seasonal change of net primary productivity in China from April, 1992 to March, 1993. Acta Geographica Sinica (地理学报), 55,36-45. (in Chinese with English abstract) |
| [20] | Todd SW, Hoffer RM, Milchunas DG (1998). Biomass estimation on grazed and ungrazed rangelands using spectral indices. International Journal Remote Sensing, 19,427-438. |
| [21] | Tong C (仝川), Yong WY (雍伟义), Wu YN (乌云娜), Zhao LQ (赵利清), Jiang C (姜超), Yong SP (雍世鹏) (2001). Change in the spatial structure of grassland vegetation in the Xilin River Basin from 1985 to 1999. Acta Scientiarum Naturalium Universitatis Neimongol (内蒙古大学学报), 32,562-566. (in Chinese with English abstract) |
| [22] | Wang H (王宏), Li XB (李晓兵), Yu HJ (余弘婧) (2006). Monitoring growing season of typical steppe in northern China based on NOAA/AVHRR NDVI data . Journal of Plant Ecology (植物生态学报), 30,365-374. (in Chinese with English abstract) |
| [23] | Wang XZ (王兮之), Du GZ (杜国桢), Liang TG (梁天刚), Dai RL (戴若兰), Wang G (王刚) (2001). The establishment of grassland productive assessment model and the determination of precipitation resource distribution pattern of Gannan Tibetan Autonomous prefecture based on RS and GIS. Acta Prataculturae Sinica (草业学报), 10,95-102. (in Chinese with English abstract) |
| [24] | Wang ZX (王正兴), Liu C (刘闯), Zhao BR (赵冰茹), Liu AJ (刘爱军) (2005). ANPP estimate from MODIS-EVI for the grassland region of Xilingol, China. Journal of Lanzhou University (Natural Sciences) (兰州大学学报(自然科学版)), 41(2),10-16. (in Chinese with English abstract) |
| [25] | Xiao QG (肖乾广), Zhou SS (周嗣松), Chen WY (陈维英), Zhang LX (张丽霞), Lin CG (赁常恭), Xiao SZ (肖淑招), Meng XY (盂宪钺), Zhao ZK (赵忠凯), Zhang GZ (张桂宗) (1986). Productivity estimate using meteorological satellite. Journal of Remote Sensing (遥感学报), 1,37-43. (in Chinese with English abstract) |
| [26] | Yu F (喻锋), Li XB (李晓兵), Wang H (王宏), Yu HJ (余弘婧), Chen JH (陈云浩) (2005). Land cover classification in China based on the NDVI-Ts feature space. Acta Phytoecologica Sinica (植物生态学报), 29,934-944. (in Chinese with English abstract) |
| [27] | Zhao MS, Faith AH, Ramakrishna RN, Steven W (2005). Improvements of the MODIS terrestrial gross and net primary production global data set. Remote Sensing of Environment, 95,164-176. |
| [1] | ZHANG Jing, CHEN Jie, LI Yan-Peng, PAN Li-Jun, XU Han, LI Yi-De, HE Hai-Sheng. Comparison of plant biomass in conifer and broadleaf mixed artificial forests in south subtropical area and analyses of influential factors [J]. Chin J Plant Ecol, 2026, 50(2): 400-416. |
| [2] | XU En-Xiang, ZHOU Lei, ZHANG Xiao-Wei, ZHANG Guo-Ping, ZHONG Du-Wei, HUANG Zhi, LIU Pai, CHI Yong-Gang. Estimation of rice yield based on canopy reflectance spectra and carbon flux in diverse growth phases [J]. Chin J Plant Ecol, 2026, 50(1): 82-93. |
| [3] | LIANG Tian-Hao, WU Fan, HUANG Jin-Xue, JING Chen-Hong, FU He-Jing, YANG Zhi-Jie, XIONG De-Cheng. Effects of soil warming on fine root growth and morphology of Castanopsis kawakamii in mid-subtropical forests [J]. Chin J Plant Ecol, 2026, 50(1): 94-106. |
| [4] | ZHANG Fa-Wei, LI Hong-Qin, ZHU Jing-Bin, FAN Bo, ZHOU Hua-Kun, LI Ying-Nian, LIANG Nai-Shen. Response of aboveground and belowground carbon storage to nitrogen addition and precipitation change in an alpine meadow ecosystem [J]. Chin J Plant Ecol, 2025, 49(9): 1399-1409. |
| [5] | XING Qiang, ZHAO Bin, HU Yong-Hong, YANG Jun, QIN Jun, LIU He-Ming, WANG Hong-Bing, ZHOU Peng. Root trait variation in response to a novel soil substrate in two typical vertical greening plants from the East China [J]. Chin J Plant Ecol, 2025, 49(9): 1498-1514. |
| [6] | SONG Shan-Shan, TANG Zhi-Yao. Relationship between rhizosphere soil fungi and plant aboveground biomass in the meadow steppe of Saihanba, Hebei, China [J]. Chin J Plant Ecol, 2025, 49(9): 1461-1471. |
| [7] | ZHU Rui-De, YANG Jun-Wei, LIU Xiao-Han, CHEN Bing-Rui, CHI Xiu-Lian, TIAN Di, YANG Guang, CHENG Meng, DAI Ya-Feng, WANG Shi-Wen. Nutrient regulation of plant-microbial association in Dendrobium huoshanense facilities and understory cultivation patterns [J]. Chin J Plant Ecol, 2025, 49(9): 1434-1447. |
| [8] | FAN Yue-Ling, JIANG Zheng-De, YE Jia-Shu, ZHENG Li-Chen, CHEN Xin. Dataset on harvest traits and yield of major crops in long-term farmland observation plots in the Lower Liaohe Plain from 2005 to 2015 [J]. Chin J Plant Ecol, 2025, 49(8): 1271-1282. |
| [9] | MA Teng-Fei, HAO Jie, DIAO Hua-Jie, NING Ya-Nan, $\boxed{\hbox{WANG Chang-Hui}}$ , DONG Kuan-Hu. Seasonal variations of soil inorganic nitrogen contents and their responses to changing grazing intensity in grasslands of an agro-pastoral ecotone in northern Shanxi, China [J]. Chin J Plant Ecol, 2025, 49(6): 965-974. |
| [10] | LIU Xin-Yue, WANG Li-Ping, LIU Chun-He, SUN Yan-Li, LIU Peng, TIAN Yun, JIA Xin, ZHA Tian-Shan, QIAN Duo. Spatial pattern of biomass and its influencing factors for plantations with different stand ages in Beijing [J]. Chin J Plant Ecol, 2025, 49(6): 939-951. |
| [11] | CHEN Wen-Yi, WANG Zhi-Yong, ZHOU Meng-Yan, MA Wen-Jun, WANG Jun-Hui, LUO Zhi-Bin, ZHOU Jing. Biomass allocation and allometric growth model of young Catalpa bungei [J]. Chin J Plant Ecol, 2025, 49(2): 356-366. |
| [12] | FANG Kai, WANG Ying-Xin, HUANG Jian-Hui, DUAN Jun-Guang, ZHANG Qi, ZHANG Qian, GAN Hong-Hao, CHU Jian-Min. Deciphering the nutrient factors limiting vegetation restoration under different degradation stages in typical steppe of Nei Mongol, China [J]. Chin J Plant Ecol, 2025, 49(1): 7-18. |
| [13] | HAO Yi-Qing, LIU Wei, YANG Yang, AN Bing-Er, FAN Bing, LI Chao, CUI Jiu-Hui, CHENG Yan-Bin, SUN Jia-Mei, PAN Qing-Min. Effects of organic and inorganic fertilizers on density and individual biomass of Leymus chinensis in degraded grasslands [J]. Chin J Plant Ecol, 2025, 49(1): 148-158. |
| [14] | QIN Jia-Chen, WANG Huan, ZHU Jiang, WANG Yang, TIAN Chen, BAI Yong-Fei, YANG Pei-Zhi, ZHENG Shu-Xia. Grazing filtering effect based on intraspecific and interspecific trait variation and its scale effects [J]. Chin J Plant Ecol, 2024, 48(7): 858-871. |
| [15] | WANG Ge, HU Shu-Ya, LI Yang, CHEN Xiao-Peng, LI Hong-Yu, DONG Kuan-Hu, HE Nian-Peng, WANG Chang-Hui. Temperature sensitivity of soil net nitrogen mineralization rates across different grassland types [J]. Chin J Plant Ecol, 2024, 48(4): 523-533. |
| Viewed | ||||||
|
Full text |
|
|||||
|
Abstract |
|
|||||
Copyright © 2026 Chinese Journal of Plant Ecology
Tel: 010-62836134, 62836138, E-mail: apes@ibcas.ac.cn, cjpe@ibcas.ac.cn
![]()