
植物生态学报 ›› 2011, Vol. 35 ›› Issue (11): 1091-1105.DOI: 10.3724/SP.J.1258.2011.01091
• 研究论文 • 下一篇
张雷1, 刘世荣1,*( ), 孙鹏森1, 王同立2
收稿日期:2010-11-26
接受日期:2011-04-22
出版日期:2011-11-26
发布日期:2011-11-07
通讯作者:
刘世荣
作者简介:*(E-mail:liusr@caf.ac.cn)
ZHANG Lei1, LIU Shi-Rong1,*(), SUN Peng-Sen1, WANG Tong-Li2
Received:2010-11-26
Accepted:2011-04-22
Online:2011-11-26
Published:2011-11-07
Contact:
LIU Shi-Rong
摘要:
物种分布模型被广泛应用于评估气候变化对物种分布的影响。随着计算机和统计学的发展, 模拟物种分布的模型层出不穷, 但对这些模型的相对表现知之甚少, 因此需要对其进行对比分析, 以便更可靠地评估气候变化的影响。该文采用3个比较新颖的组合集成学习(ensemble learning)模型(随机森林(random forest, RF)、广义助推法和NeuralEnsembles)、3个常规模型(广义线性模型、广义加法模型和分类回归树)、3个大气环流模型(global circulation model, GCM) (MIROC32_medres, JP; CCCMA_CGCM3, CA; BCCR-BCM2.0, NW)和一个气体排放情景(SRES_A2), 模拟分析了马尾松(Pinus massoniana)历史基准气候(1961-1990)和未来3个不同时期(2010-2039, 2020s; 2040-2069, 2050s; 2070-2099, 2080s)的潜在分布。基于环境阈值方法选择物种不发生区, 依据ClimateChina软件进行当前和未来气候数据的降尺度处理, 采用接收机工作特征曲线(receiver operator characteristic, ROC)下的面积(area under the curve, AUC)、Kappa值和真实技巧统计法(true skill statistic, TSS)以及马尾松种子区划范围来评价模型的预测精度。结果表明: 6个物种分布模型都具有较高的预测精度, 但组合集成学习模型的预测精度稍高于其他常规模型, 其中RF的预测精度最高。3个GCM和6个模型模拟条件下, 马尾松对气候变化的响应格局既有一致性也有异同性。一致性表现在: 随着时间的推移, 马尾松分布区将逐渐向北迁移, 未来潜在分布区的面积将逐渐增加; 异同性表现在: 在不同模型和不同气候情景下, 马尾松潜在分布区的迁移距离和面积变化幅度不同, 其中NW模式下预测的变化幅度小于CA和JP模式; RF模型预测的分布区迁移距离和面积变化幅度最大。随着时间的推移, 未来马尾松的18个潜在分布空间预测图(6个模型 × 3 GCM)之间的差异也逐渐增大, 其中空间不一致性地区主要集中发生在马尾松潜在分布区的北部和西部边缘地带。模型本身不同的构建原理以及GCM之间的差异是导致预测结果存在差异的主要原因。
张雷, 刘世荣, 孙鹏森, 王同立. 气候变化对马尾松潜在分布影响预估的多模型比较. 植物生态学报, 2011, 35(11): 1091-1105. DOI: 10.3724/SP.J.1258.2011.01091
ZHANG Lei, LIU Shi-Rong, SUN Peng-Sen, WANG Tong-Li. Comparative evaluation of multiple models of the effects of climate change on the potential distribution of Pinus massoniana. Chinese Journal of Plant Ecology, 2011, 35(11): 1091-1105. DOI: 10.3724/SP.J.1258.2011.01091
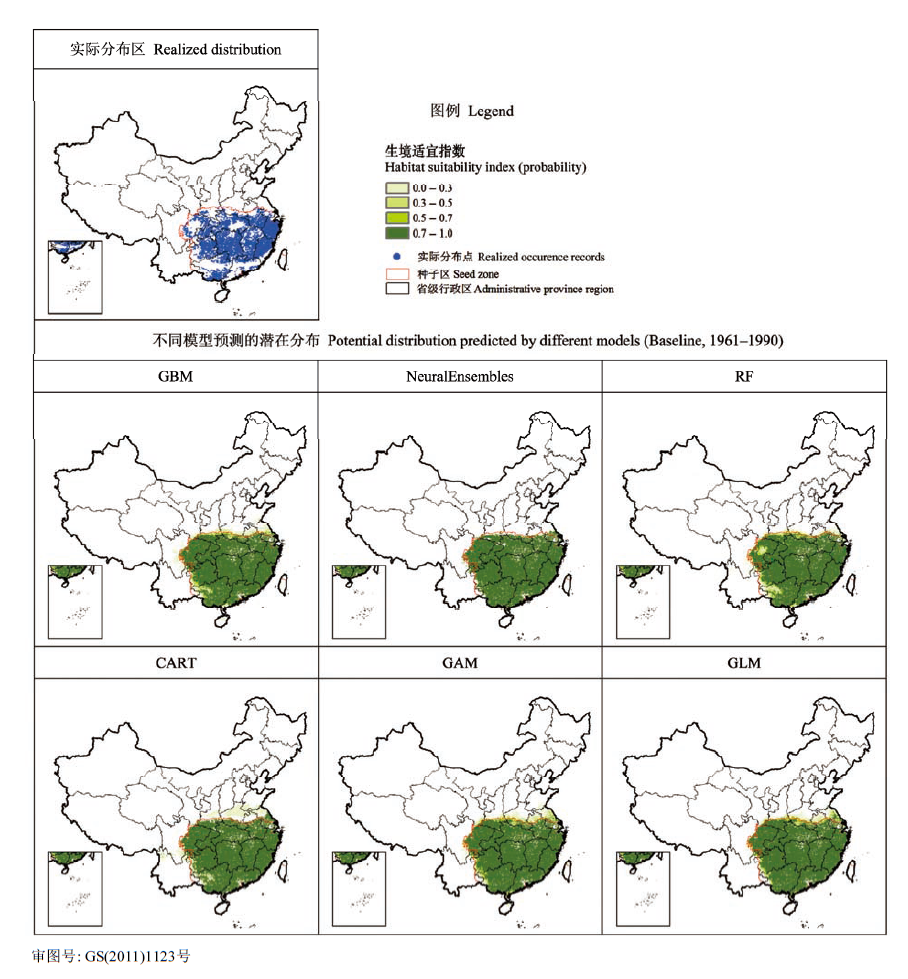
图1 不同模型预测的基准气候条件下(1961-1990)马尾松的潜在分布区。CART, 分类回归树; GAM, 广义加法模型; GBM, 广义助推法; GLM, 广义线性模型; RF, 随机森林。
Fig. 1 Potential distribution maps for Pinus massoniana predicted by different models under baseline climate (1961-1990). CART, classification and regression tree; GAM, generalized additive model; GBM, generalized boosted model; GLM, generalized linear model; RF, random forest.
| 评估指标 Evaluation index | 模型类型 Model type | |||||
|---|---|---|---|---|---|---|
| RF | GBM | NeuralEnsembles | GAM | GLM | CART | |
| AUC | 1.000 | 1.000 | 0.994 | 1.000 | 0.999 | 0.995 |
| Kappa | 0.996 | 0.990 | 0.985 | 0.985 | 0.983 | 0.980 |
| TSS | 0.997 | 0.992 | 0.989 | 0.987 | 0.986 | 0.982 |
表1 模型的预测精度
Table 1 Predictive accuracy of model
| 评估指标 Evaluation index | 模型类型 Model type | |||||
|---|---|---|---|---|---|---|
| RF | GBM | NeuralEnsembles | GAM | GLM | CART | |
| AUC | 1.000 | 1.000 | 0.994 | 1.000 | 0.999 | 0.995 |
| Kappa | 0.996 | 0.990 | 0.985 | 0.985 | 0.983 | 0.980 |
| TSS | 0.997 | 0.992 | 0.989 | 0.987 | 0.986 | 0.982 |
| 模型类型 Model type | CA (km) | JP (km) | NW (km) | |||||||||||||||||
|---|---|---|---|---|---|---|---|---|---|---|---|---|---|---|---|---|---|---|---|---|
| 2020s | 2050s | 2080s | 2020s | 2050s | 2080s | 2020s | 2050s | 2080s | ||||||||||||
| CART | 28 | 41 | 61 | 15 | 21 | 35 | 6 | 12 | 22 | |||||||||||
| GAM | 28 | 46 | 76 | 25 | 43 | 88 | 6 | 17 | 39 | |||||||||||
| GBM | 33 | 43 | 64 | 25 | 38 | 50 | 12 | 22 | 38 | |||||||||||
| GLM | 12 | 15 | 40 | 10 | 20 | 44 | 1 | 4 | 6 | |||||||||||
| NeuralEnsembles | 65 | 88 | 142 | 61 | 95 | 154 | 26 | 56 | 87 | |||||||||||
| RF | 45 | 54 | 82 | 34 | 50 | 74 | 17 | 29 | 45 | |||||||||||
表2 未来气候条件下马尾松分布区的北向迁移距离
Table 2 Northward shifting distance for Pinus massoniana under future climate
| 模型类型 Model type | CA (km) | JP (km) | NW (km) | |||||||||||||||||
|---|---|---|---|---|---|---|---|---|---|---|---|---|---|---|---|---|---|---|---|---|
| 2020s | 2050s | 2080s | 2020s | 2050s | 2080s | 2020s | 2050s | 2080s | ||||||||||||
| CART | 28 | 41 | 61 | 15 | 21 | 35 | 6 | 12 | 22 | |||||||||||
| GAM | 28 | 46 | 76 | 25 | 43 | 88 | 6 | 17 | 39 | |||||||||||
| GBM | 33 | 43 | 64 | 25 | 38 | 50 | 12 | 22 | 38 | |||||||||||
| GLM | 12 | 15 | 40 | 10 | 20 | 44 | 1 | 4 | 6 | |||||||||||
| NeuralEnsembles | 65 | 88 | 142 | 61 | 95 | 154 | 26 | 56 | 87 | |||||||||||
| RF | 45 | 54 | 82 | 34 | 50 | 74 | 17 | 29 | 45 | |||||||||||
| 模型类型 Model type | CA (m) | JP (m) | NW (m) | |||||||||
|---|---|---|---|---|---|---|---|---|---|---|---|---|
| 2020s | 2050s | 2080s | 2020s | 2050s | 2080s | 2020s | 2050s | 2080s | ||||
| CART | 23 | 23 | 57 | 15 | 29 | 60 | 12 | 20 | 42 | |||
| GAM | 7 | 2 | 13 | -1 | 1 | 5 | 3 | 8 | 12 | |||
| GBM | 16 | 26 | 55 | 9 | 24 | 55 | 8 | 20 | 46 | |||
| GLM | 15 | 9 | 11 | 8 | 11 | 12 | 10 | 16 | 22 | |||
| NeuralEnsembles | -7 | 0 | 35 | -10 | 0 | 21 | -2 | 1 | 17 | |||
| RF | 3 | 8 | 42 | -6 | 4 | 34 | -4 | 3 | 22 | |||
表3 未来气候条件下马尾松最适宜海拔分布高度的上升距离
Table 3 Upward shifting at optimum elevation for Pinus massoniana under future climate
| 模型类型 Model type | CA (m) | JP (m) | NW (m) | |||||||||
|---|---|---|---|---|---|---|---|---|---|---|---|---|
| 2020s | 2050s | 2080s | 2020s | 2050s | 2080s | 2020s | 2050s | 2080s | ||||
| CART | 23 | 23 | 57 | 15 | 29 | 60 | 12 | 20 | 42 | |||
| GAM | 7 | 2 | 13 | -1 | 1 | 5 | 3 | 8 | 12 | |||
| GBM | 16 | 26 | 55 | 9 | 24 | 55 | 8 | 20 | 46 | |||
| GLM | 15 | 9 | 11 | 8 | 11 | 12 | 10 | 16 | 22 | |||
| NeuralEnsembles | -7 | 0 | 35 | -10 | 0 | 21 | -2 | 1 | 17 | |||
| RF | 3 | 8 | 42 | -6 | 4 | 34 | -4 | 3 | 22 | |||
| 模型类型 Model type | 消失面积 Area lost (%) | 新增面积 New area (%) | 总面积变化 Total area change (%) | |||||||
|---|---|---|---|---|---|---|---|---|---|---|
| 2020s | 2050s | 2080s | 2020s | 2050s | 2080s | 2020s | 2050s | 2080s | ||
| CART | CA | 2.8 | 2.2 | 2.4 | 5.9 | 9.0 | 13.6 | 3.1 | 6.8 | 11.2 |
| JP | 0.9 | 1.0 | 1.0 | 4.8 | 6.7 | 11.0 | 3.8 | 5.7 | 10.0 | |
| NW | 1.0 | 0.8 | 0.6 | 3.1 | 5.0 | 8.3 | 2.1 | 4.2 | 7.6 | |
| GAM | CA | 0.9 | 0.3 | 0.4 | 5.6 | 10.6 | 18.1 | 4.7 | 10.3 | 17.7 |
| JP | 0.1 | 0.1 | 0.2 | 6.4 | 9.9 | 19.1 | 6.3 | 9.8 | 18.9 | |
| NW | 0.1 | 0.1 | 0.1 | 3.1 | 5.8 | 11.2 | 3.0 | 5.7 | 11.1 | |
| GBM | CA | 1.9 | 1.9 | 3.0 | 5.0 | 6.6 | 8.5 | 3.1 | 4.8 | 5.5 |
| JP | 0.7 | 0.9 | 1.5 | 5.3 | 7.2 | 8.8 | 4.6 | 6.3 | 7.4 | |
| NW | 0.5 | 0.7 | 1.1 | 3.4 | 5.0 | 8.3 | 2.9 | 4.4 | 7.2 | |
| GLM | CA | 1.1 | 0.3 | 0.3 | 3.9 | 7.4 | 14.7 | 2.7 | 7.1 | 14.4 |
| JP | 0.5 | 0.1 | 0.2 | 4.3 | 7.9 | 15.6 | 3.8 | 7.7 | 15.4 | |
| NW | 0.4 | 0.1 | 0.1 | 2.6 | 4.9 | 9.4 | 2.2 | 4.8 | 9.3 | |
| NeuralEnsembles | CA | 1.1 | 0.3 | 0.3 | 3.9 | 7.4 | 14.7 | 2.8 | 7.1 | 14.4 |
| JP | 0.5 | 0.1 | 0.1 | 4.3 | 7.8 | 15.6 | 3.8 | 7.7 | 15.5 | |
| NW | 0.4 | 0.1 | 0.1 | 2.6 | 4.9 | 9.4 | 2.2 | 4.8 | 9.3 | |
| RF | CA | 2.2 | 2.3 | 2.4 | 11.6 | 15.8 | 23.8 | 9.4 | 13.5 | 21.4 |
| JP | 0.9 | 1.0 | 0.5 | 11.2 | 16.0 | 24.2 | 10.3 | 15.0 | 23.7 | |
| NW | 0.8 | 0.5 | 0.4 | 5.8 | 10.6 | 17.2 | 5.0 | 10.1 | 16.9 | |
表4 未来气候条件下马尾松潜在分布区的面积变化
Table 4 Potential distribution area change for Pinus massoniana under future climate
| 模型类型 Model type | 消失面积 Area lost (%) | 新增面积 New area (%) | 总面积变化 Total area change (%) | |||||||
|---|---|---|---|---|---|---|---|---|---|---|
| 2020s | 2050s | 2080s | 2020s | 2050s | 2080s | 2020s | 2050s | 2080s | ||
| CART | CA | 2.8 | 2.2 | 2.4 | 5.9 | 9.0 | 13.6 | 3.1 | 6.8 | 11.2 |
| JP | 0.9 | 1.0 | 1.0 | 4.8 | 6.7 | 11.0 | 3.8 | 5.7 | 10.0 | |
| NW | 1.0 | 0.8 | 0.6 | 3.1 | 5.0 | 8.3 | 2.1 | 4.2 | 7.6 | |
| GAM | CA | 0.9 | 0.3 | 0.4 | 5.6 | 10.6 | 18.1 | 4.7 | 10.3 | 17.7 |
| JP | 0.1 | 0.1 | 0.2 | 6.4 | 9.9 | 19.1 | 6.3 | 9.8 | 18.9 | |
| NW | 0.1 | 0.1 | 0.1 | 3.1 | 5.8 | 11.2 | 3.0 | 5.7 | 11.1 | |
| GBM | CA | 1.9 | 1.9 | 3.0 | 5.0 | 6.6 | 8.5 | 3.1 | 4.8 | 5.5 |
| JP | 0.7 | 0.9 | 1.5 | 5.3 | 7.2 | 8.8 | 4.6 | 6.3 | 7.4 | |
| NW | 0.5 | 0.7 | 1.1 | 3.4 | 5.0 | 8.3 | 2.9 | 4.4 | 7.2 | |
| GLM | CA | 1.1 | 0.3 | 0.3 | 3.9 | 7.4 | 14.7 | 2.7 | 7.1 | 14.4 |
| JP | 0.5 | 0.1 | 0.2 | 4.3 | 7.9 | 15.6 | 3.8 | 7.7 | 15.4 | |
| NW | 0.4 | 0.1 | 0.1 | 2.6 | 4.9 | 9.4 | 2.2 | 4.8 | 9.3 | |
| NeuralEnsembles | CA | 1.1 | 0.3 | 0.3 | 3.9 | 7.4 | 14.7 | 2.8 | 7.1 | 14.4 |
| JP | 0.5 | 0.1 | 0.1 | 4.3 | 7.8 | 15.6 | 3.8 | 7.7 | 15.5 | |
| NW | 0.4 | 0.1 | 0.1 | 2.6 | 4.9 | 9.4 | 2.2 | 4.8 | 9.3 | |
| RF | CA | 2.2 | 2.3 | 2.4 | 11.6 | 15.8 | 23.8 | 9.4 | 13.5 | 21.4 |
| JP | 0.9 | 1.0 | 0.5 | 11.2 | 16.0 | 24.2 | 10.3 | 15.0 | 23.7 | |
| NW | 0.8 | 0.5 | 0.4 | 5.8 | 10.6 | 17.2 | 5.0 | 10.1 | 16.9 | |
| 差异来源 Source of variation | 自由度 Degrees of freedom | F | p | |
|---|---|---|---|---|
| 分子 Numerator | 分母 Denominator | |||
| 截距 Intercept | 1 | 44 | 10.114 65 | 0.002 7 |
| 物种分布模型 Species distribution model | 5 | 44 | 25.867 31 | <0.000 1 |
| 大气环流模型 Global circulation model | 2 | 44 | 17.121 49 | <0.000 1 |
表5 物种分布模型(SDM)和大气环流模型(GCM)对预测分布区面积变化影响的方差分析
Table 5 Analysis of variance with species distribution model (SDM) and global circulation model (GCM) effects on change of predicted distribution area
| 差异来源 Source of variation | 自由度 Degrees of freedom | F | p | |
|---|---|---|---|---|
| 分子 Numerator | 分母 Denominator | |||
| 截距 Intercept | 1 | 44 | 10.114 65 | 0.002 7 |
| 物种分布模型 Species distribution model | 5 | 44 | 25.867 31 | <0.000 1 |
| 大气环流模型 Global circulation model | 2 | 44 | 17.121 49 | <0.000 1 |
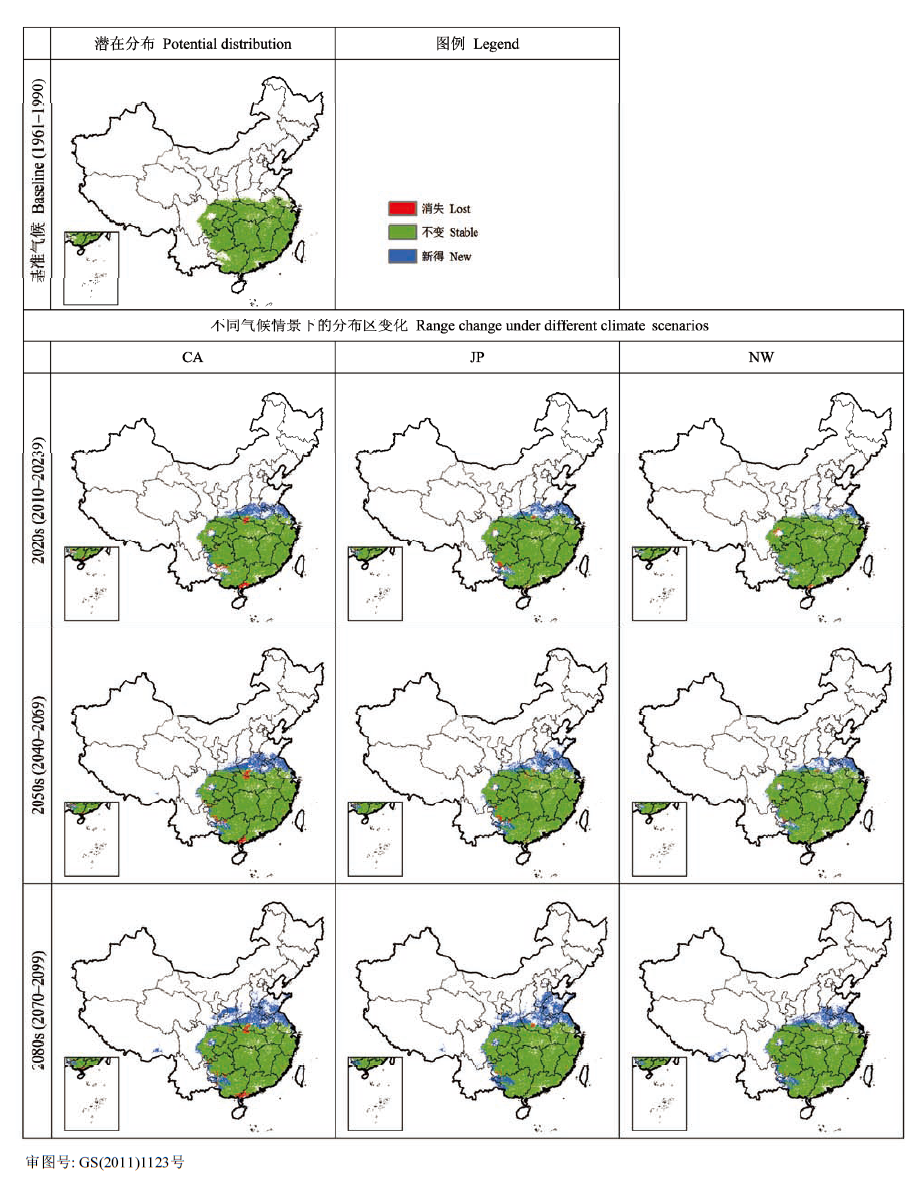
图2 随机森林预估的马尾松在未来气候条件下潜在分布区的变化。CA、JP和NW见表2。
Fig. 2 Potential distribution area change for Pinus massoniana under future climate as predicted by random forest. CA, JP and NW see Table 2.
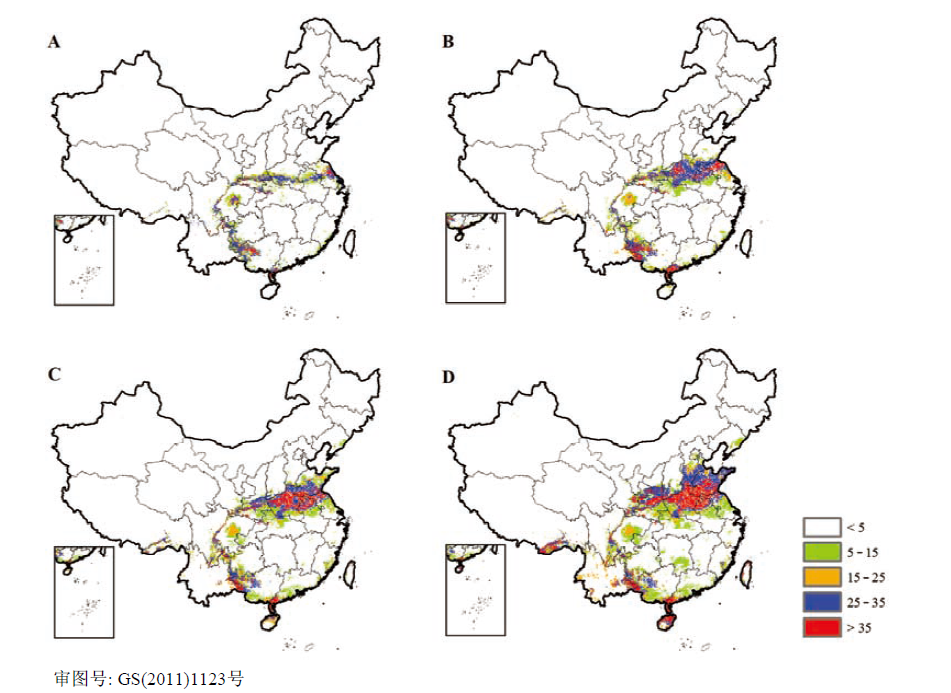
图3 基准气候条件下马尾松6个潜在生境分布模拟的标准差(%) (A)以及未来18个(6个模型 × 3 GCM)潜在生境预估的标准差(%) (B, 2020s; C, 2050s; D, 2080s)。
Fig. 3 Spatial patterns in standard deviations (%) of potential habitat suitability calculated across six current predictions under baseline climate (A) and 18 future projections (%) (6 models × 3 GCMs) (B, 2020s; C, 2050s; D, 2080s).
| [1] | Allouche O, Tsoar A, Kadmon R (2006). Assessing the acc- uracy of species distribution models: prevalence, Kappa and the true skill statistic (TSS). Journal of Applied Ecology, 43,1223-1232. |
| [2] | Barry S, Elith J (2006). Error and uncertainty in habitat models. Journal of Applied Ecology, 43,413-423. |
| [3] |
Beaumont LJ, Hughes L, Pitman AJ (2008). Why is the choice of future climate scenarios for species distribution modelling important? Ecology Letters, 11,1135-1146.
DOI URL PMID |
| [4] | Breiman L (2001). Random forests. Machine Learning, 45,5-32. |
| [5] | Breiman L, Cutler A (2004). Random forests. http://www.stat.berkeley.edu/users/breiman/RandomForests/cc_home.htm.Cited 10 Oct.2010. |
| [6] | Buisson L, Thuiller W, Casajus N, Lek S, Grenouillet G (2010). Uncertainty in ensemble forecasting of species distribution. Global Change Biology, 16,1145-1157. |
| [7] | Cao MC (曹铭昌), Zhou GS (周广胜), Weng ES (翁恩生) (2005). Application and comparison of generalized models and classification and regression tree in simulating tree species distribution. Acta Ecologica Sinica(生态学报), 25,2031-2040. (in Chinese with English abstract) |
| [8] | Chefaoui RM, Lobo JM (2008). Assessing the effects of pseudo-absences on predictive distribution model perfor- mance. Ecological Modeling, 210,478-486. |
| [9] | Chuine I, Beaubien EG (2001). Phenology is a major determinant of tree species range. Ecology Letters, 4,500-510. |
| [10] | Clemen RT (1989). Combining forecasts: a review and annotated bibliography. International Journal of Fore- casting, 5,559-583. |
| [11] | Cohen J (1960). A coefficient of agreement for nominal scales. Educational and Psychological Measurement, 20,37-46. |
| [12] | Daly C, Gibson WP, Taylor GH, Johnson GL, Pasteris P (2002). A knowledge-based approach to the statistical mapping of climate. Climate Research, 22,99-113. |
| [13] | Editorial Board of Vegetation Map of China,Chinese Academy of Sciences (中国科学院中国植被图编辑委员会) (2001). 1 : 1 Million Vegetation Atlas of China (中国植被图集 1 : 1 000 000). Science Press, Beijing. (in Chinese) |
| [14] | Elith J, Graham CH, Anderson RP, Dudík M, Ferrier S, Guisan A, Hijmans RJ, Huettmann F, Leathwick JR, Lehmann A, Li J, Lohmann LG, Loiselle BA, Manion G, Moritz C, Nakamura M, Nakazawa Y, Overton JM, Peterson AT, Phillips SJ, Richardson K, Scachetti-Pereira R, Schapire RE, Soberón J, Williams S, Wisz MS, Zimmermann NE (2006). Novel methods improve prediction of species’ distributions from occurrence data. Ecography, 29,129-151. |
| [15] | Elith J, Leathwick J, Hastie T (2008). A working guide to boosted regression trees. Journal of Animal Ecology, 77,802-813. |
| [16] | Fielding AH, Bell JF (1997). A review of methods for the assessment of prediction errors in conservation presence/ absence models. Environmental Conservation, 24,38-49. |
| [17] | Friedman JH (2001). Greedy function approximation: a gradient boosting machine. The Annals of Statistics, 29,1189-1232. |
| [18] | Granitto PM, Verdes PF, Ceccatto HA (2005). Neural network ensembles: evaluation of aggregation algorithms. Artificial Intelligence, 163,139-162. |
| [19] | Guisan A, Zimmermann NE (2000). Predictive habitat distribution models in ecology. Ecological Modeling, 135,147-186. |
| [20] | He QT (贺庆棠), Yuan JZ (袁嘉祖), Chen ZB (陈志泊) (1996). Possible effects of the climate changes on the distribution of Pinus massoniana and Pinus yunnanensis in South China. Journal of Beijing Forestry University (北京林业大学学报), 18(1),22-28. (in Chinese with English abstract) |
| [21] | Hernandez PA, Graham CH, Master LL, Albert DL (2006). The effect of sample size and species characteristics on performance of different species distribution modeling methods. Ecography, 29,773-785. |
| [22] | IPCC Intergovernmental Panel on Climate Change (2007). Summary for policymakers. In: Solomon S, Qin D, Manning M, Chen Z, Marquis M, Averyt KB, Tignor M, Miller HL eds. Climate Change 2007: The Physical Science Basis. Contribution of Working Group I to the Fourth Assessment Report of the Intergovernmental Panel on Climate Change. Cambridge University Press, New York. |
| [23] | Iverson LR, Prasad AM, Matthews SN, Peters M (2008). Estimating potential habitat for 134 eastern US tree species under six climate scenarios. Forest Ecology and Management, 254,390-406. |
| [24] | Jiang ZH (江志红), Zhang X (张霞), Wang J (王冀) (2008). Projection of climate change in China in the 21st century by IPCC-AR4 Models. Geographical Research (地理研究), 27,787-799. (in Chinese with English abstract) |
| [25] | Lawler JJ, White D, Neilson RP, Blaustein AR (2006). Predicting climate-induced range shifts: model differences and model reliability. Global Change Biology, 12,1568-1584. |
| [26] |
Lenoir J, Gégout JC, Marquet PA, de Ruffray P, Brisse H (2008). A significant upward shift in plant species optimum elevation during the 20th century. Science, 320,1768-1771.
URL PMID |
| [27] | Li B (李博), Zhou TJ (周天军) (2010). Projected climate change over China under SRES A1B scenario: multi- model ensemble and uncertainties. Advances in Climate Change Research (气候变化研究进展), 6,270-276. (in Chinese with English abstract) |
| [28] | Li F (李峰), Zhou GS (周广胜), Cao MC (曹铭昌) (2006). Responses of Larix gmelinii geographical distribution to future climate change: a simulation study. Chinese Journal of Applied Ecology (应用生态学报), 17,2255-2260. (in Chinese with English abstract) |
| [29] | Liaw A, Wiener M (2002). Classification and regression by randomForest. R News, 2(3),18-22. |
| [30] | Lü JJ (吕佳佳), Wu JG (吴建国) (2009). Advances in the effects of climate change on the distribution of plant species and vegetation in China. Environmental Science & Technology (环境科学与技术), 32(6),85-95. (in Chinese with English abstract) |
| [31] | Mitchell TD, Jones PD (2005). An improved method of constructing a database of monthly climate observations and associated high-resolution grids. International Journal of Climatology, 25,693-712. |
| [32] | Monserud RA, Leemans R (1992). Comparing global vegeta- tion maps with the Kappa statistic. Ecological Modelling, 62,275-293. |
| [33] | Nix HA (1986). A biogeographic analysis of Australian Elapid snakes. In: Longmore R ed. Atlas of Elapid Snakes of Australia. Australian Government Publishing Service, Canberra. 4-15. |
| [34] | O’Hanley JR (2009). NeuralEnsembles: a neural network based ensemble forecasting program for habitat and bioclimatic suitability analysis. Ecography, 32,89-93. |
| [35] |
Parmesan C, Yohe G (2003). A globally coherent fingerprint of climate change impacts across natural systems. Nature, 421,37-42.
DOI URL PMID |
| [36] | Pearson RG, Dawson TP (2003). Predicting the impacts of climate change on the distribution of species: Are bioclimate envelope models useful? Global Ecology & Biogeography, 12,361-371. |
| [37] | Peñuelas J, Boada M (2003). A global change-induced biome shift in the Montseny mountains (NE Spain). Global Change Biology, 9,131-140. |
| [38] | R Development Core Team (2010). R: A Language and Environment for Statistical Computing. R Foundation for Statistical Computing, Vienna, Austria. ISBN3-900051-07-0, http://www.R-project.org. |
| [39] | Ridgeway G (1999). The state of boosting. In: Berk K, Pourahmadi M eds. Computing Science and Statistics 31. Interface Foundation of North America, Fairfax Station. 172-181. |
| [40] | Ridgeway G (2007). gbm: generalized boosted regression models. R Package Version 1.6-3. http://www.i-pensieri.com/gregr/gbm.shtml. |
| [41] |
Root TL, Price JT, Hall KR, Schneider SH, Rosenzweig C, Pounds JA (2003). Fingerprints of global warming on wild animals and plants. Nature, 421,57-60.
DOI URL PMID |
| [42] | Shao H (邵慧), Tian JQ (田佳倩), Guo K (郭柯), Sun OJ (孙建新) (2009). Effects of sample size and species traits on performance of Bioclim in predicting geographical distribution of tree species—a case study with 12 deciduousQuercus species indigenous to China. Chinese Journal of Plant Ecology (植物生态学报), 33,870-877. (in Chinese with English abstract) |
| [43] | Shoo LP, Williams SE, Hero JM (2006). Detecting climate change induced range shifts: Where and how should we be looking? Austral Ecology, 31,22-29. |
| [44] |
Swets JA (1988). Measuring the accuracy of diagnostic systems. Science, 240,1285-1293.
DOI URL PMID |
| [45] | ter Braak CJF, Looman CWN (1986). Weighted averaging, logistic regression and the Gaussian response model. Plant Ecology, 65,3-11. |
| [46] | Václavík T, Meentemeyer RK (2009). Invasive species distribution modeling (iSDM): Are absence data and dispersal constraints needed to predict actual distribu- tions? Ecological Modeling, 220,3248-3258. |
| [47] | Wang J (王娟), Ni J (倪健) (2006). Review of modelling the distribution of plant species. Journal of Plant Ecology (Chinese Version) (植物生态学报), 30,1040-1053. (in Chinese with English abstract) |
| [48] | Wang T, Hamann A, Spittlehouse DL, Aitken SN (2006). Development of scale-free climate data for Western Canada for use in resource management. International Journal of Climatology, 26,383-397. |
| [49] | Webb T III, Bartlein PJ (1992). Global changes during the last 3 million years: climatic controls and biotic responses. Annual Review of Ecology and Systematics, 23,141-173. |
| [50] |
Wisz MS, Guisan A (2009). Do pseudo-absence selection strategies influence species distribution models and their predictions? An information-theoretic approach based on simulated data. BMC Ecology,doi: $10.1186/1472-6785-9-8.
URL PMID |
| [51] | Wisz MS, Hijmans RJ, Li J, Peterson AT, Graham CH, Guisan A (2008). Effects of sample size on the performance of species distribution models. Diversity and Distributions, 14,763-773. |
| [52] | Wu JG (吴建国), Lü JJ (吕佳佳) (2009). Potential effects of climate change on the distribution of Dove Trees ( Davidia involucrata Baill) in China. Research of Environmental Sciences (环境科学研究), 22,1371-1381. (in Chinese with English abstract) |
| [53] | Xu DY (徐德应), Guo QS (郭泉水), Yan H (闫洪) (1997). A Study on the Impacts of Climate Change on Forests in China(气候变化对中国森林影响研究). China Scientific and Technical Press, Beijing. (in Chinese) |
| [54] |
Xu DY, Yan H (2001). A study of the impacts of climate change on the geographic distribution of Pinus koraiensis in China. Environment International, 27,201-205.
DOI URL PMID |
| [1] | 陈以恒 玉素甫江·如素力 阿卜杜热合曼·吾斯曼. 2001-2020年天山新疆段草地植被覆盖度时空变化及驱动因素分析[J]. 植物生态学报, 2024, 48(5): 561-576. |
| [2] | 张计深, 史新杰, 刘宇诺, 吴阳, 彭守璋. 气候变化下中国潜在自然植被生态系统碳储量动态[J]. 植物生态学报, 2024, 48(4): 428-444. |
| [3] | 臧妙涵, 王传宽, 梁逸娴, 刘逸潇, 上官虹玉, 全先奎. 基于纬度移栽的落叶松叶、枝、根生态化学计量特征对气候变暖的响应[J]. 植物生态学报, 2024, 48(4): 469-482. |
| [4] | 梁逸娴, 王传宽, 臧妙涵, 上官虹玉, 刘逸潇, 全先奎. 落叶松径向生长和生物量分配对气候变暖的响应[J]. 植物生态学报, 2024, 48(4): 459-468. |
| [5] | 吴茹茹, 刘美珍, 谷仙, 常馨月, 郭立月, 蒋高明, 祁如意. 气候变化对巨柏适宜生境分布的潜在影响和预测[J]. 植物生态学报, 2024, 48(4): 445-458. |
| [6] | 杨宇萌, 来全, 刘心怡. 气候变化和人类活动对内蒙古植被总初级生产力的定量影响[J]. 植物生态学报, 2024, 48(3): 306-316. |
| [7] | 张启, 程雪寒, 王树芝. 北京西山老龄树记载的森林干扰历史[J]. 植物生态学报, 2024, 48(3): 341-348. |
| [8] | 郑炀, 孙学广, 熊洋阳, 袁贵云, 丁贵杰. 叶际微生物对马尾松凋落针叶分解的影响[J]. 植物生态学报, 2023, 47(5): 687-698. |
| [9] | 任培鑫, 李鹏, 彭长辉, 周晓路, 杨铭霞. 洞庭湖流域植被光合物候的时空变化及其对气候变化的响应[J]. 植物生态学报, 2023, 47(3): 319-330. |
| [10] | 李杰, 郝珉辉, 范春雨, 张春雨, 赵秀海. 东北温带森林树种和功能多样性对生态系统多功能性的影响[J]. 植物生态学报, 2023, 47(11): 1507-1522. |
| [11] | 魏瑶, 马志远, 周佳颖, 张振华. 模拟增温改变青藏高原植物繁殖物候及植株高度[J]. 植物生态学报, 2022, 46(9): 995-1004. |
| [12] | 党宏忠, 张学利, 韩辉, 石长春, 葛玉祥, 马全林, 陈帅, 刘春颖. 樟子松固沙林林水关系研究进展及对营林实践的指导[J]. 植物生态学报, 2022, 46(9): 971-983. |
| [13] | 李肖, PIALUANG Bounthong, 康文辉, 冀晓东, 张海江, 薛治国, 张志强. 近几十年来冀西北山地白桦次生林径向生长对气候变化的响应[J]. 植物生态学报, 2022, 46(8): 919-931. |
| [14] | 苏启陶, 杜志喧, 周兵, 廖永辉, 王呈呈, 肖宜安. 牯岭凤仙花及其传粉昆虫在中国的潜在分布区域分析[J]. 植物生态学报, 2022, 46(7): 785-796. |
| [15] | 胡潇飞, 魏临风, 程琦, 吴星麒, 倪健. 青藏高原地区气候图解数据集[J]. 植物生态学报, 2022, 46(4): 484-492. |
| 阅读次数 | ||||||
|
全文 |
|
|||||
|
摘要 |
|
|||||
Copyright © 2026 版权所有 《植物生态学报》编辑部
地址: 北京香山南辛村20号, 邮编: 100093
Tel.: 010-62836134, 62836138; Fax: 010-82599431; E-mail: apes@ibcas.ac.cn, cjpe@ibcas.ac.cn
备案号: 京ICP备16067583号-19
![]()