
植物生态学报 ›› 2014, Vol. 38 ›› Issue (5): 405-416.DOI: 10.3724/SP.J.1258.2014.00037
• 研究论文 • 下一篇
吕亭亭1,王平1,*( ),燕红1,张稳1,廖桂项1,姜海波1,邹畅林2,盛连喜1,*()
收稿日期:2013-10-28
接受日期:2014-02-07
出版日期:2014-10-28
发布日期:2014-05-13
通讯作者:
王平,盛连喜
基金资助:
LÜ Ting-Ting1,WANG Ping1,*(),YAN Hong1,ZHANG Wen1,LIAO Gui-Xiang1,JIANG Hai-Bo1,ZOU Chang-Lin2,SHENG Lian-Xi1,*()
Received:2013-10-28
Accepted:2014-02-07
Online:2014-10-28
Published:2014-05-13
Contact:
WANG Ping,SHENG Lian-Xi
摘要:
功能多样性-生产力关系研究结果支持质量比假说和多样性假说, 但对于这两种假说的适用条件尚有争议。通过对吉林省西部草甸和沼泽植物群落的地上生物量、2个物种多样性指标(物种丰富度和Shannon-Weaver指数)、7种植物性状的两类功能多样性指标(群落权重均值和Rao二次熵), 以及土壤环境因子进行调查测量, 研究了群落功能多样性与生产力的关系。结果表明: 1)功能多样性与生产力的关系比物种多样性与生产力的关系更为密切; 2)功能群落权重均值解释生产力变异的能力好于Rao二次熵, 即优势物种对群落生产力的影响作用更大; 3)水淹条件影响着功能多样性与生产力的关系, 以群落权重均值为基础的质量比假说适于解释草甸群落功能多样性与生产力的关系, 而以Rao二次熵为基础的多样性假说适于解释有强烈环境筛(水淹)的沼泽群落功能多样性与生产力的关系。
吕亭亭,王平,燕红,张稳,廖桂项,姜海波,邹畅林,盛连喜. 草甸和沼泽植物群落功能多样性与生产力的关系. 植物生态学报, 2014, 38(5): 405-416. DOI: 10.3724/SP.J.1258.2014.00037
LÜ Ting-Ting,WANG Ping,YAN Hong,ZHANG Wen,LIAO Gui-Xiang,JIANG Hai-Bo,ZOU Chang-Lin,SHENG Lian-Xi. Relationship between functional diversity and productivity in meadow and marsh plant communities. Chinese Journal of Plant Ecology, 2014, 38(5): 405-416. DOI: 10.3724/SP.J.1258.2014.00037
| 生境 Habitat | 群落 Community | 经纬度 Longitude and latitude | 海拔 Altitude (m) | 群落高度 Community height (cm) | 群落盖度 Community cover (%) |
|---|---|---|---|---|---|
| 草甸 Meadow | 芦苇群落 Phragmites australis community | 45.87° N, 123.77° E | 134.80 | 32.98 ± 9.42 | 50.96 ± 3.79 |
| 虎尾草群落 Chloris virgatas community | 46.17° N, 123.55° E | 146.40 | 15.45 ± 2.99 | 23.89 ± 3.91 | |
| 碱蓬群落 Suaeda glauca community | 46.67° N, 123.52° E | 141.10 | 7.60 ± 1.34 | 33.84 ± 5.06 | |
| 沼泽 Marsh | 扁秆藨草群落 Scirpus planiculmis community | 45.88° N, 123.70° E | 138.90 | 98.85 ± 17.53 | 70.94 ± 4.25 |
| 扁秆藨草-芦苇群落 Scirpus planiculmis-Phragmites australis community | 46.83° N, 123.67° E | 135.30 | 84.54 ± 20.76 | 45.50 ± 3.76 | |
| 芦苇-荆三棱群落 Phragmites australis-Scirpus fluviatilis community | 46.10° N, 123.67° E | 140.30 | 90.34 ± 9.95 | 35.26 ± 4.88 |
表1 研究样点分布特征(平均值±标准误差)
Table 1 Distribution and characteristics of the experimental sites (mean ± SE)
| 生境 Habitat | 群落 Community | 经纬度 Longitude and latitude | 海拔 Altitude (m) | 群落高度 Community height (cm) | 群落盖度 Community cover (%) |
|---|---|---|---|---|---|
| 草甸 Meadow | 芦苇群落 Phragmites australis community | 45.87° N, 123.77° E | 134.80 | 32.98 ± 9.42 | 50.96 ± 3.79 |
| 虎尾草群落 Chloris virgatas community | 46.17° N, 123.55° E | 146.40 | 15.45 ± 2.99 | 23.89 ± 3.91 | |
| 碱蓬群落 Suaeda glauca community | 46.67° N, 123.52° E | 141.10 | 7.60 ± 1.34 | 33.84 ± 5.06 | |
| 沼泽 Marsh | 扁秆藨草群落 Scirpus planiculmis community | 45.88° N, 123.70° E | 138.90 | 98.85 ± 17.53 | 70.94 ± 4.25 |
| 扁秆藨草-芦苇群落 Scirpus planiculmis-Phragmites australis community | 46.83° N, 123.67° E | 135.30 | 84.54 ± 20.76 | 45.50 ± 3.76 | |
| 芦苇-荆三棱群落 Phragmites australis-Scirpus fluviatilis community | 46.10° N, 123.67° E | 140.30 | 90.34 ± 9.95 | 35.26 ± 4.88 |
| 土壤理化性质 Soil physical and chemical property | t检验 t-test | F检验 F-test | |
|---|---|---|---|
| 草甸 Meadow | 沼泽 Marsh | ||
| 有机质 Organic matter (g·kg-1) | -7.00*** | 13.86 ± 1.03 | 40.47 ± 3.26*** |
| 全氮 Total nitrogen (g·kg-1) | -7.07*** | 0.78 ± 0.05*** | 1.96 ± 0.19*** |
| 全磷 Total phosphorus (g·kg-1) | -0.70 | 0.30 ± 0.02 | 0.28 ± 0.02*** |
| 电导率 Electrical conductivity (μS·cm-1) | 1.79 | 794.63 ± 112.89** | 550.58 ± 44.09*** |
| pH | 6.88*** | 9.97 ± 0.10*** | 9.17 ± 0.19*** |
| 水位 Water lever | - | - | 29.17 ± 3.04*** |
表2 土壤理化指标的t检验(草甸和沼泽之间)和F检验(不同群落之间)
Table 2 T-test between the meadow and marsh sites, and F-test among communities on soil physical and chemical properties
| 土壤理化性质 Soil physical and chemical property | t检验 t-test | F检验 F-test | |
|---|---|---|---|
| 草甸 Meadow | 沼泽 Marsh | ||
| 有机质 Organic matter (g·kg-1) | -7.00*** | 13.86 ± 1.03 | 40.47 ± 3.26*** |
| 全氮 Total nitrogen (g·kg-1) | -7.07*** | 0.78 ± 0.05*** | 1.96 ± 0.19*** |
| 全磷 Total phosphorus (g·kg-1) | -0.70 | 0.30 ± 0.02 | 0.28 ± 0.02*** |
| 电导率 Electrical conductivity (μS·cm-1) | 1.79 | 794.63 ± 112.89** | 550.58 ± 44.09*** |
| pH | 6.88*** | 9.97 ± 0.10*** | 9.17 ± 0.19*** |
| 水位 Water lever | - | - | 29.17 ± 3.04*** |
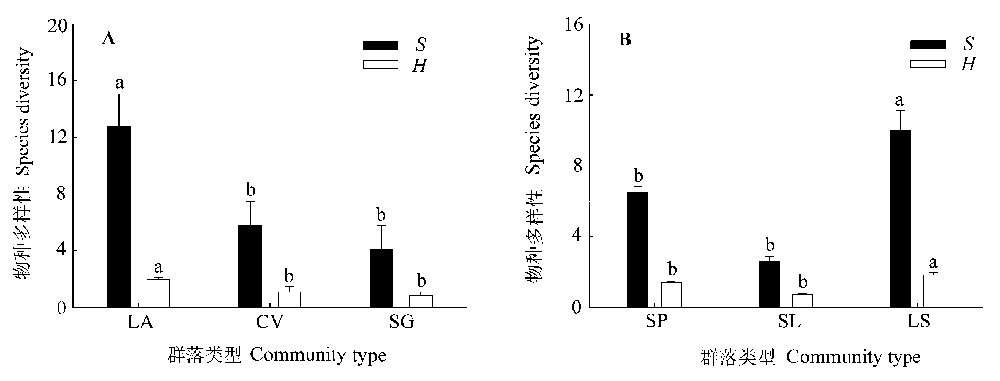
图1 草甸(A)和沼泽(B)中不同植物群落的物种丰富度(S)和Shannon-Weaver指数(H)。CV, 虎尾草群落; LA, 芦苇群落; LS, 芦苇-荆三棱群落; SG, 碱蓬群落; SL, 扁秆藨草-芦苇群落; SP, 扁秆藨草群落。不同小写字母表示群落间差异显著(p < 0.05)。
Fig. 1 Species richness (S) and Shannon-Weaver index (H) in different plant communities in meadow (A) and marsh (B). CV, Chloris virgate community; LA, Phragmites australis community; LS, Phragmites australis-Scirpus fluviatilis community; SG, Suaeda glauca community; SL, Scirpus compactus-Phragmites australis community; SP, Scirpus planiculmis community. Different lower-case letters indicate significant differences among communities (p < 0.05).
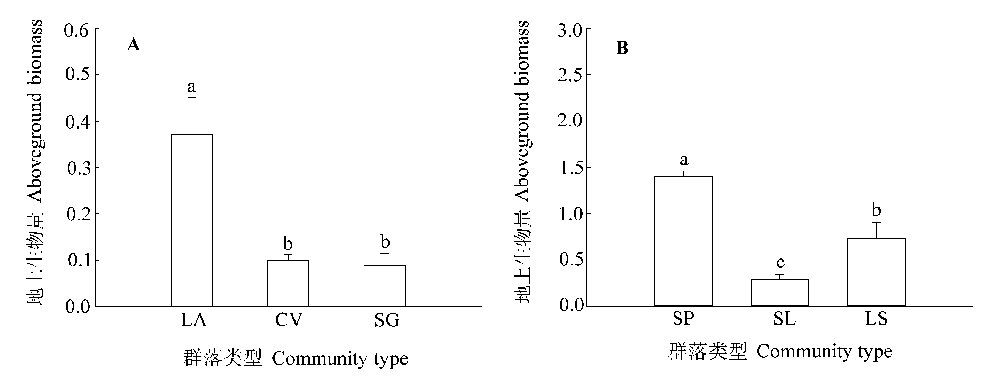
图2 草甸(A)和沼泽(B)中不同植物群落的地上生物量。CV, 虎尾草群落; LA, 芦苇群落; LS, 芦苇-荆三棱群落; SG, 碱蓬群落; SL, 扁秆藨草-芦苇群落; SP, 扁秆藨草群落。不同小写字母表示群落间差异显著(p < 0.05)。
Fig. 2 Aboveground biomass of different plant communities in meadow (A) and marsh (B). CV, Chloris virgate community; LA, Phragmites australis community; LS, Phragmites australis-Scirpus fluviatilis community; SG, Suaeda glauca community; SL, Scirpus compactus-Phragmites australis community; SP, Scirpus planiculmis community. Different lower-case letters indicate significant differences among communities (p < 0.05).
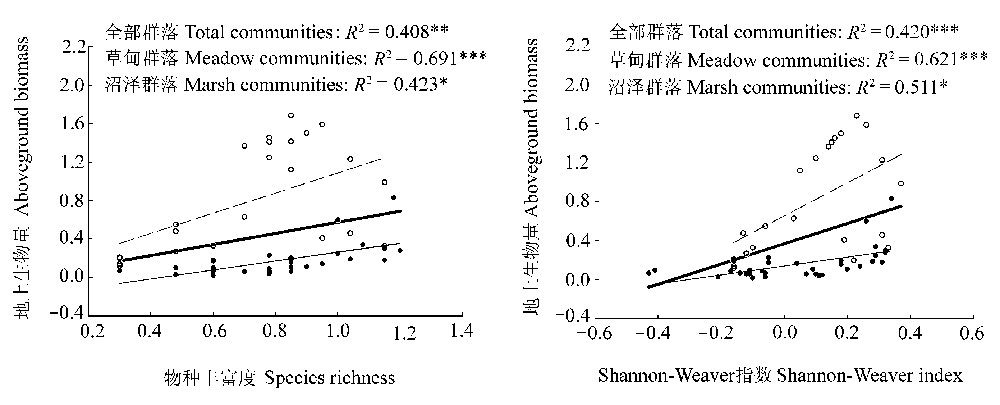
图3 群落地上生物量(lg转换后)与物种多样性(lg转换后)的关系。粗线表示全部群落, 细线表示草甸群落, 虚线表示沼泽群落。*、**和***分别表示p = 0.05、0.01和0.001。
Fig. 3 Relationships between aboveground biomass (lg transformed) and species diversity (lg transformed) of communities. The bold solid line represents all communities, the thin solid line represents meadow communities, and the dash line represents marsh communities. *, ** and *** indicate p = 0.05, 0.01 and 0.001, respectively.
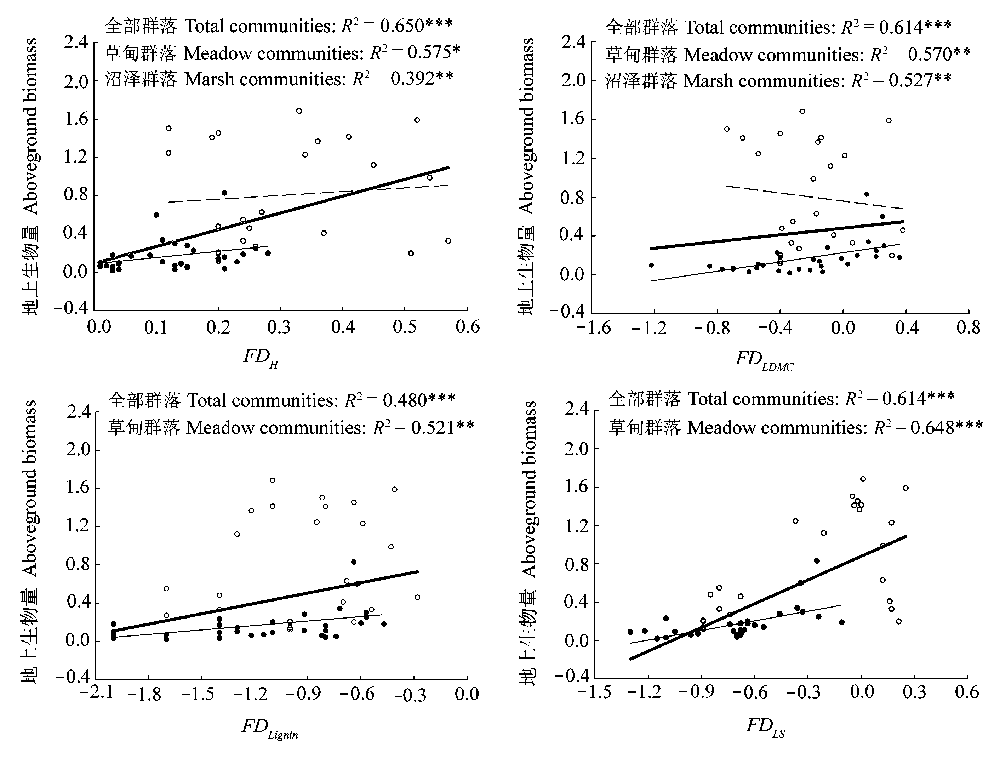
图4 群落地上生物量(lg转换后)与不同植物性状Rao二次熵的关系。粗线表示全部群落, 细线表示草甸群落, 虚线表示沼泽群落。FDH、FDLDMC (lg转换后)、FDLignin (lg转换后)和FDLS (lg转换后)分别表示植株高度、叶片干物质含量、叶片木质素含量和叶片大小的Rao二次熵。*、**和***分别表示p = 0.05、0.01和0.001。
Fig. 4 Relationships between aboveground biomass (lg transformed) and Rao’s quadratic entropy of different traits of communities. The bold solid line represents all communities, the thin solid line represents meadow communities, and the dash line represents marsh communities. FDH, FDLDMC (lg transformed), FDLignin (lg transformed), FDLS (lg transformed), indicate Rao’s quadratic entropy of plant height, leaf dry matter content, leaf lignin content and leaf size, respectively. *, ** and *** indicate p = 0.05, 0.01 and 0.001, respectively.
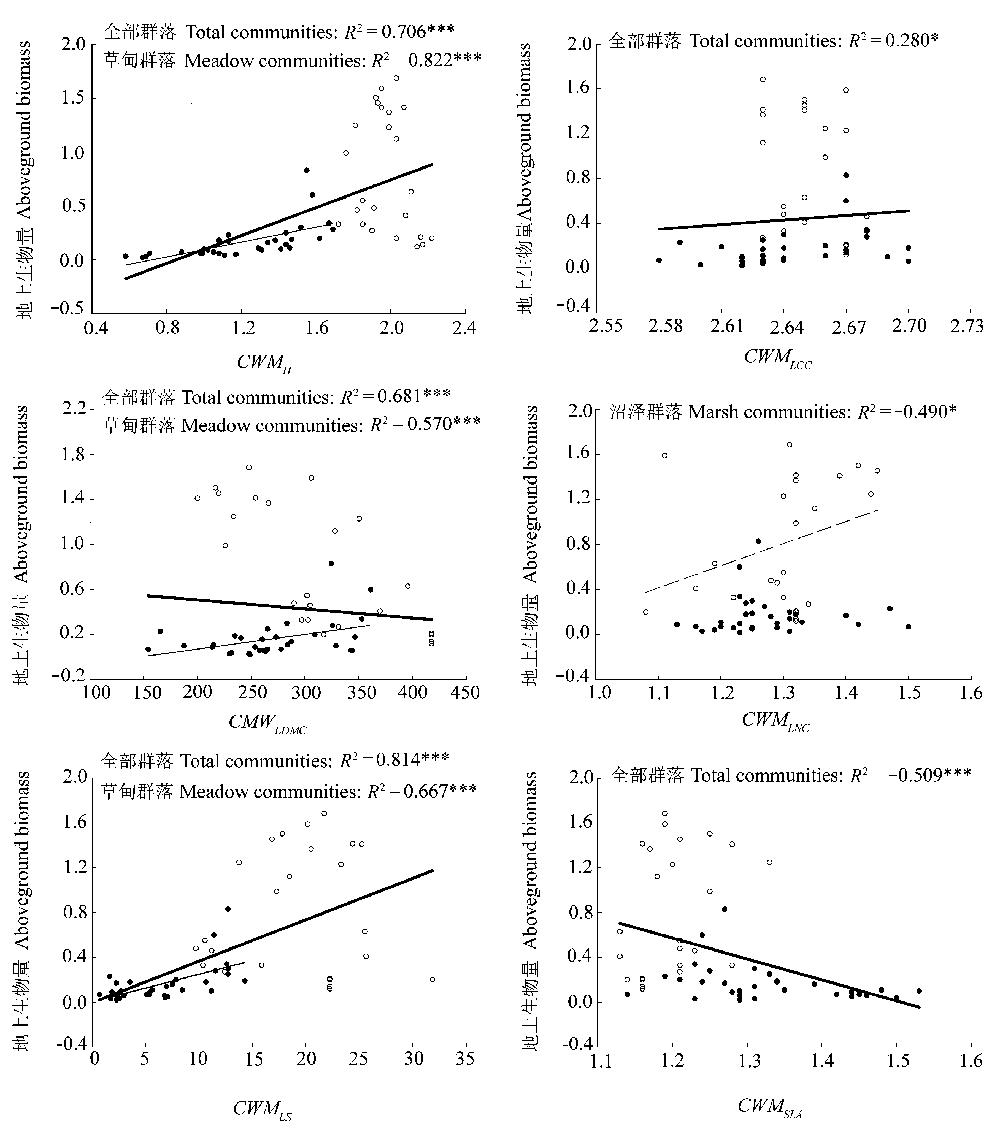
图5 群落地上生物量(lg转换后)与不同植物性状群落权重均值的关系。粗线表示全部群落, 细线表示草甸群落, 虚线表示沼泽群落。CWMH (lg转换后)、CWMLCC、CWMLDMC、CWMLNC (lg转换后)、CWMLS、CWMSLA (lg转换后)分别表示植株高度、叶片碳含量、叶片干物质含量、叶片氮含量、叶片大小和比叶面积的群落权重均值。*、**和***分别表示p = 0.05、0.01和0.001。
Fig. 5 Relationships between aboveground biomass (lg transformed) and community weighted mean of different traits of communities. The bold solid line represents all communities, the thin solid line represents meadow communities, and the dash line represents marsh communities. CWMH (lg transformed), CWMLCC, CWMLDMC, CWMLNC (lg transformed), CWMLS, CWMSLA (lg transformed) indicate community weighted mean of plant height, leaf carbon content, leaf dry matter content, leaf nitrogen content, leaf size and specific leaf area, respectively. *, ** and *** indicate p = 0.05, 0.01 and 0.001, respectively.
| 回归方程Regression equation | R2 | p | |
|---|---|---|---|
| 草甸 Meadow | lgW = 2.735 + 0.967 (0.785) lgCWMH -1.378 (0.348) lgCWMSLA | 0.747 | <0.001 |
| 沼泽 Marsh | lgW = 4.724 + 0.655 (0.546) lgFDLDMC -0.226 (0.345) pH | 0.442 | <0.001 |
| 全部 Total | lgW = 1.877 + 0.569 (0.582) lgFDLS + 0.291 (0.242) lgFDLDMC + 0.891 (0.961) lgCWMH -0.04 (0.768) CWMLS -0.212 (0.223) FDSLA | 0.702 | <0.002 |
表4 群落地上生物量与多样性的逐步回归方程
Table 4 Stepwise regression equations of community aboveground biomass and diversity
| 回归方程Regression equation | R2 | p | |
|---|---|---|---|
| 草甸 Meadow | lgW = 2.735 + 0.967 (0.785) lgCWMH -1.378 (0.348) lgCWMSLA | 0.747 | <0.001 |
| 沼泽 Marsh | lgW = 4.724 + 0.655 (0.546) lgFDLDMC -0.226 (0.345) pH | 0.442 | <0.001 |
| 全部 Total | lgW = 1.877 + 0.569 (0.582) lgFDLS + 0.291 (0.242) lgFDLDMC + 0.891 (0.961) lgCWMH -0.04 (0.768) CWMLS -0.212 (0.223) FDSLA | 0.702 | <0.002 |
| 指标 Item | 草甸 Meadow | 沼泽 Marsh | |||||
|---|---|---|---|---|---|---|---|
| 自由度 df | F检验 F-test | 显著性 Sig. | 自由度 df | F检验 F-test | 显著性 Sig. | ||
| CWMH | 29 | 23.633 | < 0.001 | 21 | 0.927 | 0.411 | |
| CWMLCC | 29 | 8.148 | 0.002 | 21 | 4.903 | 0.018 | |
| CWMLDMC | 29 | 7.304 | 0.003 | 21 | 10.494 | 0.001 | |
| CWMLignin | 29 | 3.841 | 0.033 | 21 | 18.966 | < 0.001 | |
| CWMLNC | 29 | 5.162 | 0.012 | 21 | 14.541 | < 0.001 | |
| CWMLS | 29 | 71.731 | < 0.001 | 21 | 1.528 | 0.240 | |
| CWMSLA | 29 | 8.082 | 0.002 | 21 | 1.161 | 0.332 | |
| FDH | 29 | 3.179 | 0.056 | 21 | 7.791 | 0.003 | |
| FDLCC | 29 | 10.642 | < 0.001 | 21 | 2.717 | 0.089 | |
| FDLDMC | 29 | 14.909 | < 0.001 | 21 | 14.043 | < 0.001 | |
| FDLignin | 29 | 11.241 | < 0.001 | 21 | 19.152 | < 0.001 | |
| FDLNC | 29 | 9.414 | 0.001 | 21 | 2.301 | 0.125 | |
| FDLS | 29 | 29.094 | < 0.001 | 21 | 50.351 | < 0.001 | |
| FDSLA | 29 | 8.701 | 0.001 | 21 | 10.245 | 0.001 | |
表3 草甸和沼泽不同群落间功能多样性的方差分析
Table 3 Summary of ANOVA on functional diversity among meadow and marsh plant communities
| 指标 Item | 草甸 Meadow | 沼泽 Marsh | |||||
|---|---|---|---|---|---|---|---|
| 自由度 df | F检验 F-test | 显著性 Sig. | 自由度 df | F检验 F-test | 显著性 Sig. | ||
| CWMH | 29 | 23.633 | < 0.001 | 21 | 0.927 | 0.411 | |
| CWMLCC | 29 | 8.148 | 0.002 | 21 | 4.903 | 0.018 | |
| CWMLDMC | 29 | 7.304 | 0.003 | 21 | 10.494 | 0.001 | |
| CWMLignin | 29 | 3.841 | 0.033 | 21 | 18.966 | < 0.001 | |
| CWMLNC | 29 | 5.162 | 0.012 | 21 | 14.541 | < 0.001 | |
| CWMLS | 29 | 71.731 | < 0.001 | 21 | 1.528 | 0.240 | |
| CWMSLA | 29 | 8.082 | 0.002 | 21 | 1.161 | 0.332 | |
| FDH | 29 | 3.179 | 0.056 | 21 | 7.791 | 0.003 | |
| FDLCC | 29 | 10.642 | < 0.001 | 21 | 2.717 | 0.089 | |
| FDLDMC | 29 | 14.909 | < 0.001 | 21 | 14.043 | < 0.001 | |
| FDLignin | 29 | 11.241 | < 0.001 | 21 | 19.152 | < 0.001 | |
| FDLNC | 29 | 9.414 | 0.001 | 21 | 2.301 | 0.125 | |
| FDLS | 29 | 29.094 | < 0.001 | 21 | 50.351 | < 0.001 | |
| FDSLA | 29 | 8.701 | 0.001 | 21 | 10.245 | 0.001 | |
| [1] |
Aarssen LW (1997). High productivity in grassland ecosystems: effected by species diversity or productive species? Oikos, 80, 183-184.
DOI URL |
| [2] | Bao SD (2005). Soil Agrochemical Analysis. Chinese Agriculture Press, Beijing. 30-34. (in Chinese) |
| [ 鲍士旦 (2005). 土壤农化分析. 中国农业出版社, 北京. 30-34.] | |
| [3] |
Cadotte MW, Cavender-Bares J, Tilman D, Oakley TH (2009). Using phylogenetic, functional and trait diversity to understand patterns of plant community productivity. PLoS ONE, 4, e5695.
DOI URL PMID |
| [4] | Callaway JC, Sullivan G, Zedler JB (2003). Species-rich plantings increase biomass and nitrogen accumulation in a wetland restoration experiment. Ecology Application, 13, 1626-1639. |
| [5] | Chanteloup P, Bonis A (2013). Functional diversity in root and above-ground traits in a fertile grassland shows a detrimental effect on productivity. Basic and Applied Ecology, 14, 208-216. |
| [6] | Cornelissen JHC, Kavorel S, Garnier E, Díaz S, Buchmann N, Gurvich DE, Reich PB, ter Steege H, Morgan HD, van der Heijden MGA, Pausas JG, Poorter H (2003). A handbook of protocols for standardized and easy measurements of plant functional traits worldwide. Annals of Botany, 51, 335-380. |
| [7] | de Bello F, Lepš J, Sebastià MT (2006). Variations in species and functional plant diversity along climatic and grazing gradients. Ecography, 29, 801-810. |
| [8] | Díaz S, Cabido M (2001). Vive la difference: plant functional diversity matters to ecosystem processes. Trends in Ecology & Evolution, 16, 646-655. |
| [9] | Dukat B (2005). Rao’s quadratic entropy as a measure of functional diversity based on multiple traits. Journal of Vegetation Science, 16, 533-540. |
| [10] | Dukes JS (2001). Productivity and complementarity in grassland microcosms of varying diversity. Oikos, 94, 468-480. |
| [11] | Garnier E, Cortez J, Billès G, Navas M, Roumet C, Debussche M, Laurent G, Blanchard A, Aubry D, Bellmann A, Neill C, Toussaint JP (2004). Plant functional markers capture ecosystem properties during secondary succession. Ecology, 85, 2630-2637. |
| [12] | Grime JP (1997). Biodiversity and ecosystem function: the debate deepens. Science, 277, 1260-1261. |
| [13] | Grime JP (1998). Benefits of plant diversity to ecosystems: immediate, filter and founder effects. Journal of Ecology, 86, 902-910. |
| [14] | Hector A, Beale AJ, Minns A, Otway SJ, Lawton JH (2000). Consequences of the reduction of plant diversity for litter decomposition: effects through litter quality and microenvironment. Oikos, 90, 357-371. |
| [15] | Hector A, Schmid B, Beierkuhnlein C, Caldeira MC, Diemer M, Dimitrakopoulos PG, Finn JA, Freitas H, Giller PS, Good J, Harris R, Högberg P, Huss-Danell K, Joshi J, Jumpponen A, Körner C, Leadley PW, Loreau M, Minns A, Mulder CPH, Donovan GO, Otway SJ, Pereira JS, Prinz A, Read DJ, Scherer-Lorenzen M, Schulze ED, Siamantziouras ASD, Spehn EM, Terry AC, Troumbis AY, Woodward FI, Yachi S, Lawton JH (1999). Plant diversity and productivity experiments in European grasslands. Science, 286, 1123-1127. |
| [16] | Hooper DU (1998). The role of complementarity and competition in ecosystem responses to variation in plant diversity. Ecology, 79, 704-719. |
| [17] | Hooper DU, Solan M, Symstad AJ, Díaz S, Gessner MO, Buchmann N, Degrande V, Grime JP, Hulot FD, Mermillod- Blondin F, Roy J, Spehn EM, van Peer L (2002). Species Diversity, Functional Diversity, and Ecosystem Functioning. Oxford University Press, Oxford. |
| [18] | Hooper DU, Vitousek PM (1997). The effects of plant composition and diversity on ecosystem processes. Science, 277, 1302-1305. |
| [19] | Hooper DU, Vitousek PM (1998). Effects of plant composition and diversity on nutrient cycling. Ecology Monograph, 68, 121-149. |
| [20] |
Huston MA (1997). Hidden treatments in ecological experiments: re-evaluating the ecosystem function of biodiversity. Oecologia, 110, 449-460.
DOI URL PMID |
| [21] | Iiyama K, Wallis AFA (1990). Determination of lignin in herbaceous plants by an improved acetyl bromide procedure. Journal of the Science of Food and Agriculture, 51, 145-161. |
| [22] | Jiang XL, Zhang WG, Wang G (2007). Effects of different components of diversity on productivity in artificial plant communities. Ecological Research, 22, 629-634. |
| [23] | Jones RM, Hargreaves JNG (1979). Improvements to the dry-weight-rank method for measuring botanical composition. Grass and Forage Science, 34, 181-189. |
| [24] | Lepš J, de Bello F, Lavorel S, Berman S (2006). Quantifying and interpreting functional diversity of natural communities: practical considerations matter. Preslia, 78, 481-501. |
| [25] | Li XG, Zhu ZH, Zhou XS, Yuan FR, Fan RJ, Xu ML (2011). Effects of clipping, fertilizing and watering on the relationship between species diversity, functional diversity and primary productivity in alpine meadow of China. Chinese Journal of Plant Ecology, 35, 1136-1147. (in Chinese with English abstract) |
| [ 李晓刚, 朱志红, 周晓松, 袁芙蓉, 樊瑞俭, 许曼丽 (2011). 刈割、施肥和浇水对高寒草甸物种多样性、功能多样性与初级生产力关系的影响. 植物生态学报, 35, 1136-1147.] | |
| [26] |
Loreau M, Naeem S, Inchausti P, Bengtsson J, Grime JP, Hector A, Hooper DU, Huston MA, Raffaelli D, Schmid B, Tilman D, Wardle DA (2001). Biodiversity and ecosystem functioning: current knowledge and future challenges. Science, 294, 804-808.
DOI URL PMID |
| [27] | Mannetje L, Haydock KP (1963). The dry-weight-rank method for the botanical analysis of pasture. Journal of the British Grassland Society, 18, 268-275. |
| [28] | Meng TT, Ni J, Wang GH (2007). Plant functional traits, environment and ecosystem functioning. Journal of Plant Ecology (Chinese Version), 31, 150-165. (in Chinese with English abstract) |
| [ 孟婷婷, 倪健, 王国宏 (2007). 植物功能性状与环境和生态系统功能. 植物生态学报, 31, 150-165.] | |
| [29] | Mittelbach GG, Steiner CF, Scheiner SM, Gross KL, Reynoldes HL, Waide RB, Willig MR, Dodson SI, Gough L (2001). What is the observed relationship between species richness and productivity? Ecology, 82, 2381-2396. |
| [30] | Mokany K, Ash J, Rxburgh S (2008). Functional identity is more important than diversity in influencing ecosystem processes in a temperate native grassland. Journal of Ecology, 96, 884-893. |
| [31] | Petchey OL, Gaston KJ (2002). Functional diversity (FD), species richness, and community composition. Ecology Letters, 5, 402-411. |
| [32] | Petchey OL, Hector A, Gaston KJ (2004). How do different measures of functional diversity perform? Ecology, 85, 847-857. |
| [33] |
Roscher C, Schumacher J, Gubsch M, Lipowsky A, Weigelt A, Buchmann N, Schmid B, Schulze ED (2012). Using plant functional traits to explain diversity-productivity relationships. PLoS ONE, 7, e36760.
URL PMID |
| [34] | Roscher C, Temperton VM, Scherer-Lorenzen M, Schmitz M, Schumacher J, Schmid B, Buchmann N, Weisser WW, Ernst-Detlef S (2005). Overyielding in experimental grassland communities irrespective of species pool or spatial scale. Ecology Letters, 8, 419-429. |
| [35] | Schellberg J, Pontes L da S (2012). Plant functional traits and nutrient gradients on grassland. Grass and Forage Science, 67, 305-319. |
| [36] | Schulze ED, Mooney HA (1994). Biodiversity and Ecosystem Function. Springer, New York. |
| [37] | Shannon CE, Weaver W (1971). The Mathematical Theory of Communication. University of Illinois Press, Urbana. |
| [38] | Tilman D (1997). Distinguishing between the effects of species diversity and species composition. Oikos, 80, 185. |
| [39] | Tilman D (2001). Functional diversity. Encyclopedia of Biodiversity, 3, 109-120. |
| [40] |
Wacker L, Baudois O, Eichenberger-Glinz S, Schmid B (2009). Diversity effects in early- and mid-successional species pools along a nitrogen gradient. Ecology, 90, 637-648.
DOI URL PMID |
| [41] | Walker B, Kinzig A, Langridge J (1999). Plant attribute diversity, resilience, and ecosystem function: the nature and significance of dominant and minor species. Ecosystems, 2, 95-113. |
| [42] |
Xiao Y, Xie GD, An K, Lu CX (2012). A research framework of ecosystem services based on functional traits. Chinese Journal of Plant Ecology, 36, 353-362. (in Chinese with English abstract)
DOI URL |
|
[ 肖玉, 谢高地, 安凯, 鲁春霞 (2012). 基于功能性状的生态系统服务研究框架. 植物生态学报, 36, 353-362.]
DOI URL |
|
| [43] | Zang YM, Zhu ZH, Li YN, Wang WJ, Xi B (2009). Effects of species diversity and functional diversity on primary productivity of alpine meadow. Chinese Journal of Ecology, 28, 999-1005. (in Chinese with English abstract) |
| [ 臧岳铭, 朱志红, 李英年, 王文娟, 席博 (2009). 高寒矮嵩草草甸物种多样性与功能多样性对初级生产力的影响. 生态学杂志, 28, 999-1005.] |
| [1] | 蔡慧颖 李兰慧 林阳 梁亚涛 杨光 孙龙. 白桦叶片和细根非结构性碳水化合物对火后时间的响应[J]. 植物生态学报, 2024, 48(预发表): 0-0. |
| [2] | 张中扬, 宋希强, 任明迅, 张哲. 附生维管植物生境营建作用的生态学功能[J]. 植物生态学报, 2023, 47(7): 895-911. |
| [3] | 杨佳绒, 戴冬, 陈俊芳, 吴宪, 刘啸林, 刘宇. 丛枝菌根真菌多样性对植物群落构建和稀有种维持的研究进展[J]. 植物生态学报, 2023, 47(6): 745-755. |
| [4] | 张琦, 冯可, 常智慧, 何双辉, 徐维启. 灌丛化对林草交错带植物和土壤微生物的影响[J]. 植物生态学报, 2023, 47(6): 770-781. |
| [5] | 冯可, 刘冬梅, 张琦, 安菁, 何双辉. 旅游干扰对松山油松林土壤微生物多样性及群落结构的影响[J]. 植物生态学报, 2023, 47(4): 584-596. |
| [6] | 李耀琪, 王志恒. 植物功能生物地理学的研究进展与展望[J]. 植物生态学报, 2023, 47(2): 145-169. |
| [7] | 马和平, 王瑞红, 屈兴乐, 袁敏, 慕金勇, 李金航. 不同生境对藏东南地面生苔藓多样性和生物量的影响[J]. 植物生态学报, 2022, 46(5): 552-560. |
| [8] | 田佳玉, 王彬, 张志明, 林露湘. 光谱多样性在植物多样性监测与评估中的应用[J]. 植物生态学报, 2022, 46(10): 1129-1150. |
| [9] | 李孝龙, 周俊, 彭飞, 钟宏韬, Hans LAMBERS. 植物养分捕获策略随成土年龄的变化及生态学意义[J]. 植物生态学报, 2021, 45(7): 714-727. |
| [10] | 孙浩哲, 王襄平, 张树斌, 吴鹏, 杨蕾. 阔叶红松林不同演替阶段凋落物产量及其稳定性的影响因素[J]. 植物生态学报, 2021, 45(6): 594-605. |
| [11] | 姜鑫, 牛克昌. 青藏高原禾草混播对土壤微生物多样性的影响[J]. 植物生态学报, 2021, 45(5): 539-551. |
| [12] | 石娇星, 许洺山, 方晓晨, 郑丽婷, 张宇, 鲍迪峰, 杨安娜, 阎恩荣. 中国东部海岛黑松群落功能多样性的纬度变异及其影响因素[J]. 植物生态学报, 2021, 45(2): 163-173. |
| [13] | 井新, 贺金生. 生物多样性与生态系统多功能性和多服务性的关系: 回顾与展望[J]. 植物生态学报, 2021, 45(10): 1094-1111. |
| [14] | 李周园, 叶小洲, 王少鹏. 生态系统稳定性及其与生物多样性的关系[J]. 植物生态学报, 2021, 45(10): 1127-1139. |
| [15] | 李耀琪, 王志恒. 植物叶片形态的生态功能、地理分布与成因[J]. 植物生态学报, 2021, 45(10): 1154-1172. |
| 阅读次数 | ||||||
|
全文 |
|
|||||
|
摘要 |
|
|||||
Copyright © 2026 版权所有 《植物生态学报》编辑部
地址: 北京香山南辛村20号, 邮编: 100093
Tel.: 010-62836134, 62836138; Fax: 010-82599431; E-mail: apes@ibcas.ac.cn, cjpe@ibcas.ac.cn
备案号: 京ICP备16067583号-19
![]()