
植物生态学报 ›› 2014, Vol. 38 ›› Issue (6): 599-607.DOI: 10.3724/SP.J.1258.2014.00055
马玉珠,程栋梁( ),钟全林,靳冰洁,林江铭,卢宏典,郭炳桥
收稿日期:2013-11-19
接受日期:2014-05-15
出版日期:2014-11-19
发布日期:2014-06-10
通讯作者:
程栋梁
基金资助:
MA Yu-Zhu,CHENG Dong-Liang(),ZHONG Quan-Lin,JIN Bing-Jie,LIN Jiang-Ming,LU Hong-Dian,GUO Bing-Qiao
Received:2013-11-19
Accepted:2014-05-15
Online:2014-11-19
Published:2014-06-10
Contact:
CHENG Dong-Liang
摘要:
West、Brown和Enquist提出的植物分形网络模型(简称WBE模型)认为: 植物的分支指数(1/a, 1/b)决定植物的代谢指数, 当分支指数1/a、1/b分别为理论值2.0、3.0时, 代谢速率与个体大小的3/4次幂成正比, 但是恒定的3/4代谢指数并不能全面地反映植物的代谢情况。基于分支指数的协同变化, Price、Enquist和Savage对WBE模型进行扩展, 提出植物分支参数协同变化模型(简称PES模型)。该文借助于PES模型分析了7种木本植物的分支指数和代谢指数。结果表明: 物种间叶面积与叶生物量呈异速生长关系, 基于叶面积得到的分支指数1/a和代谢指数θ在物种间无显著差异, 基于叶生物量得到的分支指数1/a、1/b和代谢指数θ在物种间均存在显著差异, 但基于叶面积和叶生物量分别拟合出的整体分支指数1/a、1/b和代谢指数θ与理论值均无显著差异, 且用叶面积作为代谢速率的替代指标比用叶生物量分析得出的代谢指数与理论值更接近。今后研究应当关注植物叶面积与叶生物量的异速生长关系对植物代谢速率及相关功能特性的影响。
马玉珠,程栋梁,钟全林,靳冰洁,林江铭,卢宏典,郭炳桥. 7种木本植物的分支指数与代谢指数. 植物生态学报, 2014, 38(6): 599-607. DOI: 10.3724/SP.J.1258.2014.00055
MA Yu-Zhu,CHENG Dong-Liang,ZHONG Quan-Lin,JIN Bing-Jie,LIN Jiang-Ming,LU Hong-Dian,GUO Bing-Qiao. Branching and metabolic exponents in seven woody plants. Chinese Journal of Plant Ecology, 2014, 38(6): 599-607. DOI: 10.3724/SP.J.1258.2014.00055
| 物种 Species | 数量 n | 胸径范围 DBH range (cm) | 树高范围 Tree height range (m) | 地上生物量范围 Aboveground biomass range (kg) | 茎生物量范围 Stem biomass range (kg) | 叶生物量范围 Leaf biomass range (kg) | 叶面积范围 Leaf area range (m2) |
|---|---|---|---|---|---|---|---|
| Acer rubrum | 11 | 6-52 | 10-34 | 11-2 387 | 9-1 801 | 0.4-22.4 | 6-311 |
| Betula lenta | 10 | 8-40 | 13-28 | 15-1 520 | 14-979 | 0.2-18.6 | 10-309 |
| 北美鹅掌楸 Liriodendron tulipifera | 10 | 10-56 | 14-40 | 27-2 256 | 24-1 982 | 0.8-16.7 | 16-266 |
| Oxydendrum arboreum | 8 | 4-35 | 5-21 | 2-416 | 2-329 | 0.2-4.4 | 5-71 |
| Quercus alba | 10 | 7-63 | 8-32 | 10-2 740 | 6-2 343 | 0.7-43.8 | 16-443 |
| Quercus prinus | 10 | 11-58 | 12-30 | 27-2 990 | 22-2 614 | 1.1-28.2 | 15-289 |
| Quercus rubra | 9 | 20-52 | 12-29 | 24-1 750 | 22-1 340 | 0.8-40.7 | 11-444 |
表1 研究树木信息
Table 1 Information of the trees studied
| 物种 Species | 数量 n | 胸径范围 DBH range (cm) | 树高范围 Tree height range (m) | 地上生物量范围 Aboveground biomass range (kg) | 茎生物量范围 Stem biomass range (kg) | 叶生物量范围 Leaf biomass range (kg) | 叶面积范围 Leaf area range (m2) |
|---|---|---|---|---|---|---|---|
| Acer rubrum | 11 | 6-52 | 10-34 | 11-2 387 | 9-1 801 | 0.4-22.4 | 6-311 |
| Betula lenta | 10 | 8-40 | 13-28 | 15-1 520 | 14-979 | 0.2-18.6 | 10-309 |
| 北美鹅掌楸 Liriodendron tulipifera | 10 | 10-56 | 14-40 | 27-2 256 | 24-1 982 | 0.8-16.7 | 16-266 |
| Oxydendrum arboreum | 8 | 4-35 | 5-21 | 2-416 | 2-329 | 0.2-4.4 | 5-71 |
| Quercus alba | 10 | 7-63 | 8-32 | 10-2 740 | 6-2 343 | 0.7-43.8 | 16-443 |
| Quercus prinus | 10 | 11-58 | 12-30 | 27-2 990 | 22-2 614 | 1.1-28.2 | 15-289 |
| Quercus rubra | 9 | 20-52 | 12-29 | 24-1 750 | 22-1 340 | 0.8-40.7 | 11-444 |
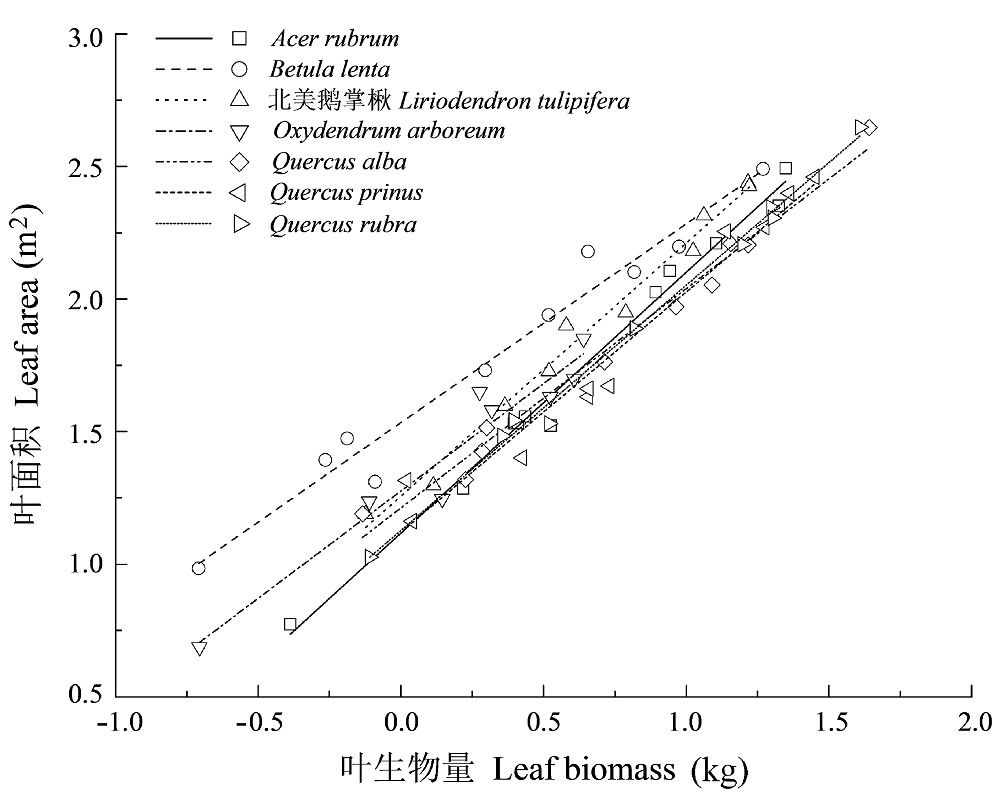
图1 不同物种叶面积和叶生物量的异速关系。
Fig. 1 The allometric relationships between leaf area and leaf biomass for different species.
| 物种 Species | n | 叶面积∝叶生物量 Leaf area ∝leaf biomass | 地上生物量∝茎生物量 Aboveground biomass ∝stem biomass | ||||
|---|---|---|---|---|---|---|---|
| 斜率(95%置信区间) Slope (95% CI ) | R2 | p_1.0 | 斜率(95%置信区间) Slope (95% CI ) | R2 | p_1.0 | ||
| Acer rubrum | 11 | 0.99a (0.92, 1.07) | 0.989** | 0.756 | 1.01 (0.98, 1.03) | 0.999** | 0.637 |
| Betula lenta | 10 | 0.76c (0.66, 0.88) | 0.968** | 0.002 | 1.06 (1.02, 1.10) | 0.998** | 0.011 |
| 北美鹅掌楸 Liriodendron tulipifera | 10 | 0.96a (0.87, 1.06) | 0.986** | 0.365 | 0.99 (0.96, 1.02) | 0.999** | 0.416 |
| Oxydendrum arboreum | 8 | 0.84ab (0.65, 1.07) | 0.937** | 0.129 | 0.98 (0.94, 1.02) | 0.998** | 0.216 |
| Quercus alba | 10 | 0.83bc (0.75, 0.93) | 0.983** | 0.004 | 0.97 (0.92, 1.01) | 0.997** | 0.134 |
| Quercus prinus | 10 | 0.92ab (0.79, 1.08) | 0.962** | 0.274 | 1.02 (0.95, 1.10) | 0.992** | 0.580 |
| Quercus rubra | 9 | 0.93ab (0.87, 0.99) | 0.995** | 0.030 | 1.01 (0.96, 1.07) | 0.996** | 0.637 |
| 全部 All | 68 | 0.86 (0.80, 0.92) | 0.916** | <0.001 | 1.00 (0.98, 1.01) | 0.996** | 0.786 |
表2 不同物种叶面积与叶生物量、地上生物量与茎生物量的异速关系比较
Table 2 Comparison of the scaling relationships of leaf area versus leaf biomass and aboveground biomass versus stem biomass in different species
| 物种 Species | n | 叶面积∝叶生物量 Leaf area ∝leaf biomass | 地上生物量∝茎生物量 Aboveground biomass ∝stem biomass | ||||
|---|---|---|---|---|---|---|---|
| 斜率(95%置信区间) Slope (95% CI ) | R2 | p_1.0 | 斜率(95%置信区间) Slope (95% CI ) | R2 | p_1.0 | ||
| Acer rubrum | 11 | 0.99a (0.92, 1.07) | 0.989** | 0.756 | 1.01 (0.98, 1.03) | 0.999** | 0.637 |
| Betula lenta | 10 | 0.76c (0.66, 0.88) | 0.968** | 0.002 | 1.06 (1.02, 1.10) | 0.998** | 0.011 |
| 北美鹅掌楸 Liriodendron tulipifera | 10 | 0.96a (0.87, 1.06) | 0.986** | 0.365 | 0.99 (0.96, 1.02) | 0.999** | 0.416 |
| Oxydendrum arboreum | 8 | 0.84ab (0.65, 1.07) | 0.937** | 0.129 | 0.98 (0.94, 1.02) | 0.998** | 0.216 |
| Quercus alba | 10 | 0.83bc (0.75, 0.93) | 0.983** | 0.004 | 0.97 (0.92, 1.01) | 0.997** | 0.134 |
| Quercus prinus | 10 | 0.92ab (0.79, 1.08) | 0.962** | 0.274 | 1.02 (0.95, 1.10) | 0.992** | 0.580 |
| Quercus rubra | 9 | 0.93ab (0.87, 0.99) | 0.995** | 0.030 | 1.01 (0.96, 1.07) | 0.996** | 0.637 |
| 全部 All | 68 | 0.86 (0.80, 0.92) | 0.916** | <0.001 | 1.00 (0.98, 1.01) | 0.996** | 0.786 |
| 物种 Species | 估测值 Estimated values | 计算值 Calculated values | |||||
|---|---|---|---|---|---|---|---|
| 叶面积∝胸径 Leaf area ∝DBH | 叶面积∝树高 Leaf area ∝height | 叶面积∝地上生物量 Leaf area ∝aboveground biomass | 1/(2a+b) | ||||
| 分支半径指数1/a (95%置信区间) Branching radius exponent 1/a (95% CI) | p_2.0 | 分支长度指数1/b (95%置信区间) Branching length exponent 1/b (95% CI) | p_3.0 | 代谢指数θ (95%置信区间) Metabolic exponent θ (95% CI) | p_0.75 | 代谢指数θ (95%置信区间) Metabolic exponent θ (95% CI) | |
| Acer rubrum | 1.82 (1.52, 2.17) | 0.257 | 3.31ab (2.51, 4.38) | 0.446 | 0.70 (0.58, 0.86) | 0.500 | 0.71 (0.58, 0.87) |
| Betula lenta | 2.04 (1.76, 2.37) | 0.753 | 4.75a (3.53, 6.39) | 0.007 | 0.74 (0.66, 0.84) | 0.888 | 0.84 (0.70, 1.00) |
| 北美鹅掌楸 Liriodendron tulipifera | 2.03 (1.50, 2.75) | 0.919 | 3.24ab (2.21, 4.74) | 0.664 | 0.77 (0.55, 1.06) | 0.880 | 0.77 (0.56, 1.07) |
| Oxydendrum arboreum | 1.32 (1.07, 1.64) | 0.003 | 1.86c (1.21, 2.88) | 0.036 | 0.51 (0.40, 0.64) | 0.006 | 0.49 (0.37, 0.64) |
| Quercus alba | 1.65 (1.01, 2.70) | 0.412 | 2.57bc (1.62, 4.07) | 0.470 | 0.63 (0.41, 0.97) | 0.381 | 0.62 (0.38, 1.01) |
| Quercus prinus | 2.23 (1.62, 3.08) | 0.467 | 3.95ab (2.39, 6.54) | 0.257 | 0.76 (0.57, 1.02) | 0.906 | 0.87 (0.60, 1.25) |
| Quercus rubra | 2.27 (1.69, 3.04) | 0.346 | 3.85ab (2.17, 6.84) | 0.357 | 0.86 (0.61, 1.19) | 0.390 | 0.88 (0.61, 1.24) |
| 全部 All | 1.87 (1.69, 2.07) | 0.190 | 2.98 (2.57, 3.45) | 0.916 | 0.70 (0.64, 0.77) | 0.188 | 0.71 (0.63, 0.80) |
表3 基于叶面积得到的7个物种分支指数估测值、代谢指数估测值及计算值
Table 3 Estimated values of branching exponents, and estimated and calculated values of metabolic exponent based on leaf area for seven species
| 物种 Species | 估测值 Estimated values | 计算值 Calculated values | |||||
|---|---|---|---|---|---|---|---|
| 叶面积∝胸径 Leaf area ∝DBH | 叶面积∝树高 Leaf area ∝height | 叶面积∝地上生物量 Leaf area ∝aboveground biomass | 1/(2a+b) | ||||
| 分支半径指数1/a (95%置信区间) Branching radius exponent 1/a (95% CI) | p_2.0 | 分支长度指数1/b (95%置信区间) Branching length exponent 1/b (95% CI) | p_3.0 | 代谢指数θ (95%置信区间) Metabolic exponent θ (95% CI) | p_0.75 | 代谢指数θ (95%置信区间) Metabolic exponent θ (95% CI) | |
| Acer rubrum | 1.82 (1.52, 2.17) | 0.257 | 3.31ab (2.51, 4.38) | 0.446 | 0.70 (0.58, 0.86) | 0.500 | 0.71 (0.58, 0.87) |
| Betula lenta | 2.04 (1.76, 2.37) | 0.753 | 4.75a (3.53, 6.39) | 0.007 | 0.74 (0.66, 0.84) | 0.888 | 0.84 (0.70, 1.00) |
| 北美鹅掌楸 Liriodendron tulipifera | 2.03 (1.50, 2.75) | 0.919 | 3.24ab (2.21, 4.74) | 0.664 | 0.77 (0.55, 1.06) | 0.880 | 0.77 (0.56, 1.07) |
| Oxydendrum arboreum | 1.32 (1.07, 1.64) | 0.003 | 1.86c (1.21, 2.88) | 0.036 | 0.51 (0.40, 0.64) | 0.006 | 0.49 (0.37, 0.64) |
| Quercus alba | 1.65 (1.01, 2.70) | 0.412 | 2.57bc (1.62, 4.07) | 0.470 | 0.63 (0.41, 0.97) | 0.381 | 0.62 (0.38, 1.01) |
| Quercus prinus | 2.23 (1.62, 3.08) | 0.467 | 3.95ab (2.39, 6.54) | 0.257 | 0.76 (0.57, 1.02) | 0.906 | 0.87 (0.60, 1.25) |
| Quercus rubra | 2.27 (1.69, 3.04) | 0.346 | 3.85ab (2.17, 6.84) | 0.357 | 0.86 (0.61, 1.19) | 0.390 | 0.88 (0.61, 1.24) |
| 全部 All | 1.87 (1.69, 2.07) | 0.190 | 2.98 (2.57, 3.45) | 0.916 | 0.70 (0.64, 0.77) | 0.188 | 0.71 (0.63, 0.80) |
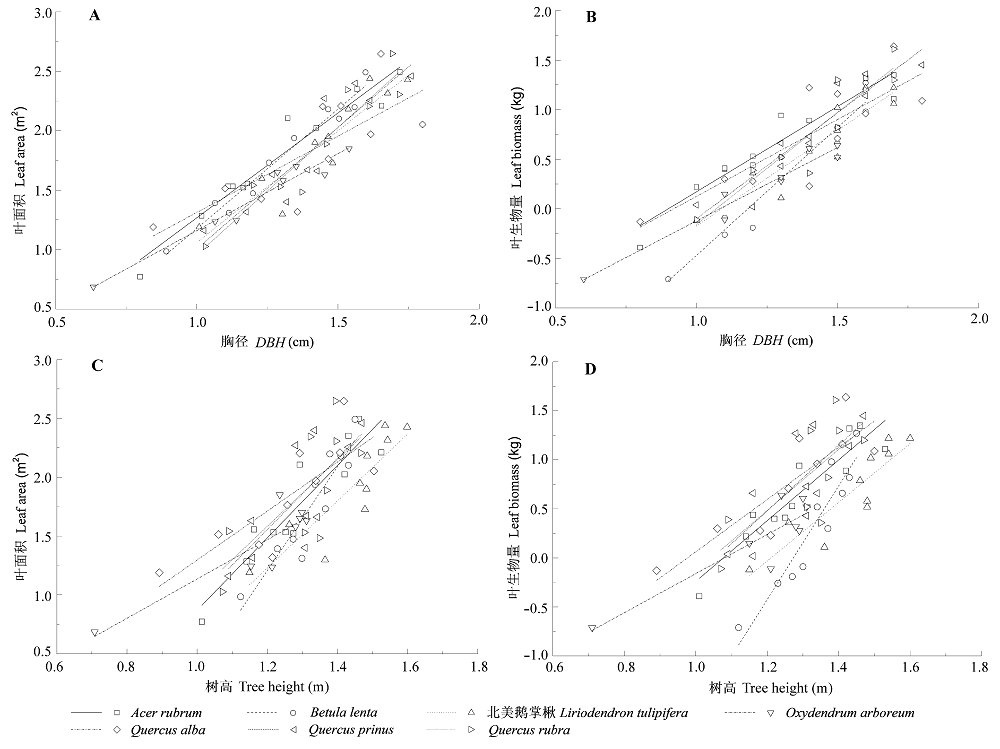
图2 基于叶面积和叶生物量获得的分支指数。A, 叶面积∝胸径。B, 叶生物量∝胸径。C, 叶面积∝树高。D, 叶生物量∝树高。
Fig. 2 Branching exponents based on leaf area and leaf biomass. A, leaf area ∝diameter at breast height (DBH). B, leaf biomass ∝DBH. C, leaf area ∝tree height. D, leaf biomass ∝tree height.
| 物种 Species | 估测值 Estimated values | 计算值 Calculated values | |||||
|---|---|---|---|---|---|---|---|
| 叶生物量∝胸径 Leaf biomass ∝DBH | 叶生物量∝树高 Leaf biomass ∝tree height | 叶生物量∝地上生物量 Leaf biomass ∝aboveground biomass | 1/(2a+b) | ||||
| 分支半径指数1/a (95%置信区间) Branching radius exponent 1/a (95% CI) | p_2.0 | 分支长度指数1/b (95%置信区间) Branching length exponent 1/b (95% CI) | p_3.0 | 代谢指数θ (95%置信区间) Metabolic exponent θ (95% CI) | p_0.75 | 代谢指数θ (95%置信区间) Metabolic exponent θ (95% CI) | |
| Acer rubrum | 1.79bc (1.45, 2.20) | 0.257 | 3.32bc (2.54, 4.36) | 0.419 | 0.71bc (0.58, 0.88) | 0.591 | 0.70 (0.56, 0.88) |
| Betula lenta | 2.65a (2.20, 3.20) | 0.008 | 6.18a (4.68, 8.15) | < 0.001 | 0.98a (0.86, 1.11) | 0.001 | 1.09 (0.89, 1.34) |
| 北美鹅掌楸 Liriodendron tulipifera | 2.10abc (1.53, 2.89) | 0.737 | 3.35bc (2.34, 4.80) | 0.505 | 0.80abc (0.59, 1.08) | 0.651 | 0.80 (0.58, 1.11) |
| Oxydendrum arboreum | 1.51c (1.22, 1.88) | 0.018 | 2.25c (1.44, 3.51) | 0.170 | 0.61c (0.51, 0.73) | 0.030 | 0.57 (0.43, 0.74) |
| Quercus alba | 1.87abc (1.20, 2.92) | 0.753 | 3.07bc (2.07, 4.55) | 0.902 | 0.75abc (0.53, 1.08) | 0.984 | 0.72 (0.47, 1.11) |
| Quercus prinus | 2.28ab (1.72, 3.02) | 0.324 | 4.31ab (2.63, 7.07) | 0.135 | 0.83abc (0.62, 1.11) | 0.477 | 0.90 (0.65, 1.24) |
| Quercus rubra | 2.42ab (1.76, 3.33) | 0.204 | 4.13abc (2.37, 7.21) | 0.232 | 0.92ab (0.68, 1.26) | 0.162 | 0.94 (0.64, 1.35) |
| 全部 All | 2.13 (1.91, 2.37) | 0.260 | 3.48 (2.95, 4.09) | 0.077 | 0.82 (0.75, 0.91) | 0.061 | 0.81 (0.72, 0.92) |
表4 基于叶生物量得到的7个物种分支指数估测值、代谢指数估测值及其计算值
Table 4 Estimated values of branching exponent, and estimated and calculated values of metabolic exponent based on leaf biomass for different species
| 物种 Species | 估测值 Estimated values | 计算值 Calculated values | |||||
|---|---|---|---|---|---|---|---|
| 叶生物量∝胸径 Leaf biomass ∝DBH | 叶生物量∝树高 Leaf biomass ∝tree height | 叶生物量∝地上生物量 Leaf biomass ∝aboveground biomass | 1/(2a+b) | ||||
| 分支半径指数1/a (95%置信区间) Branching radius exponent 1/a (95% CI) | p_2.0 | 分支长度指数1/b (95%置信区间) Branching length exponent 1/b (95% CI) | p_3.0 | 代谢指数θ (95%置信区间) Metabolic exponent θ (95% CI) | p_0.75 | 代谢指数θ (95%置信区间) Metabolic exponent θ (95% CI) | |
| Acer rubrum | 1.79bc (1.45, 2.20) | 0.257 | 3.32bc (2.54, 4.36) | 0.419 | 0.71bc (0.58, 0.88) | 0.591 | 0.70 (0.56, 0.88) |
| Betula lenta | 2.65a (2.20, 3.20) | 0.008 | 6.18a (4.68, 8.15) | < 0.001 | 0.98a (0.86, 1.11) | 0.001 | 1.09 (0.89, 1.34) |
| 北美鹅掌楸 Liriodendron tulipifera | 2.10abc (1.53, 2.89) | 0.737 | 3.35bc (2.34, 4.80) | 0.505 | 0.80abc (0.59, 1.08) | 0.651 | 0.80 (0.58, 1.11) |
| Oxydendrum arboreum | 1.51c (1.22, 1.88) | 0.018 | 2.25c (1.44, 3.51) | 0.170 | 0.61c (0.51, 0.73) | 0.030 | 0.57 (0.43, 0.74) |
| Quercus alba | 1.87abc (1.20, 2.92) | 0.753 | 3.07bc (2.07, 4.55) | 0.902 | 0.75abc (0.53, 1.08) | 0.984 | 0.72 (0.47, 1.11) |
| Quercus prinus | 2.28ab (1.72, 3.02) | 0.324 | 4.31ab (2.63, 7.07) | 0.135 | 0.83abc (0.62, 1.11) | 0.477 | 0.90 (0.65, 1.24) |
| Quercus rubra | 2.42ab (1.76, 3.33) | 0.204 | 4.13abc (2.37, 7.21) | 0.232 | 0.92ab (0.68, 1.26) | 0.162 | 0.94 (0.64, 1.35) |
| 全部 All | 2.13 (1.91, 2.37) | 0.260 | 3.48 (2.95, 4.09) | 0.077 | 0.82 (0.75, 0.91) | 0.061 | 0.81 (0.72, 0.92) |
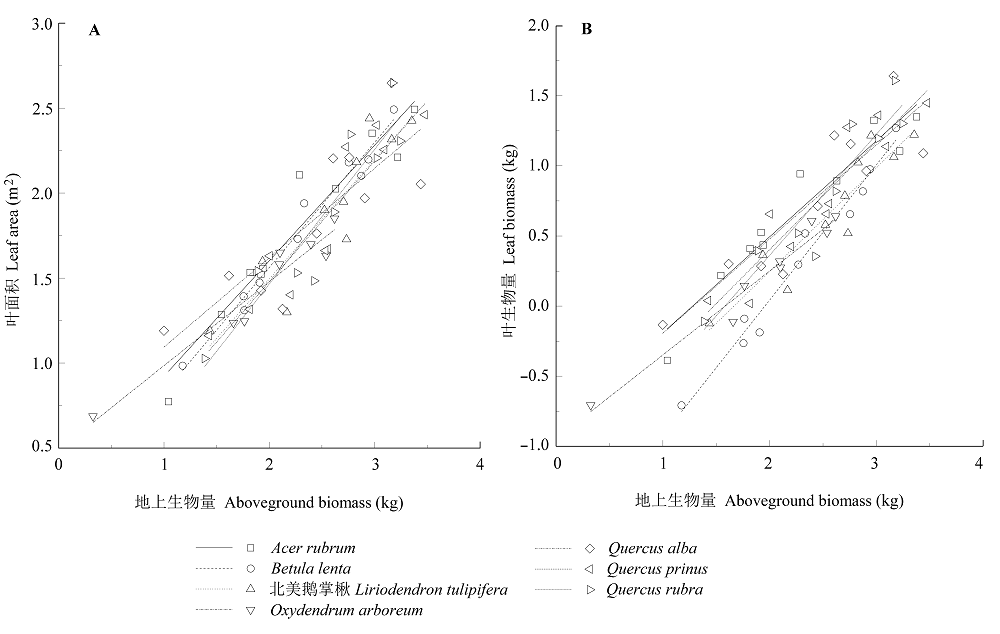
图3 基于叶面积和叶生物量获得的代谢指数。A, 叶面积∝地上生物量。B, 叶生物量∝地上生物量。
Fig. 3 Metabolic exponents based on leaf area and leaf biomass. A, leaf area ∝aboveground biomass. B, leaf biomass ∝aboveground biomass.
| [1] |
Ackerly DD, Knight CA, Weiss SB, Barton K, Starmer KP (2002). Leaf size, specific leaf area and microhabitat distribution of chaparral woody plants: contrasting patterns in species level and community level analyses. Oecologia, 130, 449-457.
URL PMID |
| [2] |
Bentley LP, Stegen JC, Savage VM, Smith DD, von Allmen EI, Sperry JS, Reich PB, Enquist BJ (2013). An empirical assessment of tree branching networks and implications for plant allometric scaling models. Ecology Letters, 16, 1069-1078.
URL PMID |
| [3] |
Brown JH, Gillooly JF, Allen AP, Savage VM, West GB (2004). Toward a metabolic theory of ecology. Ecology, 85, 1771-1789.
DOI URL |
| [4] |
Cheng DL, Li T, Zhong QL, Wang GX (2010). Scaling relationship between tree respiration rates and biomass. Biology Letters, 6, 715-717.
URL PMID |
| [5] | Deng JM, Wang GX, Wei XP (2006). The advance of metabolic regulation studies for macroscopical ecology processes. Acta Ecologica Sinica, 26, 3413-3423. (in Chinese with English abstract) |
| [ 邓建明, 王根轩, 魏小平 (2006). 宏观生态过程的代谢调控研究进展. 生态学报, 26, 3413-3423.] | |
| [6] |
Enquist BJ, Allen AP, Brown JH, Gillooly JF, Kerkhoff AJ, Niklas KJ, Price CA, West GB (2007). Biological scaling: Does the exception prove the rule? Nature, 445, E9-E10.
URL PMID |
| [7] |
Enquist BJ, Brown JH, West GB (1998). Allometric scaling of plant energetics and population density. Nature, 395, 163-165.
DOI URL |
| [8] |
Enquist BJ, Niklas KJ (2002). Global allocation rules for patterns of biomass partitioning in seed plants. Science, 295, 1517-1520.
DOI URL PMID |
| [9] |
Enquist BJ, West GB, Charnov EL, Brown JH (1999). Allometric scaling of production and life-history variation in vascular plants. Nature, 401, 907-911.
DOI URL |
| [10] | Falster DS, Warton DI, Wright IJ (2003). (S)MATR: Standardised major axis tests and routines. http://www.bio.mq.edu.au/ecology/SMATR. Cited 2013-05-09. |
| [11] |
Glazier DS (2005). Beyond the ‘3/4-power law’: variation in the intra-and interspecific scaling of metabolic rate in animals. Biological Reviews, 80, 611-662.
URL PMID |
| [12] |
Glazier DS (2006). The 3/4-power law is not universal: evolution of isometric, ontogenetic metabolic scaling in pelagic animals. BioScience, 56, 325-332.
DOI URL |
| [13] |
Glazier DS (2010). A unifying explanation for diverse metabolic scaling in animals and plants. Biological Reviews, 85, 111-138.
DOI URL PMID |
| [14] |
Koontz TL, Petroff A, West GB, Brown JH (2009). Scaling relations for a functionally two-dimensional plant: Chamaesyce setiloba (Euphorbiaceae). American Journal of Botany, 96, 877-884.
DOI URL PMID |
| [15] |
Li HT, Han XG, Wu JG (2005). Lack of evidence for 3/4 scaling of metabolism in terrestrial plants. Journal of Integrative Plant Biology, 47, 1173-1183.
DOI URL |
| [16] |
Mäkelä A, Valentine HT (2006). Crown ratio influences allometric scaling in trees. Ecology, 87, 2967-2972.
URL PMID |
| [17] |
Martin JG, Kloeppel BD, Schaefer TL, Kimbler DL, McNulty SG (1998). Aboveground biomass and nitrogen allocation of ten deciduous southern Appalachian tree species. Canadian Journal of Forest Research, 28, 1648-1659.
DOI URL |
| [18] |
Mori S, Yamaji K, Ishida A, Prokushkin SG, Masyagina OV, Hagihara A, Hoque ATMR, Suwa R, Osawa A, Nishizono T, Ueda T, Kinjo M, Miyagi T, Kajimoto T, Koike T, Matsuura Y, Toma T, Zyryanova OA, Abaimov AP, Awaya Y, Araki MG, Kawasaki T, Chiba Y, Umari M (2010). Mixed-power scaling of whole-plant respiration from seedings to giant trees. Proceedings of the National Academy of Sciences of the United States of America, 107, 1447-1451.
URL PMID |
| [19] |
Niklas KJ, Cobb ED (2008). Evidence for “diminishing returns” from the scaling of stem diameter and specific leaf area. American Journal of Botany, 95, 549-557.
DOI URL PMID |
| [20] |
Niklas KJ, Cobb ED, Niinemets Ü, Reich PB, Sellin A, Shipley B, Wright IJ (2007). “Diminishing returns” in the scaling of functional leaf traits across and within species groups. Proceedings of the National Academy of Sciences of the United States of America, 104, 8891-8896.
DOI URL PMID |
| [21] | Niklas KJ, Enquist BJ (2001). Invariant scaling relationships for interspecific plant biomass production rates and body size. Proceeding of the National Academy of Sciences of the United States of America, 98, 2922-2927. |
| [22] |
Pan S, Liu C, Zhang WP, Xu SS, Wang N, Li Y, Gao J, Wang Y, Wang GX (2013). The scaling relationships between leaf mass and leaf area of vascular plant species change with altitude. PLoS ONE, 8, e76872.
DOI URL PMID |
| [23] |
Peng YH, Niklas KJ, Reich PB, Sun SC (2010). Ontogenetic shift in the scaling of dark respiration with whole-plant mass in seven shrub species. Functional Ecology, 24, 502-512.
DOI URL |
| [24] |
Price CA, Enquist BJ, Savage VM (2007). A general model for allometric covariation in botanical form and function. Proceedings of the National Academy of Sciences of the United States of America, 104, 13204-13209.
DOI URL PMID |
| [25] |
Price CA, Ogle K, White EP, Weitz JS (2009). Evaluating scaling models in biology using hierarchical Bayesian approaches. Ecology Letters, 12, 641-651.
DOI URL PMID |
| [26] |
Reich PB, Tjoelker MG, Machado JL, Oleksyn J (2006). Universal scaling of respiratory metabolism, size and nitrogen in plants. Nature, 439, 457-461.
DOI URL PMID |
| [27] |
Savage VM, Deeds EJ, Fontana W (2008). Sizing up allometric scaling theory. PLoS Computational Biology, 4, e1000171.
URL PMID |
| [28] | Wang JF, Feng YL (2004). The effect of light intensity on biomass allocation, leaf morphology and relative growth rate of two invasive plants. Acta Phytoecologica Sinica, 28, 781-786. (in Chinese with English abstract) |
| [ 王俊峰, 冯玉龙 (2004). 光强对两种入侵植物生物量分配、叶片形态和相对生长速率的影响. 植物生态学报, 28, 781-786.] | |
| [29] |
Warton DI, Wright IJ, Falster DS, Westoby M (2006). Bivariate line-fitting methods for allometry. Biological Reviews, 81, 259-291.
DOI URL PMID |
| [30] |
West GB, Brown JH, Enquist BJ (1997). A general model for the origin of allometric scaling laws in biology. Science, 276, 122-126.
URL PMID |
| [31] |
West GB, Brown JH, Enquist BJ (1999a). A general model for the structure and allometry of plant vascular systems. Nature, 400, 664-667.
DOI URL |
| [32] |
West GB, Brown JH, Enquist BJ (1999b). The fourth dimension of life: fractal geometry and allometric scaling of organisms. Science, 284, 1677-1679.
URL PMID |
| [33] |
Wright IJ, Reich PB, Westoby M, Ackerly DD, Baruch Z, Bongers F, Cavender-Bares J, Chapin T, Cornelissen JHC, Diemer M, Flexas J, Garnier E, Groom PK, Gulias J, Hikosaka K, Lamont BB, Lee T, Lee W, Lusk C, Midgley JJ, Navas ML, Niinemets Ü, Oleksyn J, Osada N, Poorter H, Poot P, Prior L, Pyankov VI, Roumet C, Thomas SC, Tjoelker MG, Veneklaas EJ, Villar R (2004). The worldwide leaf economics spectrum. Nature, 428, 821-827.
URL PMID |
| [1] | 刘艳杰, 刘玉龙, 王传宽, 王兴昌. 东北温带森林5个羽状复叶树种叶成本-效益关系比较[J]. 植物生态学报, 2023, 47(11): 1540-1550. |
| [2] | 王广亚, 陈柄华, 黄雨晨, 金光泽, 刘志理. 着生位置对水曲柳小叶性状变异及性状间相关性的影响[J]. 植物生态学报, 2022, 46(6): 712-721. |
| [3] | 李露, 金光泽, 刘志理. 阔叶红松林3种阔叶树种柄叶性状变异与相关性[J]. 植物生态学报, 2022, 46(6): 687-699. |
| [4] | 熊映杰, 于果, 魏凯璐, 彭娟, 耿鸿儒, 杨冬梅, 彭国全. 天童山阔叶木本植物叶片大小与叶脉密度及单位叶脉长度细胞壁干质量的关系[J]. 植物生态学报, 2022, 46(2): 136-147. |
| [5] | 郑周涛, 张扬建. 1982-2018年青藏高原水分利用效率变化及归因分析[J]. 植物生态学报, 2022, 46(12): 1486-1496. |
| [6] | 刘超, 李平, 武运涛, 潘胜难, 贾舟, 刘玲莉. 一种基于数码相机图像和群落冠层结构调查的草地地上生物量估算方法[J]. 植物生态学报, 2022, 46(10): 1280-1288. |
| [7] | 刘兵兵, 魏建新, 胡天宇, 杨秋丽, 刘小强, 吴发云, 苏艳军, 郭庆华. 卫星遥感监测产品在中国森林生态系统的验证和不确定性分析——基于海量无人机激光雷达数据[J]. 植物生态学报, 2022, 46(10): 1305-1316. |
| [8] | 董楠, 唐明明, 崔文倩, 岳梦瑶, 刘洁, 黄玉杰. 不同根系分隔方式对栗和茶幼苗生长的影响[J]. 植物生态学报, 2022, 46(1): 62-73. |
| [9] | 尹晓雷, 刘旭阳, 金强, 李先德, 林少颖, 阳祥, 王维奇, 张永勋. 不同管理模式对茶树碳氮磷含量及其生态化学计量比的影响[J]. 植物生态学报, 2021, 45(7): 749-759. |
| [10] | 张自琰, 金光泽, 刘志理. 不同区域针叶年龄对红松叶性状及相关关系的影响[J]. 植物生态学报, 2021, 45(3): 253-264. |
| [11] | 杨克彤, 常海龙, 陈国鹏, 俞筱押, 鲜骏仁. 兰州市主要绿化植物气孔性状特征[J]. 植物生态学报, 2021, 45(2): 187-196. |
| [12] | 黄松宇, 贾昕, 郑甲佳, 杨睿智, 牟钰, 袁和第. 中国典型陆地生态系统波文比特征及影响因素[J]. 植物生态学报, 2021, 45(2): 119-130. |
| [13] | 邢磊, 段娜, 李清河, 刘成功, 李慧卿, 孙高洁. 白刺不同物候期的生物量分配规律[J]. 植物生态学报, 2020, 44(7): 763-771. |
| [14] | 秦天姿, 任安芝, 樊晓雯, 高玉葆. 内生真菌种类和母本基因型对内生真菌-禾草共生体叶形状和叶面积的影响[J]. 植物生态学报, 2020, 44(6): 654-660. |
| [15] | 熊星烁, 蔡宏宇, 李耀琪, 马文红, 牛克昌, 陈迪马, 刘娜娜, 苏香燕, 景鹤影, 冯晓娟, 曾辉, 王志恒. 内蒙古典型草原植物叶片碳氮磷化学计量特征的季节动态[J]. 植物生态学报, 2020, 44(11): 1138-1153. |
| 阅读次数 | ||||||||||||||||||||||||||||||||||||||||||||||||||
|
全文 3675
|
|
|||||||||||||||||||||||||||||||||||||||||||||||||
|
摘要 1334
|
|
|||||||||||||||||||||||||||||||||||||||||||||||||
Copyright © 2022 版权所有 《植物生态学报》编辑部
地址: 北京香山南辛村20号, 邮编: 100093
Tel.: 010-62836134, 62836138; Fax: 010-82599431; E-mail: apes@ibcas.ac.cn, cjpe@ibcas.ac.cn
备案号: 京ICP备16067583号-19 51La