
植物生态学报 ›› 2017, Vol. 41 ›› Issue (5): 519-528.DOI: 10.17521/cjpe.2016.0381
所属专题: 稳定同位素生态学
李亚飞1,2,3,4, 于静洁1,5,*, 陆凯1,4, 王平1, 张一驰1, 杜朝阳1
出版日期:2017-05-10
发布日期:2017-06-22
通讯作者:
于静洁
作者简介:* 通信作者Author for correspondence (E-mail:基金资助:Ya-Fei LI1,2,3,4, Jing-Jie YU1,5,*, Kai LU1,4, Ping WANG1, Yi-Chi ZHANG1, Chao-Yang DU1
Online:2017-05-10
Published:2017-06-22
Contact:
Jing-Jie YU
About author:KANG Jing-yao(1991-), E-mail: 摘要:
为研究黑河下游额济纳三角洲典型河岸带植物胡杨(Populus euphratica)和多枝柽柳(Tamarix ramosissima)的水分来源及其时空变化特征, 于2015-2016年植物生长期在额济纳东、西河沿岸选取8处样点, 分别采集胡杨和多枝柽柳木质部、土壤以及降水、河水、地下水样品, 分析测试获取各样品的氧稳定同位素比率(δ18O), 并利用氧同位素直接对比法确定植物主要吸水层位, 利用IsoSource线性混合模型确定胡杨和多枝柽柳水分来源构成及比例。研究表明: 河水和地下水为胡杨和多枝柽柳的主要补给水源, 降水补给因雨水少且入渗浅可忽略不计; 胡杨和多枝柽柳吸收土壤水的层位因地下水位波动、土壤物理特性、河水对土壤水的侧向补给及漫溢补给等存在较大的空间差异, 但其利用河水和地下水的比例未见明显空间差异; 胡杨更多地利用河水(68%), 而多枝柽柳更多地利用地下水(65%); 植物水分来源对生态输水工程响应敏感, 河水贡献率在输水期增大至84%和48%, 非输水期下降至63%和30%, 地下水贡献率在输水期下降至16%和52%, 非输水期增大至37%和70%。值得指出的是, 河岸带地下水与河水交互作用强烈, 导致地下水与河水的δ18O较为接近, 使得源分解析定量具有不确定性。
李亚飞, 于静洁, 陆凯, 王平, 张一驰, 杜朝阳. 额济纳三角洲胡杨和多枝柽柳水分来源解析. 植物生态学报, 2017, 41(5): 519-528. DOI: 10.17521/cjpe.2016.0381
Ya-Fei LI, Jing-Jie YU, Kai LU, Ping WANG, Yi-Chi ZHANG, Chao-Yang DU. Water sources of Populus euphratica and Tamarix ramosissima in Ejina Delta, the lower reaches of the Heihe River, China. Chinese Journal of Plant Ecology, 2017, 41(5): 519-528. DOI: 10.17521/cjpe.2016.0381
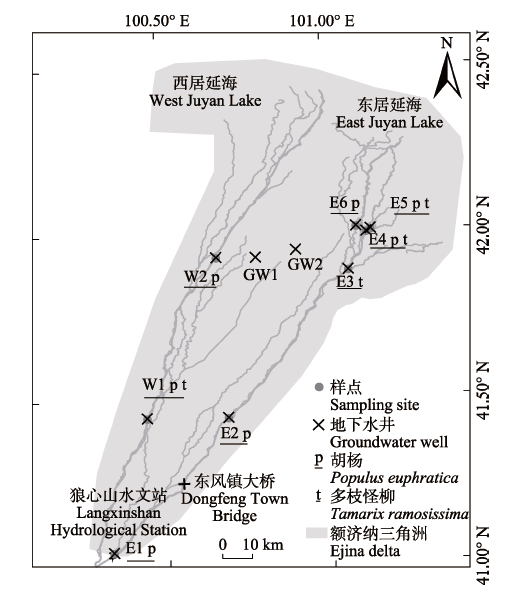
图1 研究区位置及样点。图中所标示各地点地理坐标如下: 东风镇大桥(100.55° E, 41.25° N), E1 (100.33° E, 41.04° N), E2 (100.69° E, 41.44° N), E3 (101.07° E, 41.88° N), E4 (101.12° E, 41.99° N), E5 (101.14° E, 42.00° N), E6 (101.09° E, 42.01° N), GW1 (100.79° E, 41.92° N), GW2 (100.91° E, 41.94° N), 狼心山水文站(100.32° E, 41.04° N), W1 (100.44° E, 41.44° N), W2 (100.67° E, 41.92° N)。
Fig. 1 Location of the study area and sampling sites. The coordinates of the sites in the figure are as follows: Dongfeng Town Bridge (100.55° E, 41.25° N), E1 (100.33° E, 41.04° N), E2 (100.69° E, 41.44° N), E3 (101.07° E, 41.88° N), E4 (101.12° E, 41.99° N), E5 (101.14° E, 42.00° N), E6 (101.09° E, 42.01° N), GW1 (100.79° E, 41.92° N), GW2 (100.91° E, 41.94° N), Langxinshan Hydrological Station (100.32° E, 41.04° N), W1 (100.44° E, 41.44° N), W2 (100.67° E, 41.92° N).
| 样点 Sampling site | 土壤埋深 Soil depth (cm) | 土壤质地 Soil texture | 样点 Sampling site | 土壤埋深 Soil depth (cm) | 土壤质地 Soil texture |
|---|---|---|---|---|---|
| E1 | 0-80 | 砂土 Sand | E5 | 0-50 | 粉壤土 Silt loam |
| 80-85 | 壤质砂土 Loamy sand | 50-100 | 壤土 Loam | ||
| 85-90 | 砂土 Sand | 100-130 | 粉壤土 Silt loam | ||
| 90-100 | 细砂 Fine sand | E6 | 0-30 | 壤质细砂 Loamy fine sand | |
| 100-130 | 砂土 Sand | 30-90 | 细砂 Fine sand | ||
| 130-170 | 细砂 Fine sand | 90-120 | 砂黏土 Sandy clay | ||
| 170-185 | 砂壤土 Sandy loam | 120-160 | 细砂 Fine sand | ||
| 185-200 | 壤质砂土 Loamy sand | 160-180 | 壤土 Loam | ||
| E2 | 0-20 | 壤质细砂 Loamy fine sand | 180-210 | 砂土 Sand | |
| 20-50 | 细砂壤土 Fine sandy loam | 210-230 | 黏土 Clay | ||
| 50-70 | 极细砂壤土 Very fine sandy loam | 230-320 | 细砂 Fine sand | ||
| 70-100 | 粉壤土 Silt loam | W1 | 0-90 | 壤质砂土 Loamy sand | |
| 100-200 | 砂土 Sand | 90-110 | 壤质粗砂 Loamy coarse sand | ||
| E3 | 0-30 | 粉壤土 Silt loam | 110-130 | 砂土 Sand | |
| 30-80 | 细砂壤土 Very fine sandy loam | 130-160 | 粗砂 Coarse sand | ||
| 80-105 | 细砂 Fine sand | 160-210 | 砂土 Sand | ||
| 105-220 | 粗砂 Coarse sand | W2 | 0-60 | 壤质砂土 Loamy sand | |
| E4 | 0-15 | 细砂壤土 Fine sandy loam | 60-80 | 砂土 Sand | |
| 15-60 | 砂壤土 Very fine sandy loam | 80-120 | 粉壤土 Silt loam | ||
| 60-120 | 粉壤土 Silt loam | 120-200 | 砂土 Sand | ||
| 120-170 | 砂土 Sand | 200-210 | 粗砂 Coarse sand | ||
| 210-230 | 壤质砂土 Loamy sand | ||||
| 230-260 | 粗砂 Coarse sand |
表1 各样点土壤质地剖面
Table 1 Soil textural profiles at each sampling site
| 样点 Sampling site | 土壤埋深 Soil depth (cm) | 土壤质地 Soil texture | 样点 Sampling site | 土壤埋深 Soil depth (cm) | 土壤质地 Soil texture |
|---|---|---|---|---|---|
| E1 | 0-80 | 砂土 Sand | E5 | 0-50 | 粉壤土 Silt loam |
| 80-85 | 壤质砂土 Loamy sand | 50-100 | 壤土 Loam | ||
| 85-90 | 砂土 Sand | 100-130 | 粉壤土 Silt loam | ||
| 90-100 | 细砂 Fine sand | E6 | 0-30 | 壤质细砂 Loamy fine sand | |
| 100-130 | 砂土 Sand | 30-90 | 细砂 Fine sand | ||
| 130-170 | 细砂 Fine sand | 90-120 | 砂黏土 Sandy clay | ||
| 170-185 | 砂壤土 Sandy loam | 120-160 | 细砂 Fine sand | ||
| 185-200 | 壤质砂土 Loamy sand | 160-180 | 壤土 Loam | ||
| E2 | 0-20 | 壤质细砂 Loamy fine sand | 180-210 | 砂土 Sand | |
| 20-50 | 细砂壤土 Fine sandy loam | 210-230 | 黏土 Clay | ||
| 50-70 | 极细砂壤土 Very fine sandy loam | 230-320 | 细砂 Fine sand | ||
| 70-100 | 粉壤土 Silt loam | W1 | 0-90 | 壤质砂土 Loamy sand | |
| 100-200 | 砂土 Sand | 90-110 | 壤质粗砂 Loamy coarse sand | ||
| E3 | 0-30 | 粉壤土 Silt loam | 110-130 | 砂土 Sand | |
| 30-80 | 细砂壤土 Very fine sandy loam | 130-160 | 粗砂 Coarse sand | ||
| 80-105 | 细砂 Fine sand | 160-210 | 砂土 Sand | ||
| 105-220 | 粗砂 Coarse sand | W2 | 0-60 | 壤质砂土 Loamy sand | |
| E4 | 0-15 | 细砂壤土 Fine sandy loam | 60-80 | 砂土 Sand | |
| 15-60 | 砂壤土 Very fine sandy loam | 80-120 | 粉壤土 Silt loam | ||
| 60-120 | 粉壤土 Silt loam | 120-200 | 砂土 Sand | ||
| 120-170 | 砂土 Sand | 200-210 | 粗砂 Coarse sand | ||
| 210-230 | 壤质砂土 Loamy sand | ||||
| 230-260 | 粗砂 Coarse sand |
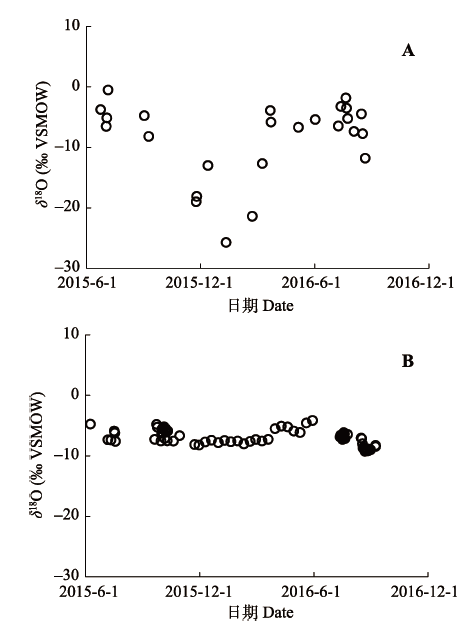
图2 研究区降水(A)与河水(B)的氧稳定同位素比率(δ18O)。VSMOW, 维也纳标准平均海水。
Fig. 2 The stable oxygen isotope ratio (δ18O) of rainwater (A) and stream water (B) in the study area. VSMOW, Vienna standard mean ocean water.
| 日期 Date | 样点 Spot | δ18O (‰) | 日期 Date | 样点 Spot | δ18O (‰) |
|---|---|---|---|---|---|
| 2016-5-31 | E1 | -7.39 | 2015-8-16 | E5 | -6.29 |
| 2015-7-22 | E2 | -5.94 | 2015-9-13 | E5 | -6.69 |
| 2015-8-16 | E2 | -5.39 | 2015-8-16 | E6 | -5.56 |
| 2015-9-13 | E2 | -5.60 | 2016-5-29 | E6 | -7.02 |
| 2016-5-31 | E2 | -6.94 | 2015-7-21 | E6 | -6.47 |
| 2015-8-16 | E3 | -5.73 | 2015-9-13 | E6 | -6.12 |
| 2015-9-13 | E3 | -5.57 | 2016-5-31 | GW1 | -9.84 |
| 2016-5-30 | E3 | -6.96 | 2016-5-31 | GW2 | -9.84 |
| 2015-7-19 | E4 | -5.77 | 2016-5-31 | W1 | -5.95 |
| 2015-8-16 | E4 | -7.35 | 2016-5-31 | W2 | -7.08 |
| 2015-9-13 | E4 | -5.22 |
表2 研究区地下水的氧稳定同位素比率(δ18O)
Table 2 The stable oxygen isotope ratio (δ18O) of groundwater in the study area
| 日期 Date | 样点 Spot | δ18O (‰) | 日期 Date | 样点 Spot | δ18O (‰) |
|---|---|---|---|---|---|
| 2016-5-31 | E1 | -7.39 | 2015-8-16 | E5 | -6.29 |
| 2015-7-22 | E2 | -5.94 | 2015-9-13 | E5 | -6.69 |
| 2015-8-16 | E2 | -5.39 | 2015-8-16 | E6 | -5.56 |
| 2015-9-13 | E2 | -5.60 | 2016-5-29 | E6 | -7.02 |
| 2016-5-31 | E2 | -6.94 | 2015-7-21 | E6 | -6.47 |
| 2015-8-16 | E3 | -5.73 | 2015-9-13 | E6 | -6.12 |
| 2015-9-13 | E3 | -5.57 | 2016-5-31 | GW1 | -9.84 |
| 2016-5-30 | E3 | -6.96 | 2016-5-31 | GW2 | -9.84 |
| 2015-7-19 | E4 | -5.77 | 2016-5-31 | W1 | -5.95 |
| 2015-8-16 | E4 | -7.35 | 2016-5-31 | W2 | -7.08 |
| 2015-9-13 | E4 | -5.22 |
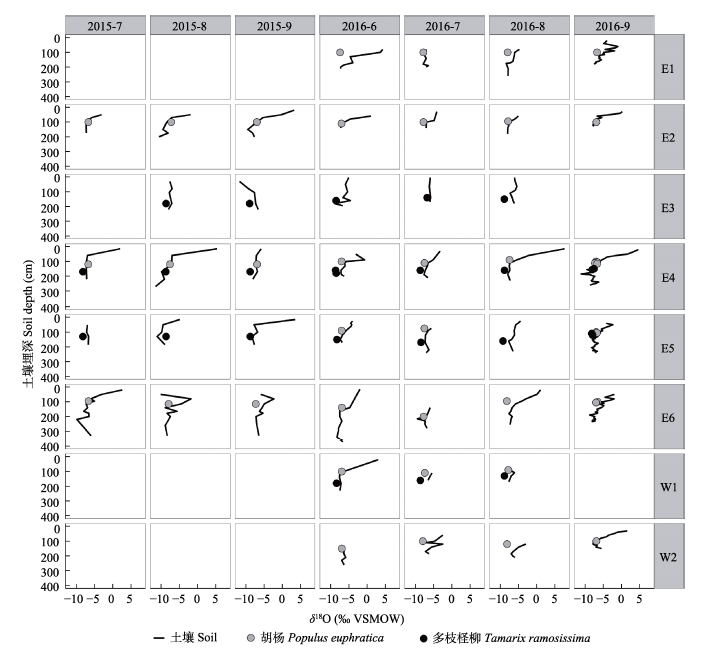
图3 各样点土壤植物木质部水分的氧稳定同位素比率(δ18O)。各样点地理坐标见图1。VSMOW, 维也纳标准平均海水。
Fig. 3 The stable oxygen isotope ratio (δ18O) of soil moisture and plant xylem water at each sampling site. The coordinates of each sampling site are the same as in Fig.1. “VSMOW” is the abbreviation of “Vienna standard mean ocean water”.
| 样点1) Sampling site1) | 植物主要吸水层位 Dominant soil depths of root water uptake 2) (cm) | ||||||
|---|---|---|---|---|---|---|---|
| 2015-7 | 2015-8 | 2015-9 | 2016-6 | 2016-7 | 2016-8 | 2016-9 | |
| E1 | \ | \ | \ | 130-210 | 80-200 | 80-260 | 120-180 |
| E2 | 100-175 | 100-200 | 70-200 | 80-140 | 90-140 | 80-180 | 80-130 |
| E3 | 30-220 | 80-220 | 50-195 | 5-170 | 25-180 | \ | |
| E4 | 60-220 | 60-270 | 60-220 | 100-200 | 110-210 | 110-230 | 100-260 |
| E5 | 50-185 | 50-185 | 50-185 | 90-170 | 75-240 | 90-230 | 110-240 |
| E6 | 80-330 | 115-330 | 115-330 | 140-370 | 140-280 | 115-255 | 100-235 |
| W1 | \ | \ | \ | 100-230 | 110-230 | 90-? | \ |
| W2 | \ | \ | \ | 150-260 | 100-185 | 170-210 | 100-150 |
表3 各样点胡杨和多枝柽柳的主要吸水层位
Table 3 Dominant soil depths of root water uptake by Populus euphratica and Tamarix ramosissima at each sampling site
| 样点1) Sampling site1) | 植物主要吸水层位 Dominant soil depths of root water uptake 2) (cm) | ||||||
|---|---|---|---|---|---|---|---|
| 2015-7 | 2015-8 | 2015-9 | 2016-6 | 2016-7 | 2016-8 | 2016-9 | |
| E1 | \ | \ | \ | 130-210 | 80-200 | 80-260 | 120-180 |
| E2 | 100-175 | 100-200 | 70-200 | 80-140 | 90-140 | 80-180 | 80-130 |
| E3 | 30-220 | 80-220 | 50-195 | 5-170 | 25-180 | \ | |
| E4 | 60-220 | 60-270 | 60-220 | 100-200 | 110-210 | 110-230 | 100-260 |
| E5 | 50-185 | 50-185 | 50-185 | 90-170 | 75-240 | 90-230 | 110-240 |
| E6 | 80-330 | 115-330 | 115-330 | 140-370 | 140-280 | 115-255 | 100-235 |
| W1 | \ | \ | \ | 100-230 | 110-230 | 90-? | \ |
| W2 | \ | \ | \ | 150-260 | 100-185 | 170-210 | 100-150 |
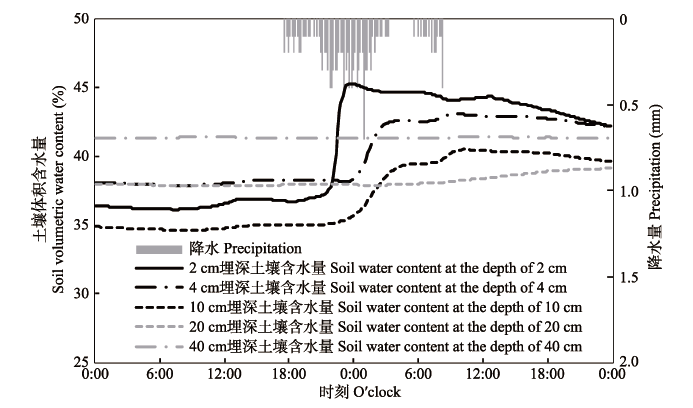
图4 样点E5 (101.14° E, 42.00° N)的10 min降水与土壤含水量变化(2015-9-9-2015-9-10)。
Fig. 4 Dynamics of 10-min-gridded precipitation and soil water content at Site E5 (101.14° E, 42.00° N) (2015-9-9-2015-9-10).
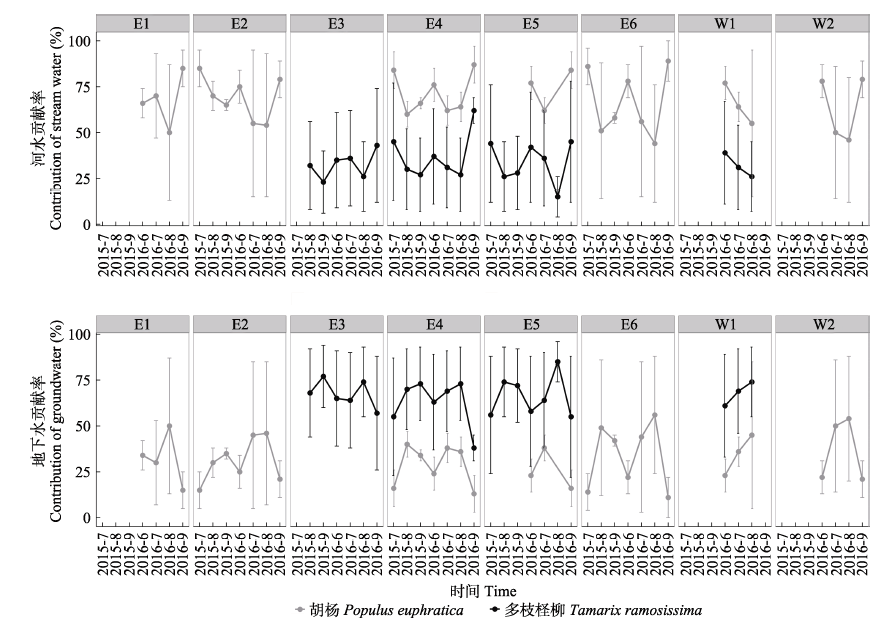
图5 河水与地下水对胡杨和多枝柽柳的贡献率。误差棒代表最小值和最大值。各样点地理坐标见图1。
Fig. 5 Proportional contribution (%) of stream water and groundwater to the water sources of Populus euphratica and Tamarix ramosissima respectively. Bars indicate the minimum and maximum values. The coordinates of each sampling site are the same as in Fig.1.
| [1] | Chen XL, Chen YN, Chen YP (2014). Relationship among water use of different plants in Heihe River riparian forests.Chinese Journal of Eco-Agriculture, 22, 972-979. (in Chinese with English abstract)[陈小丽, 陈亚宁, 陈亚鹏 (2014). 黑河下游荒漠河岸林植物水分利用关系研究. 中国生态农业学报, 22, 972-979.] |
| [2] | Chu JM (2007). Studies on Selective Utilization of Water by Plants in Aridland Region. PhD dissertation, Chinese Academy of Forestry, Beijing. (in Chinese with English abstract)[褚建民 (2007). 干旱区植物的水分选择性利用研究. 博士学位论文, 中国林业科学研究院, 北京.] |
| [3] | Du CY (2016). Simulation for Coupled Water-Vapor-Air-Heat Flow Transport in Vadose Zone and Estimation of Groundwater Evaporation in Arid Region—A Case Study of Ejina Delta. PhD dissertation, University of Chinese Academy of Sciences, Beijing. (in Chinese with English abstract)[杜朝阳 (2016). 干旱区包气带水-汽-气热耦合模拟及潜水蒸发估算——以额济纳三角洲为例. 博士学位论文, 中国科学院大学, 北京.] |
| [4] | Ehleringer J, Dawson T (1992). Water uptake by plants: Perspectives from stable isotope composition.Plant, Cell & Environment, 15, 1073-1082. |
| [5] | Ehleringer JR, Phillips SL, Schuster WS, Sandquist DR (1991). Differential utilization of summer rains by desert plants.Oecologia, 88, 430-434. |
| [6] | Gong GL, Chen H, Duan DY (2011). Comparison of the methods using stable hydrogen and oxygen isotope to distinguish the water source ofNitraria tangutorum. Acta Ecologica Sinica, 31, 7533-7541. (in Chinese with English abstract)[巩国丽, 陈辉, 段德玉 (2011). 利用稳定氢氧同位素定量区分白刺水分来源的方法比较. 生态学报, 31, 7533-7541.] |
| [7] | Huxman TE, Smith MD, Fay PA, Knapp AK, Shaw MR, Loik ME, Smith SD, Tissue DT, Zak JC, Weltzin JF (2004). Convergence across biomes to a common rain-use efficiency.Nature, 429, 651-654. |
| [8] | Li X, Cheng G, Liu S, Xiao Q, Ma M, Jin R, Che T, Liu Q, Wang W, Qi Y (2013). Heihe watershed allied telemetry experimental research (HiWATER): Scientific objectives and experimental design.Bulletin of the American Meteorological Society, 94, 1145-1160. |
| [9] | Liu SM, Xu ZW, Wang WZ, Jia ZZ, Zhu MJ, Bai J, Wang JM (2011). A comparison of eddy-covariance and large aperture scintillometer measurements with respect to the energy balance closure problem.Hydrology and Earth System Sciences, 15, 1291-1306. |
| [10] | Meng XJ, Wen XF, Zhang XY, Han JJ, Sun XM, Li XB (2012). Potential impacts of organic contaminant onδ18O and δD in leaf and xylem water detected by isotope ratio infrared spectroscopy. Chinese Journal of Eco-Agriculture, 20, 1359-1365. (in Chinese with English abstract)[孟宪菁, 温学发, 张心昱, 韩佳音, 孙晓敏, 李晓波 (2012). 有机物对红外光谱技术测定植物叶片和茎秆水δ18O和δD的影响. 中国生态农业学报, 20, 1359-1365.] |
| [11] | Peng XM, Xiao SC, Cheng GD, Xiao HL, Tian QY, Zhang QB (2015). Human activity impacts on the stem radial growth ofPopulus euphratica riparian forests in China’s Ejina Oasis, using tree-ring analysis. Trees, 31, 379-392. |
| [12] | Qian YP, Lin XU, Qin DJ, Wang L (2005). Study on groundwater of the Ejina Basin at the lower reaches of the Heihe River using isotopes.Arid Land Geography, 28, 574-580. (in Chinese with English abstract)[钱云平, 林学钰, 秦大军, 王玲 (2005). 应用同位素研究黑河下游额济纳盆地地下水. 干旱区地理, 2005, 28, 574-580.] |
| [13] | Schachtschneider K, February EC (2010). The relationship between fog, floods, groundwater and tree growth along the lower Kuiseb River in the hyperarid Namib.Journal of Arid Environments, 74, 1632-1637. |
| [14] | Si JH, Feng Q, Xi HY, Yu TF, Li W (2013). Determination of critical period and requirement of ecological water demanded in the Ejina Oasis in lower reaches of the Heihe River.Journal of Desert Research, 33, 560-567. (in Chinese with English abstract)[司建华, 冯起, 席海洋, 鱼腾飞, 李炜 (2013). 黑河下游额济纳绿洲生态需水关键期及需水量. 中国沙漠, 33, 560-567.] |
| [15] | Snyder KA, Williams DG (2000). Water sources used by riparian trees varies among stream types on the San Pedro River, Arizona.Agricultural and Forest Meteorology, 105, 227-240. |
| [16] | Wang P, Yu J, Zhang Y, Fu G, Min L, Ao F (2011). Impacts of environmental flow controls on the water table and groundwater chemistry in the Ejina Delta, northwestern China.Environmental Earth Sciences, 64, 15-24. |
| [17] | Wang P, Yu J, Zhang Y, Liu C (2013). Groundwater recharge and hydrogeochemical evolution in the Ejina Basin, northwest China.Journal of Hydrology, 476, 72-86. |
| [18] | Wei Y, Fang J, Zhao X, Zhang R, Li S (2012). Isotopic model estimate of relative contribution of potential water pools to water uptake ofPinus sylvestris var. mongolica in Horqin Sandy Land. Journal of Resources and Ecology, 3, 308-315. |
| [19] | Xing X, Chen H, Zhu JJ, Chen TT (2014). Water sources of five dominant desert plant species in Nuomuhong area of Qaidam Basin.Acta Ecologica Sinica, 34, 6277-6286. (in Chinese with English abstract)[邢星, 陈辉, 朱建佳, 陈同同 (2014). 柴达木盆地诺木洪地区5种优势荒漠物水分来源. 生态学报, 34, 6277-6286.] |
| [20] | Yin L, Zhao LJ, Ruan YF, Xiao HL, Cheng GD, Zhou MX, Wang F, Li CZ (2012). Study of the replenishment sources of typical ecosystems water and dominant plant water in the lower reaches of the Heihe, China.Journal of Glaciology & Geocryology, 34, 1478-1486. (in Chinese with English abstract)[尹力, 赵良菊, 阮云峰, 肖洪浪, 程国栋, 周茅先, 王芳, 李彩芝 (2012). 黑河下游典型生态系统水分补给源及优势植物水分来源研究. 冰川冻土, 34, 1478-1486.] |
| [21] | Zhang YC, Yu JJ, Qiao MY, Yang HW (2011). Effects of eco-water transfer on changes of vegetation in the lower Heihe River Basin.Journal of Hydraulic Engineering, 42, 757-765. (in Chinese with English abstract)[张一驰, 于静洁, 乔茂云, 杨宏伟 (2011). 黑河流域生态输水对下游植被变化影响研究. 水利学报, 42, 757-765.] |
| [22] | Zhang YH, Wu YQ (2007). Variation ofδ18O in water in Heihe River Basin. Advances in Water Science, 18, 864-870. (in Chinese with English abstract)[张应华, 仵彦卿 (2007). 黑河流域不同水体中δ18O的变化. 水科学进展, 18, 864-870.] |
| [23] | Zhao LJ, Xiao HL, Cheng GD, Song YX, Zhao L, Li CZ, Yang Q (2008). A preliminary study of water sources of riparian plants in the lower reaches of the Heihe Basin. Acta Geoscientica Sinica, 29, 709-718. (in Chinese with English abstract)[赵良菊, 肖洪浪, 程国栋, 宋耀选, 赵亮, 李彩芝, 杨秋 (2008). 黑河下游河岸林植物水分来源初步研究. 地球学报, 29, 709-718.] |
| [24] | Zhu JT, Yu JJ, Wang P, Wang ZY (2011). Quantitative classification and analysis of relationships between plant communities and their groundwater environment in the Ejina Desert Oasis of China.Chinese Journal of Plant Ecology, 35, 480-489. (in Chinese with English abstract)[朱军涛, 于静洁, 王平, 王志勇 (2011). 额济纳荒漠绿洲植物群落的数量分类及其与地下水环境的关系分析. 植物生态学报, 35, 480-489.] |
| [1] | 吴瀚, 白洁, 李均力, 古丽•加帕尔, 包安明. 新疆地区植被覆盖度时空变化及其影响因素分析[J]. 植物生态学报, 2024, 48(1): 41-55. |
| [2] | 韩路, 冯宇, 李沅楷, 王雨晴, 王海珍. 地下水埋深对灰胡杨叶片与土壤养分生态化学计量特征及其内稳态的影响[J]. 植物生态学报, 2024, 48(1): 92-102. |
| [3] | 王晓悦, 许艺馨, 李春环, 余海龙, 黄菊莹. 长期降水量变化下荒漠草原植物生物量、多样性的变化及其影响因素[J]. 植物生态学报, 2023, 47(4): 479-490. |
| [4] | 路晨曦, 徐漫, 石学瑾, 赵成, 陶泽, 李敏, 司炳成. 基于贝叶斯模型MixSIAR的不同水同位素输入方法对苹果园吸水特征分析结果的影响[J]. 植物生态学报, 2023, 47(2): 238-248. |
| [5] | 张志山, 韩高玲, 霍建强, 黄日辉, 薛书文. 固沙灌木柠条锦鸡儿和中间锦鸡儿木质部导水与叶片光合能力对土壤水分的响应[J]. 植物生态学报, 2023, 47(10): 1422-1431. |
| [6] | 林雍, 陈智, 杨萌, 陈世苹, 高艳红, 刘冉, 郝彦宾, 辛晓平, 周莉, 于贵瑞. 中国干旱半干旱区生态系统光合参数的时空变异及其影响因素[J]. 植物生态学报, 2022, 46(12): 1461-1472. |
| [7] | 杨萌, 于贵瑞. 中国干旱半干旱区土壤CO2与CH4通量的耦联解耦及其对温度的响应[J]. 植物生态学报, 2022, 46(12): 1497-1507. |
| [8] | 朱湾湾, 王攀, 许艺馨, 李春环, 余海龙, 黄菊莹. 降水量变化与氮添加下荒漠草原土壤酶活性及其影响因素[J]. 植物生态学报, 2021, 45(3): 309-320. |
| [9] | 范琳杰, 李成道, 李向义, Henry J. SUN, 林丽莎, 刘波. 极端干旱区沙土掩埋对凋落物分解速率及盐分含量动态的影响[J]. 植物生态学报, 2021, 45(2): 144-153. |
| [10] | 蔚亮, 李均力, 包安明, 白洁, 黄粤, 刘铁, 沈占锋. 塔里木河下游湿地面积时序变化及对生态输水的响应[J]. 植物生态学报, 2020, 44(6): 616-627. |
| [11] | 梁士楚, 刘润红, 荣春艳, 常斌, 姜勇. 漓江河岸带植物功能性状变异与关联[J]. 植物生态学报, 2019, 43(1): 16-26. |
| [12] | 陈怡超, 赵莹, 宋希强, 任明迅. 海南杜鹃在河岸带弯道两侧的空间分布格局和年龄结构差异[J]. 植物生态学报, 2018, 42(8): 841-849. |
| [13] | 黄小涛, 罗格平. 新疆草地蒸散与水分利用效率的时空特征[J]. 植物生态学报, 2017, 41(5): 506-518. |
| [14] | 吕婷, 赵西宁, 高晓东, 潘燕辉. 黄土丘陵区典型天然灌丛和人工灌丛优势植物土壤水分利用策略[J]. 植物生态学报, 2017, 41(2): 175-185. |
| [15] | 岳楷, 杨万勤, 彭艳, 黄春萍, 张川, 吴福忠. 高寒森林溪流对凋落叶分解过程中木质素降解的影响[J]. 植物生态学报, 2016, 40(9): 893-901. |
| 阅读次数 | ||||||
|
全文 |
|
|||||
|
摘要 |
|
|||||
Copyright © 2026 版权所有 《植物生态学报》编辑部
地址: 北京香山南辛村20号, 邮编: 100093
Tel.: 010-62836134, 62836138; Fax: 010-82599431; E-mail: apes@ibcas.ac.cn, cjpe@ibcas.ac.cn
备案号: 京ICP备16067583号-19
![]()