
植物生态学报 ›› 2008, Vol. 32 ›› Issue (6): 1312-1322.DOI: 10.3773/j.issn.1005-264x.2008.06.012 cstr: 32100.14.j.issn.1005-264x.2008.06.012
张峰, 周广胜( ), 王玉辉
收稿日期:2008-03-10
接受日期:2008-04-24
出版日期:2008-03-10
发布日期:2008-11-30
作者简介:*(gszhou@ibcas.ac.cn)基金资助:
ZHANG Feng, ZHOU Guang-Sheng(), WANG Yu-Hui
Received:2008-03-10
Accepted:2008-04-24
Online:2008-03-10
Published:2008-11-30
摘要:
植物物候作为气候变化敏感的生物圈指示计, 已经成为全球变化研究的热点。利用1985~2002年地面物候观测数据, 构建了内蒙古克氏针茅(Stipa krylovii)草原植物物候的时间序列谱, 并分析了植物物候的时间变异与气候因子之间的相关关系。结果表明: 1) 从1985~2002年内蒙古克氏针茅草原的气候朝着暖干趋势发展, 主要表现在春、夏气温的显著性增加与秋季(9月)降水的显著性减少; 2) 主要植物物候的变化整体呈返青期推后其它物候期提前趋势; 3) 植物生长盛期(7、8月)对气候变化最敏感; 4) 光照和温度是影响内蒙古克氏针茅草原植物物候格局的主要因素, 年内最寒冷的1月月均温和2、3月的光照对春季返青期具有负效应, 而其它物候期与7、8月的光照则呈显著的负相关关系, 6、7月的降水对发育盛期的花序形成、抽穗与开花具有显著的负效应, 8、9月的降水量能显著推后枯黄期的结束, 从而有利于生长季的延长。
张峰, 周广胜, 王玉辉. 内蒙古克氏针茅草原植物物候及其与气候因子关系. 植物生态学报, 2008, 32(6): 1312-1322. DOI: 10.3773/j.issn.1005-264x.2008.06.012
ZHANG Feng, ZHOU Guang-Sheng, WANG Yu-Hui. PHENOLOGICAL CALENDAR OF STIPA KRYLOVII STEPPE IN INNER MONGOLIA, CHINA AND ITS CORRELATION WITH CLIMATIC VARIABLES. Chinese Journal of Plant Ecology, 2008, 32(6): 1312-1322. DOI: 10.3773/j.issn.1005-264x.2008.06.012
| 平均气温 Mean air temperature | 平均最高气温 Mean maximum air temperature | 平均最低气温 Mean minimum air temperature | 降水量 Precipitation | |||||
|---|---|---|---|---|---|---|---|---|
| 斜率 Intercept | R2 | 斜率 Intercept | R2 | 斜率 Intercept | R2 | 斜率 Intercept | R2 | |
| 年际水平 Annual | 0.115 | 0.466** | 0.117 | 0.411** | 0.113 | 0.472** | -3.988 | 0.071 |
| 生长季 Seasonal | 0.120 | 0.504*** | 0.117 | 0.416** | 0.122 | 0.555*** | -3.414 | 0.055 |
| 非生长季 Non-seasonal | 0.114 | 0.174 | 0.121 | 0.157 | 0.106 | 0.178 | -0.575 | 0.081 |
| 春Spring | 0.160 | 0.434** | 0.156 | 0.366** | 0.164 | 0.468** | 0.621 | 0.019 |
| 夏Summer | 0.118 | 0.279* | 0.117 | 0.187 | 0.119 | 0.395** | -2.393 | 0.031 |
| 秋Autumm | 0.042 | 0.026 | 0.046 | 0.030 | 0.038 | 0.019 | -2.104 | 0.290* |
| 冬Winter | 0.146 | 0.178 | 0.158 | 0.164 | 0.135 | 0.178 | -0.036 | 0.035 |
表1 1985~2002年内蒙古克氏针茅草原平均温度、平均最低温、平均最高温和降水随年份的变化趋势
Table 1 The trends of mean air temperature, mean maximum air temperature, mean minimum air temperature and precipitation from 1985 to 2002 in Inner Mongolian Stipa krylovii steppe
| 平均气温 Mean air temperature | 平均最高气温 Mean maximum air temperature | 平均最低气温 Mean minimum air temperature | 降水量 Precipitation | |||||
|---|---|---|---|---|---|---|---|---|
| 斜率 Intercept | R2 | 斜率 Intercept | R2 | 斜率 Intercept | R2 | 斜率 Intercept | R2 | |
| 年际水平 Annual | 0.115 | 0.466** | 0.117 | 0.411** | 0.113 | 0.472** | -3.988 | 0.071 |
| 生长季 Seasonal | 0.120 | 0.504*** | 0.117 | 0.416** | 0.122 | 0.555*** | -3.414 | 0.055 |
| 非生长季 Non-seasonal | 0.114 | 0.174 | 0.121 | 0.157 | 0.106 | 0.178 | -0.575 | 0.081 |
| 春Spring | 0.160 | 0.434** | 0.156 | 0.366** | 0.164 | 0.468** | 0.621 | 0.019 |
| 夏Summer | 0.118 | 0.279* | 0.117 | 0.187 | 0.119 | 0.395** | -2.393 | 0.031 |
| 秋Autumm | 0.042 | 0.026 | 0.046 | 0.030 | 0.038 | 0.019 | -2.104 | 0.290* |
| 冬Winter | 0.146 | 0.178 | 0.158 | 0.164 | 0.135 | 0.178 | -0.036 | 0.035 |
| 1月 | 2月 | 3月 | 4月 | 5月 | 6月 | 7月 | 8月 | 9月 | 10月 | 11月 | 12月 | |
|---|---|---|---|---|---|---|---|---|---|---|---|---|
| Jan. | Feb. | Mar. | Apr. | May | Jun. | Jul. | Aug. | Sept. | Oct. | Nov. | Dec. | |
| 月均温 Monthly mean temperature (℃) | ||||||||||||
| 平均值Mean | -17.6 | -13.0 | -4.7 | 5.9 | 13.5 | 19.1 | 21.7 | 20.1 | 13.5 | 4.6 | -6.3 | -14.6 |
| 标准误差SD | 2.5 | 3.1 | 2.8 | 1.8 | 1.1 | 1.4 | 1.6 | 1.3 | 1.4 | 1.8 | 2.7 | 2.3 |
| 变化趋势Trend | +0.9 | +2.8 | +2.9 | +1.1 | +0.7 | +1.0 | +1.8 | +0.8 | +1.8 | -0.9 | +0.4 | +0.6 |
| p | - | <0.05 | <0.05 | - | - | - | <0.01 | - | <0.01 | - | - | - |
| 月均最低温 Monthly mean minimum air temperature (℃) | ||||||||||||
| 平均值Mean | -23.2 | -19.5 | -11.4 | -1.4 | 6.1 | 12.3 | 15.9 | 13.9 | 6.6 | -2.1 | -12.3 | -20.0 |
| 标准误差SD | 2.2 | 2.9 | 2.7 | 1.6 | 1.2 | 1.4 | 1.3 | 1.1 | 1.6 | 1.6 | 2.5 | 2.2 |
| 变化趋势Trend | +0.1 | +0.3 | +0.3 | +0.1 | +0.1 | +0.1 | +0.2 | 0.0 | +0.1 | -0.1 | 0.0 | 0.0 |
| p | - | <.05 | <.05 | - | <.05 | <.05 | <.001 | - | <.05 | - | - | - |
| 月均最高温 Monthly mean maximum air temperature (℃) | ||||||||||||
| 平均值Mean | -12.1 | -6.6 | 2.0 | 13.3 | 20.9 | 25.8 | 27.5 | 26.4 | 20.5 | 11.4 | -0.3 | -9.2 |
| 标准误差SD | 2.8 | 3.5 | 2.9 | 2.1 | 1.2 | 1.5 | 2.0 | 1.9 | 1.5 | 2.1 | 3.0 | 2.5 |
| 变化趋势Trend | +0.1 | +0.3 | +0.3 | +0.1 | 0.0 | +0.1 | +0.2 | +0.1 | +0.2 | -0.1 | 0.0 | +0.1 |
| p | - | <.05 | <.05 | - | - | - | <.05 | - | <.001 | - | - | - |
| 月降水量 Monthly precipitation (mm) | ||||||||||||
| 平均值Mean | 2.4 | 2.4 | 5.8 | 5.9 | 24.5 | 46.8 | 88.0 | 59.3 | 21.3 | 9.9 | 6.4 | 3.3 |
| 标准误差SD | 1.8 | 2.1 | 5.2 | 5.0 | 22.1 | 23.5 | 43.5 | 41.1 | 17.9 | 10.2 | 6.5 | 2.0 |
| 变化趋势Trend | 0.0 | -0.2 | -0.2 | 0.05 | 0.8 | 0.9 | -1.3 | -2.0 | -1.8 | -0.1 | -0.2 | 0.05 |
| p | - | - | - | - | - | - | - | - | <0.05 | - | - | - |
表2 1985~2002年内蒙古克氏针茅草原月均温、月均最高温度、月均最低温度及月降水量随年份变化趋势
Table 2 Monthly mean air temperature, monthly mean minimum air temperature, monthly mean maximum air temperature and monthly precipitation in Inner Mongolian Stipa krylovii steppe, as well as trends per decade during 1995 to 2002
| 1月 | 2月 | 3月 | 4月 | 5月 | 6月 | 7月 | 8月 | 9月 | 10月 | 11月 | 12月 | |
|---|---|---|---|---|---|---|---|---|---|---|---|---|
| Jan. | Feb. | Mar. | Apr. | May | Jun. | Jul. | Aug. | Sept. | Oct. | Nov. | Dec. | |
| 月均温 Monthly mean temperature (℃) | ||||||||||||
| 平均值Mean | -17.6 | -13.0 | -4.7 | 5.9 | 13.5 | 19.1 | 21.7 | 20.1 | 13.5 | 4.6 | -6.3 | -14.6 |
| 标准误差SD | 2.5 | 3.1 | 2.8 | 1.8 | 1.1 | 1.4 | 1.6 | 1.3 | 1.4 | 1.8 | 2.7 | 2.3 |
| 变化趋势Trend | +0.9 | +2.8 | +2.9 | +1.1 | +0.7 | +1.0 | +1.8 | +0.8 | +1.8 | -0.9 | +0.4 | +0.6 |
| p | - | <0.05 | <0.05 | - | - | - | <0.01 | - | <0.01 | - | - | - |
| 月均最低温 Monthly mean minimum air temperature (℃) | ||||||||||||
| 平均值Mean | -23.2 | -19.5 | -11.4 | -1.4 | 6.1 | 12.3 | 15.9 | 13.9 | 6.6 | -2.1 | -12.3 | -20.0 |
| 标准误差SD | 2.2 | 2.9 | 2.7 | 1.6 | 1.2 | 1.4 | 1.3 | 1.1 | 1.6 | 1.6 | 2.5 | 2.2 |
| 变化趋势Trend | +0.1 | +0.3 | +0.3 | +0.1 | +0.1 | +0.1 | +0.2 | 0.0 | +0.1 | -0.1 | 0.0 | 0.0 |
| p | - | <.05 | <.05 | - | <.05 | <.05 | <.001 | - | <.05 | - | - | - |
| 月均最高温 Monthly mean maximum air temperature (℃) | ||||||||||||
| 平均值Mean | -12.1 | -6.6 | 2.0 | 13.3 | 20.9 | 25.8 | 27.5 | 26.4 | 20.5 | 11.4 | -0.3 | -9.2 |
| 标准误差SD | 2.8 | 3.5 | 2.9 | 2.1 | 1.2 | 1.5 | 2.0 | 1.9 | 1.5 | 2.1 | 3.0 | 2.5 |
| 变化趋势Trend | +0.1 | +0.3 | +0.3 | +0.1 | 0.0 | +0.1 | +0.2 | +0.1 | +0.2 | -0.1 | 0.0 | +0.1 |
| p | - | <.05 | <.05 | - | - | - | <.05 | - | <.001 | - | - | - |
| 月降水量 Monthly precipitation (mm) | ||||||||||||
| 平均值Mean | 2.4 | 2.4 | 5.8 | 5.9 | 24.5 | 46.8 | 88.0 | 59.3 | 21.3 | 9.9 | 6.4 | 3.3 |
| 标准误差SD | 1.8 | 2.1 | 5.2 | 5.0 | 22.1 | 23.5 | 43.5 | 41.1 | 17.9 | 10.2 | 6.5 | 2.0 |
| 变化趋势Trend | 0.0 | -0.2 | -0.2 | 0.05 | 0.8 | 0.9 | -1.3 | -2.0 | -1.8 | -0.1 | -0.2 | 0.05 |
| p | - | - | - | - | - | - | - | - | <0.05 | - | - | - |
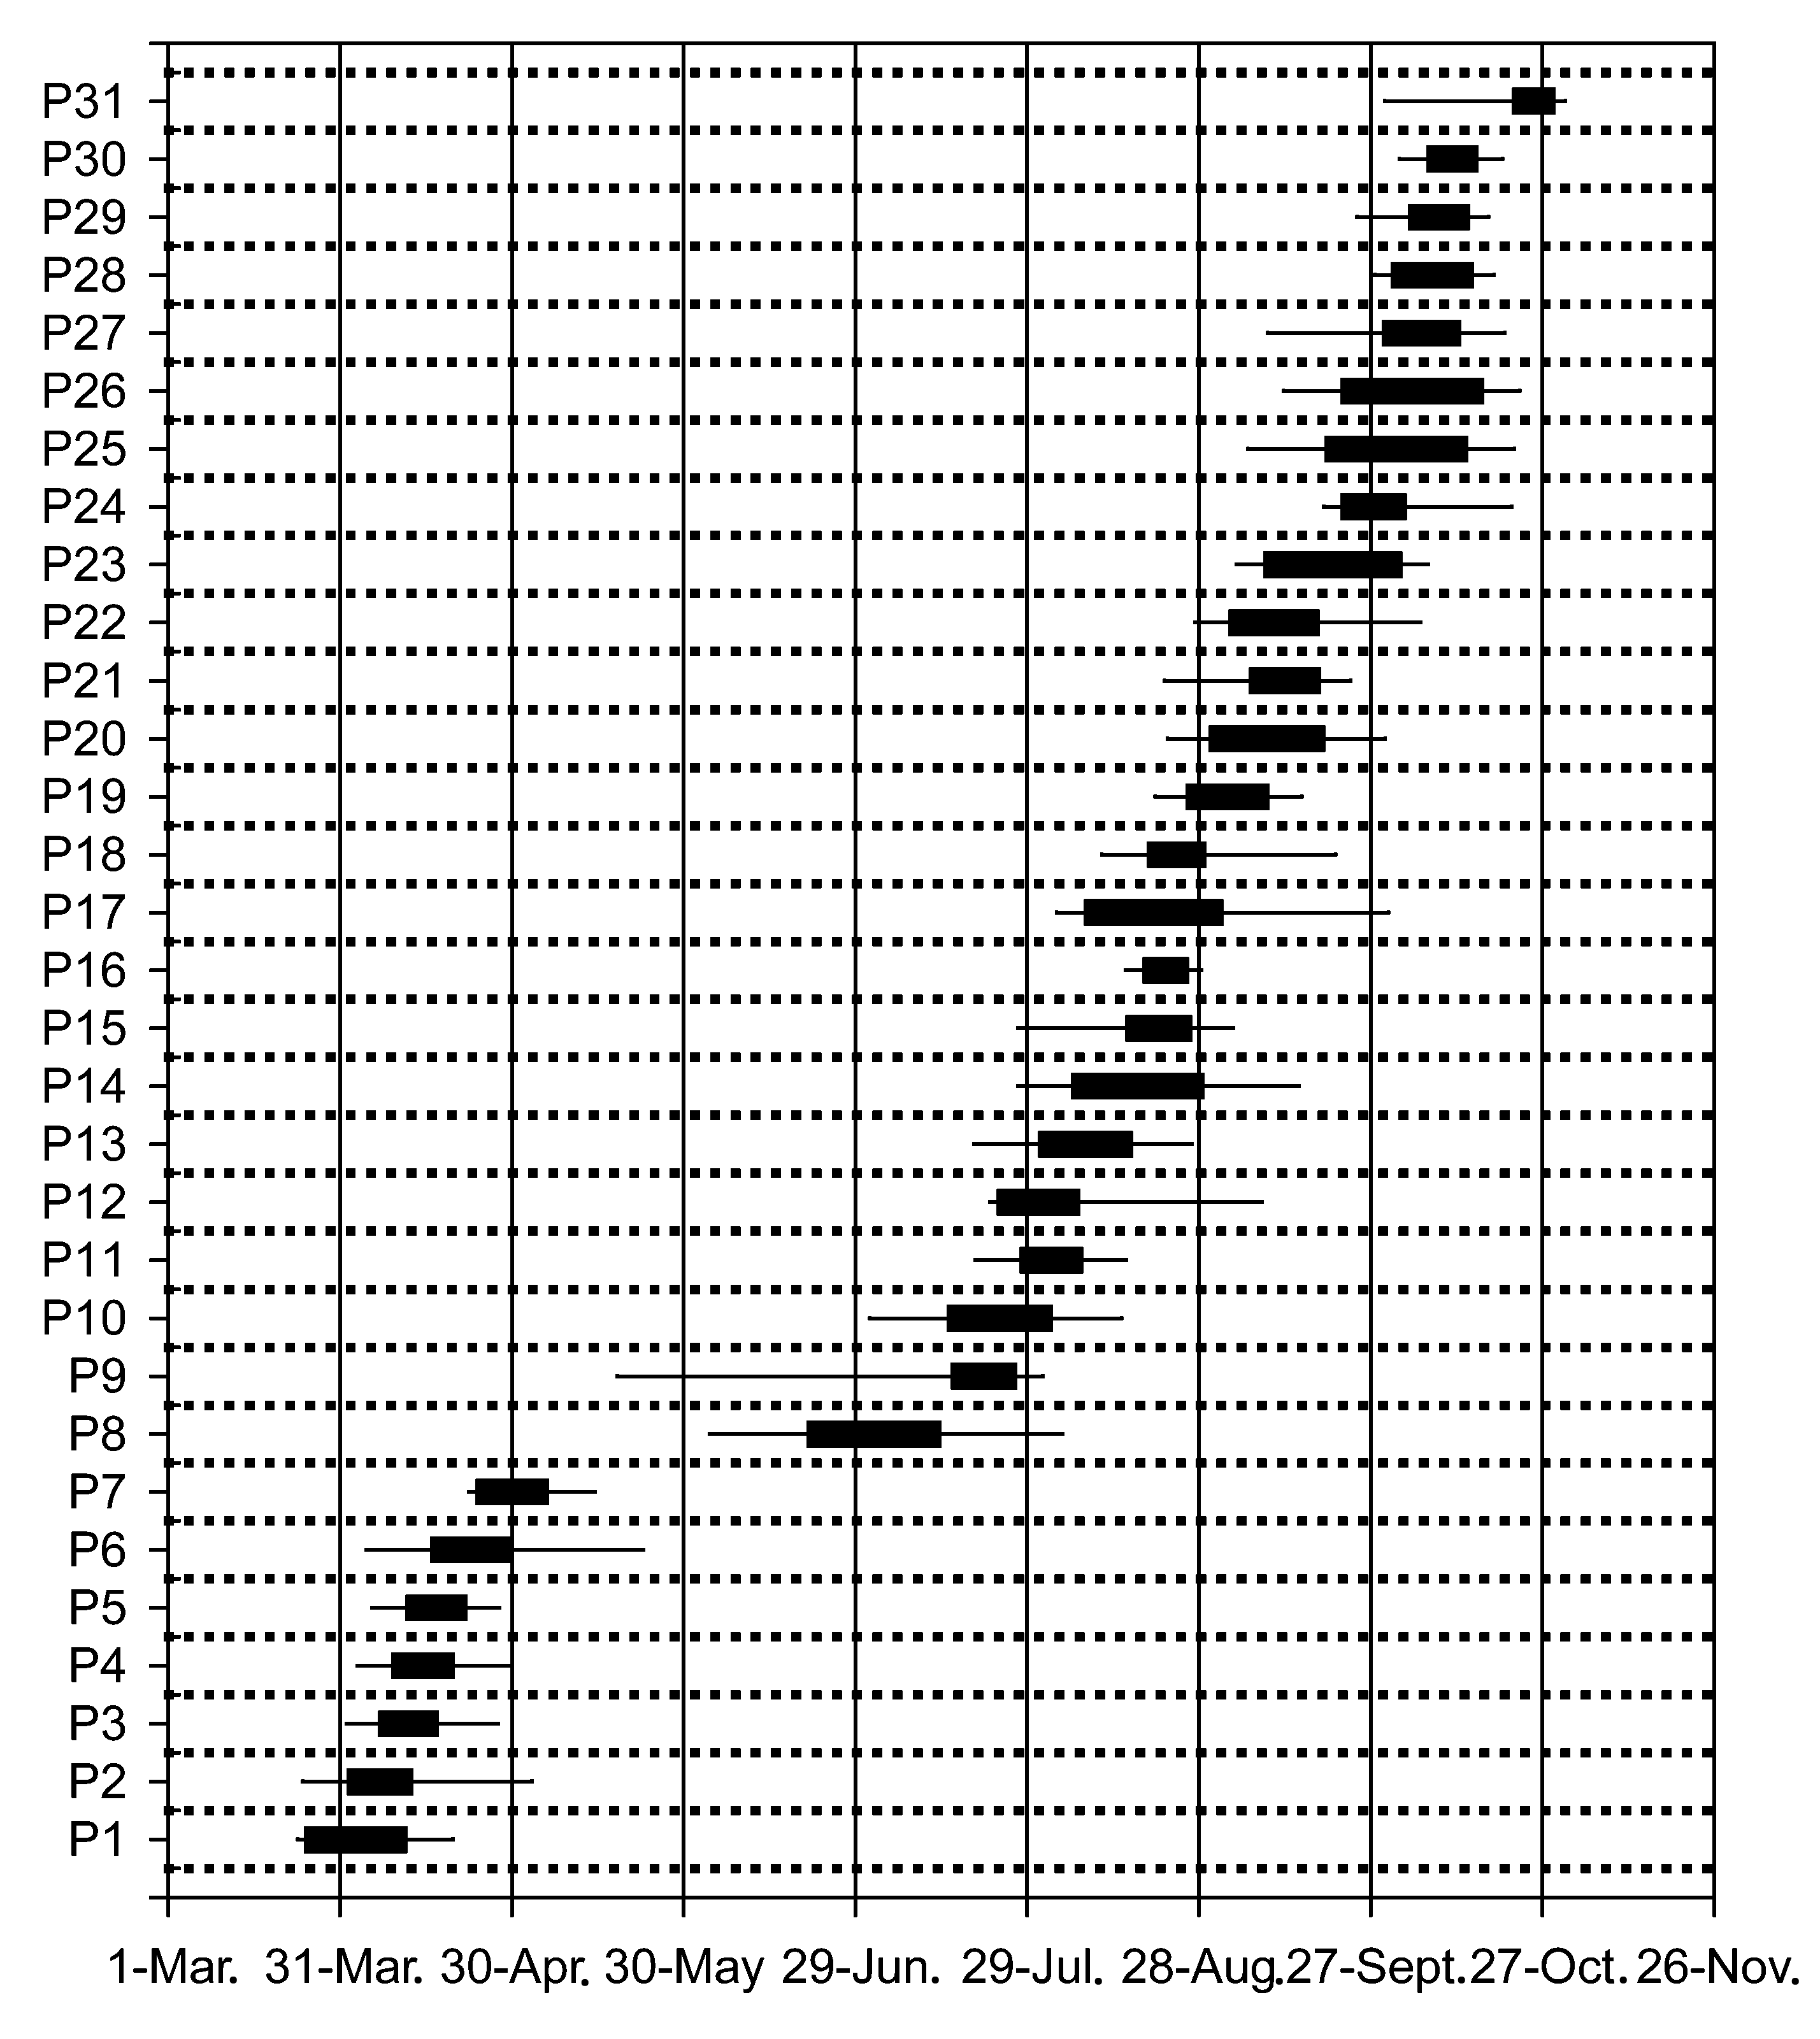
图1 内蒙古克氏针茅草原植物物候时间序列及物候变异分位数分布格局 P1: 冷蒿返青 Budding of Artemisia frigida P2: 黄蒿返青 Budding of Artemisia scoparia P3: 克氏针茅返青 Budding of Stipa krylovii P4: 矮葱返青 Budding of Allium anisopodium P5: 羊草返青 Budding of Leymus chinensis P6: 阿尔泰狗娃花返青 Budding of Heteropappus altaicus P7: 糙隐子草返青 Budding of Cleistogenes squarrosa P8: 矮葱花序形成 Inflorescence of Allium anisopodium P9: 黄蒿花序形成 Inflorescence of Artemisia scoparia P10: 阿尔泰狗娃花花序形成 Inflorescence of Heteropappus altaicus P11: 冷蒿花序形成 Inflorescence of Artemisia frigida P12: 克氏针茅抽穗 Tasselling of Stipa krylovii P13: 糙隐子草抽穗 Tasselling of Cleistogenes squarrosa P14: 糙隐子草开花 Flowering of Cleistogenes squarrosa P15: 阿尔泰狗娃花开花 Flowering of Heteropappus altaicus P16: 黄蒿开花 Flowering of Artemisia scoparia P17: 克氏针茅开花 Flowering of Stipa krylovii P18: 冷蒿开花 Flowering of Artemisia frigida P19: 矮葱种子成熟 Fruiting of Allium anisopodium P20: 糙隐子草种子成熟 Fruiting of Cleistogenes squarrosa P21: 阿尔泰狗娃花种子成熟 Fruiting of Heteropappus altaicus P22: 克氏针茅种子成熟 Fruiting of Stipa krylovii P23: 糙隐子草枯黄 Senescence of Cleistogenes squarrosa P24: 黄蒿种子成熟 Fruiting of Artemisia scoparia P25: 矮葱枯黄 Senescence of Allium anisopodium P26: 克氏针茅枯黄 Senescence of Stipa krylovii P27: 羊草枯黄 Senescence of Leymus chinensis P28: 冷蒿种子成熟 Fruiting of Artemisia frigida P29: 阿尔泰狗娃花枯黄 Senescence of Heteropappus altaicus P30: 黄蒿枯黄 Senescence of Artemisia scoparia P31: 冷蒿枯黄 Senescence of Artemisia frigida
Fig. 1 Phenological time series and variability of data in quartiles for 1985-2002 in Inner Mongolian Stipa krylovii steppe
| 物候期 Phenophase | 平均日期Average date (Julian day) | 温度 T(℃) | 最早日期 Min. date | 最晚日期 Max. date | 变幅 Extent | 标准偏差 SD |
|---|---|---|---|---|---|---|
| P1 | 2-Apr. (93) | 2.8 | 1990-21-Mar. (81) | 2001-26-Apr. (117) | 36 | 10.4 |
| P2 | 7-Apr. (99) | 3.3 | 1997-23-Mar. (83) | 2000-12-May (133) | 50 | 12.6 |
| P3 | 12-Apr. (103) | 4.8 | 1990-28-Mar. (88) | 2002-3-May (124) | 36 | 8.6 |
| P4 | 14-Apr. (106) | 7.3 | 1990-24-Mar. (84) | 2002-11-May (132) | 48 | 10.2 |
| P5 | 16-Apr. (108) | 7.7 | 1990-1-Apr. (92) | 2002-5-May (126) | 34 | 7.9 |
| P6 | 24-Apr. (115) | 6.6 | 1990-3-Apr. (94) | 1989-21-Jun. (173) | 79 | 18.3 |
| P7 | 29-Apr. (121) | 10.5 | 1990-17-Apr. (108) | 1989-28-May. (149) | 41 | 9.7 |
| P8 | 1-Jul. (183) | 20.6 | 2001-2-Jun. (154) | 1994-5-Aug. (218) | 64 | 18.8 |
| P9 | 12-Jul. (194) | 21.4 | 1996-15-Apr. (106) | 1997-1-Aug. (214) | 108 | 27.5 |
| P10 | 23-Jul. (205) | 21.9 | 1993-30-Jun. (182) | 1995-15-Aug. (228) | 46 | 13.6 |
| P11 | 2-Aug. (215) | 21.7 | 1986-19-Jul. (201) | 2000-28-Aug. (241) | 40 | 9.7 |
| P12 | 3-Aug. (216) | 23.0 | 1993-21-Jul. (203) | 1985-15-Sept. (259) | 56 | 16.2 |
| P13 | 6-Aug. (220) | 20.2 | 2002-9-Jul. (191) | 1985-6-Sept. (250) | 59 | 13.5 |
| P14 | 16-Aug. (229) | 19.7 | 2002-21-Jul. (203) | 1987-14-Sept. (258) | 55 | 15.8 |
| P15 | 18-Aug. (231) | 18.8 | 1993-23-Jul. (205) | 1995/1996-2-Sept. (246) | 41 | 12.1 |
| P16 | 20-Aug. (234) | 19.4 | 1992-13-Aug. (226) | 1987-29-Aug. (242) | 16 | 4.4 |
| P17 | 23-Aug. (236) | 19.0 | 1990-1-Aug. (214) | 1987-30-Sept. (274) | 60 | 19.4 |
| P18 | 24-Aug. (237) | 19.1 | 2002-1-Aug. (214) | 1989-29-Sept. (273) | 59 | 13.3 |
| P19 | 31-Aug. (244) | 18.9 | 1992-19-Aug. (232) | 1985-15-Sept. (259) | 27 | 9.0 |
| P20 | 6-Sept. (250) | 16.6 | 2002-15-Aug. (228) | 1987-29-Sept. (273) | 45 | 13.2 |
| P21 | 9-Sept. (253) | 14.3 | 1986-17-Aug. (230) | 1996-26-Sept. (270) | 40 | 10.2 |
| P22 | 11-Sept. (255) | 14.5 | 1998-26-Aug. (239) | 1989-5-Oct. (279) | 40 | 13.0 |
| P23 | 19-Sept. (263) | 10.8 | 2002-30-Aug. (243) | 2000-24-Oct. (298) | 55 | 13.9 |
| P24 | 28-Sept. (273) | 10.8 | 1998-17-Sept. (261) | 1993-29-Oct. (303) | 42 | 10.9 |
| P25 | 29-Sept. (274) | 9.2 | 2002-4-Sept. (248) | 2000-22-Oct. (296) | 48 | 15.9 |
| P26 | 3-Oct. (277) | 8.9 | 2001-6-Sept. (250) | 2000-22-Oct. (296) | 46 | 14.7 |
| P27 | 4-Oct. (278) | 7.9 | 1991-8-Sept. (252) | 2000-23-Oct. (297) | 45 | 12.5 |
| P28 | 6-Oct. (280) | 8.0 | 1992-26-Sept. (270) | 1996-21-Oct. (295) | 25 | 7.5 |
| P29 | 7-Oct. (281) | 7.6 | 1994-23-Sept. (267) | 1998-17-Oct. (291) | 24 | 7.4 |
| P30 | 11-Oct. (285) | 7.1 | 1994-1-Oct. (275) | 1987-19-Oct. (293) | 18 | 5.8 |
| P31 | 22-Oct. (296) | 3.3 | 2001-24-Sept. (268) | 1997/1998-30-Oct. (304) | 36 | 10.2 |
表3 1985~2002年内蒙古克氏针茅草原植物物候期的平均发生日期、相应日均温、物候极端值、发生日期、变异幅度及标准偏差
Table 3 Phenological time series: average event dates, daily temperature, extreme phenophases, event data, variable amplitude and standard deviation in Inner Mongolian Stipa krylovii steppe from 1985 to 2002
| 物候期 Phenophase | 平均日期Average date (Julian day) | 温度 T(℃) | 最早日期 Min. date | 最晚日期 Max. date | 变幅 Extent | 标准偏差 SD |
|---|---|---|---|---|---|---|
| P1 | 2-Apr. (93) | 2.8 | 1990-21-Mar. (81) | 2001-26-Apr. (117) | 36 | 10.4 |
| P2 | 7-Apr. (99) | 3.3 | 1997-23-Mar. (83) | 2000-12-May (133) | 50 | 12.6 |
| P3 | 12-Apr. (103) | 4.8 | 1990-28-Mar. (88) | 2002-3-May (124) | 36 | 8.6 |
| P4 | 14-Apr. (106) | 7.3 | 1990-24-Mar. (84) | 2002-11-May (132) | 48 | 10.2 |
| P5 | 16-Apr. (108) | 7.7 | 1990-1-Apr. (92) | 2002-5-May (126) | 34 | 7.9 |
| P6 | 24-Apr. (115) | 6.6 | 1990-3-Apr. (94) | 1989-21-Jun. (173) | 79 | 18.3 |
| P7 | 29-Apr. (121) | 10.5 | 1990-17-Apr. (108) | 1989-28-May. (149) | 41 | 9.7 |
| P8 | 1-Jul. (183) | 20.6 | 2001-2-Jun. (154) | 1994-5-Aug. (218) | 64 | 18.8 |
| P9 | 12-Jul. (194) | 21.4 | 1996-15-Apr. (106) | 1997-1-Aug. (214) | 108 | 27.5 |
| P10 | 23-Jul. (205) | 21.9 | 1993-30-Jun. (182) | 1995-15-Aug. (228) | 46 | 13.6 |
| P11 | 2-Aug. (215) | 21.7 | 1986-19-Jul. (201) | 2000-28-Aug. (241) | 40 | 9.7 |
| P12 | 3-Aug. (216) | 23.0 | 1993-21-Jul. (203) | 1985-15-Sept. (259) | 56 | 16.2 |
| P13 | 6-Aug. (220) | 20.2 | 2002-9-Jul. (191) | 1985-6-Sept. (250) | 59 | 13.5 |
| P14 | 16-Aug. (229) | 19.7 | 2002-21-Jul. (203) | 1987-14-Sept. (258) | 55 | 15.8 |
| P15 | 18-Aug. (231) | 18.8 | 1993-23-Jul. (205) | 1995/1996-2-Sept. (246) | 41 | 12.1 |
| P16 | 20-Aug. (234) | 19.4 | 1992-13-Aug. (226) | 1987-29-Aug. (242) | 16 | 4.4 |
| P17 | 23-Aug. (236) | 19.0 | 1990-1-Aug. (214) | 1987-30-Sept. (274) | 60 | 19.4 |
| P18 | 24-Aug. (237) | 19.1 | 2002-1-Aug. (214) | 1989-29-Sept. (273) | 59 | 13.3 |
| P19 | 31-Aug. (244) | 18.9 | 1992-19-Aug. (232) | 1985-15-Sept. (259) | 27 | 9.0 |
| P20 | 6-Sept. (250) | 16.6 | 2002-15-Aug. (228) | 1987-29-Sept. (273) | 45 | 13.2 |
| P21 | 9-Sept. (253) | 14.3 | 1986-17-Aug. (230) | 1996-26-Sept. (270) | 40 | 10.2 |
| P22 | 11-Sept. (255) | 14.5 | 1998-26-Aug. (239) | 1989-5-Oct. (279) | 40 | 13.0 |
| P23 | 19-Sept. (263) | 10.8 | 2002-30-Aug. (243) | 2000-24-Oct. (298) | 55 | 13.9 |
| P24 | 28-Sept. (273) | 10.8 | 1998-17-Sept. (261) | 1993-29-Oct. (303) | 42 | 10.9 |
| P25 | 29-Sept. (274) | 9.2 | 2002-4-Sept. (248) | 2000-22-Oct. (296) | 48 | 15.9 |
| P26 | 3-Oct. (277) | 8.9 | 2001-6-Sept. (250) | 2000-22-Oct. (296) | 46 | 14.7 |
| P27 | 4-Oct. (278) | 7.9 | 1991-8-Sept. (252) | 2000-23-Oct. (297) | 45 | 12.5 |
| P28 | 6-Oct. (280) | 8.0 | 1992-26-Sept. (270) | 1996-21-Oct. (295) | 25 | 7.5 |
| P29 | 7-Oct. (281) | 7.6 | 1994-23-Sept. (267) | 1998-17-Oct. (291) | 24 | 7.4 |
| P30 | 11-Oct. (285) | 7.1 | 1994-1-Oct. (275) | 1987-19-Oct. (293) | 18 | 5.8 |
| P31 | 22-Oct. (296) | 3.3 | 2001-24-Sept. (268) | 1997/1998-30-Oct. (304) | 36 | 10.2 |
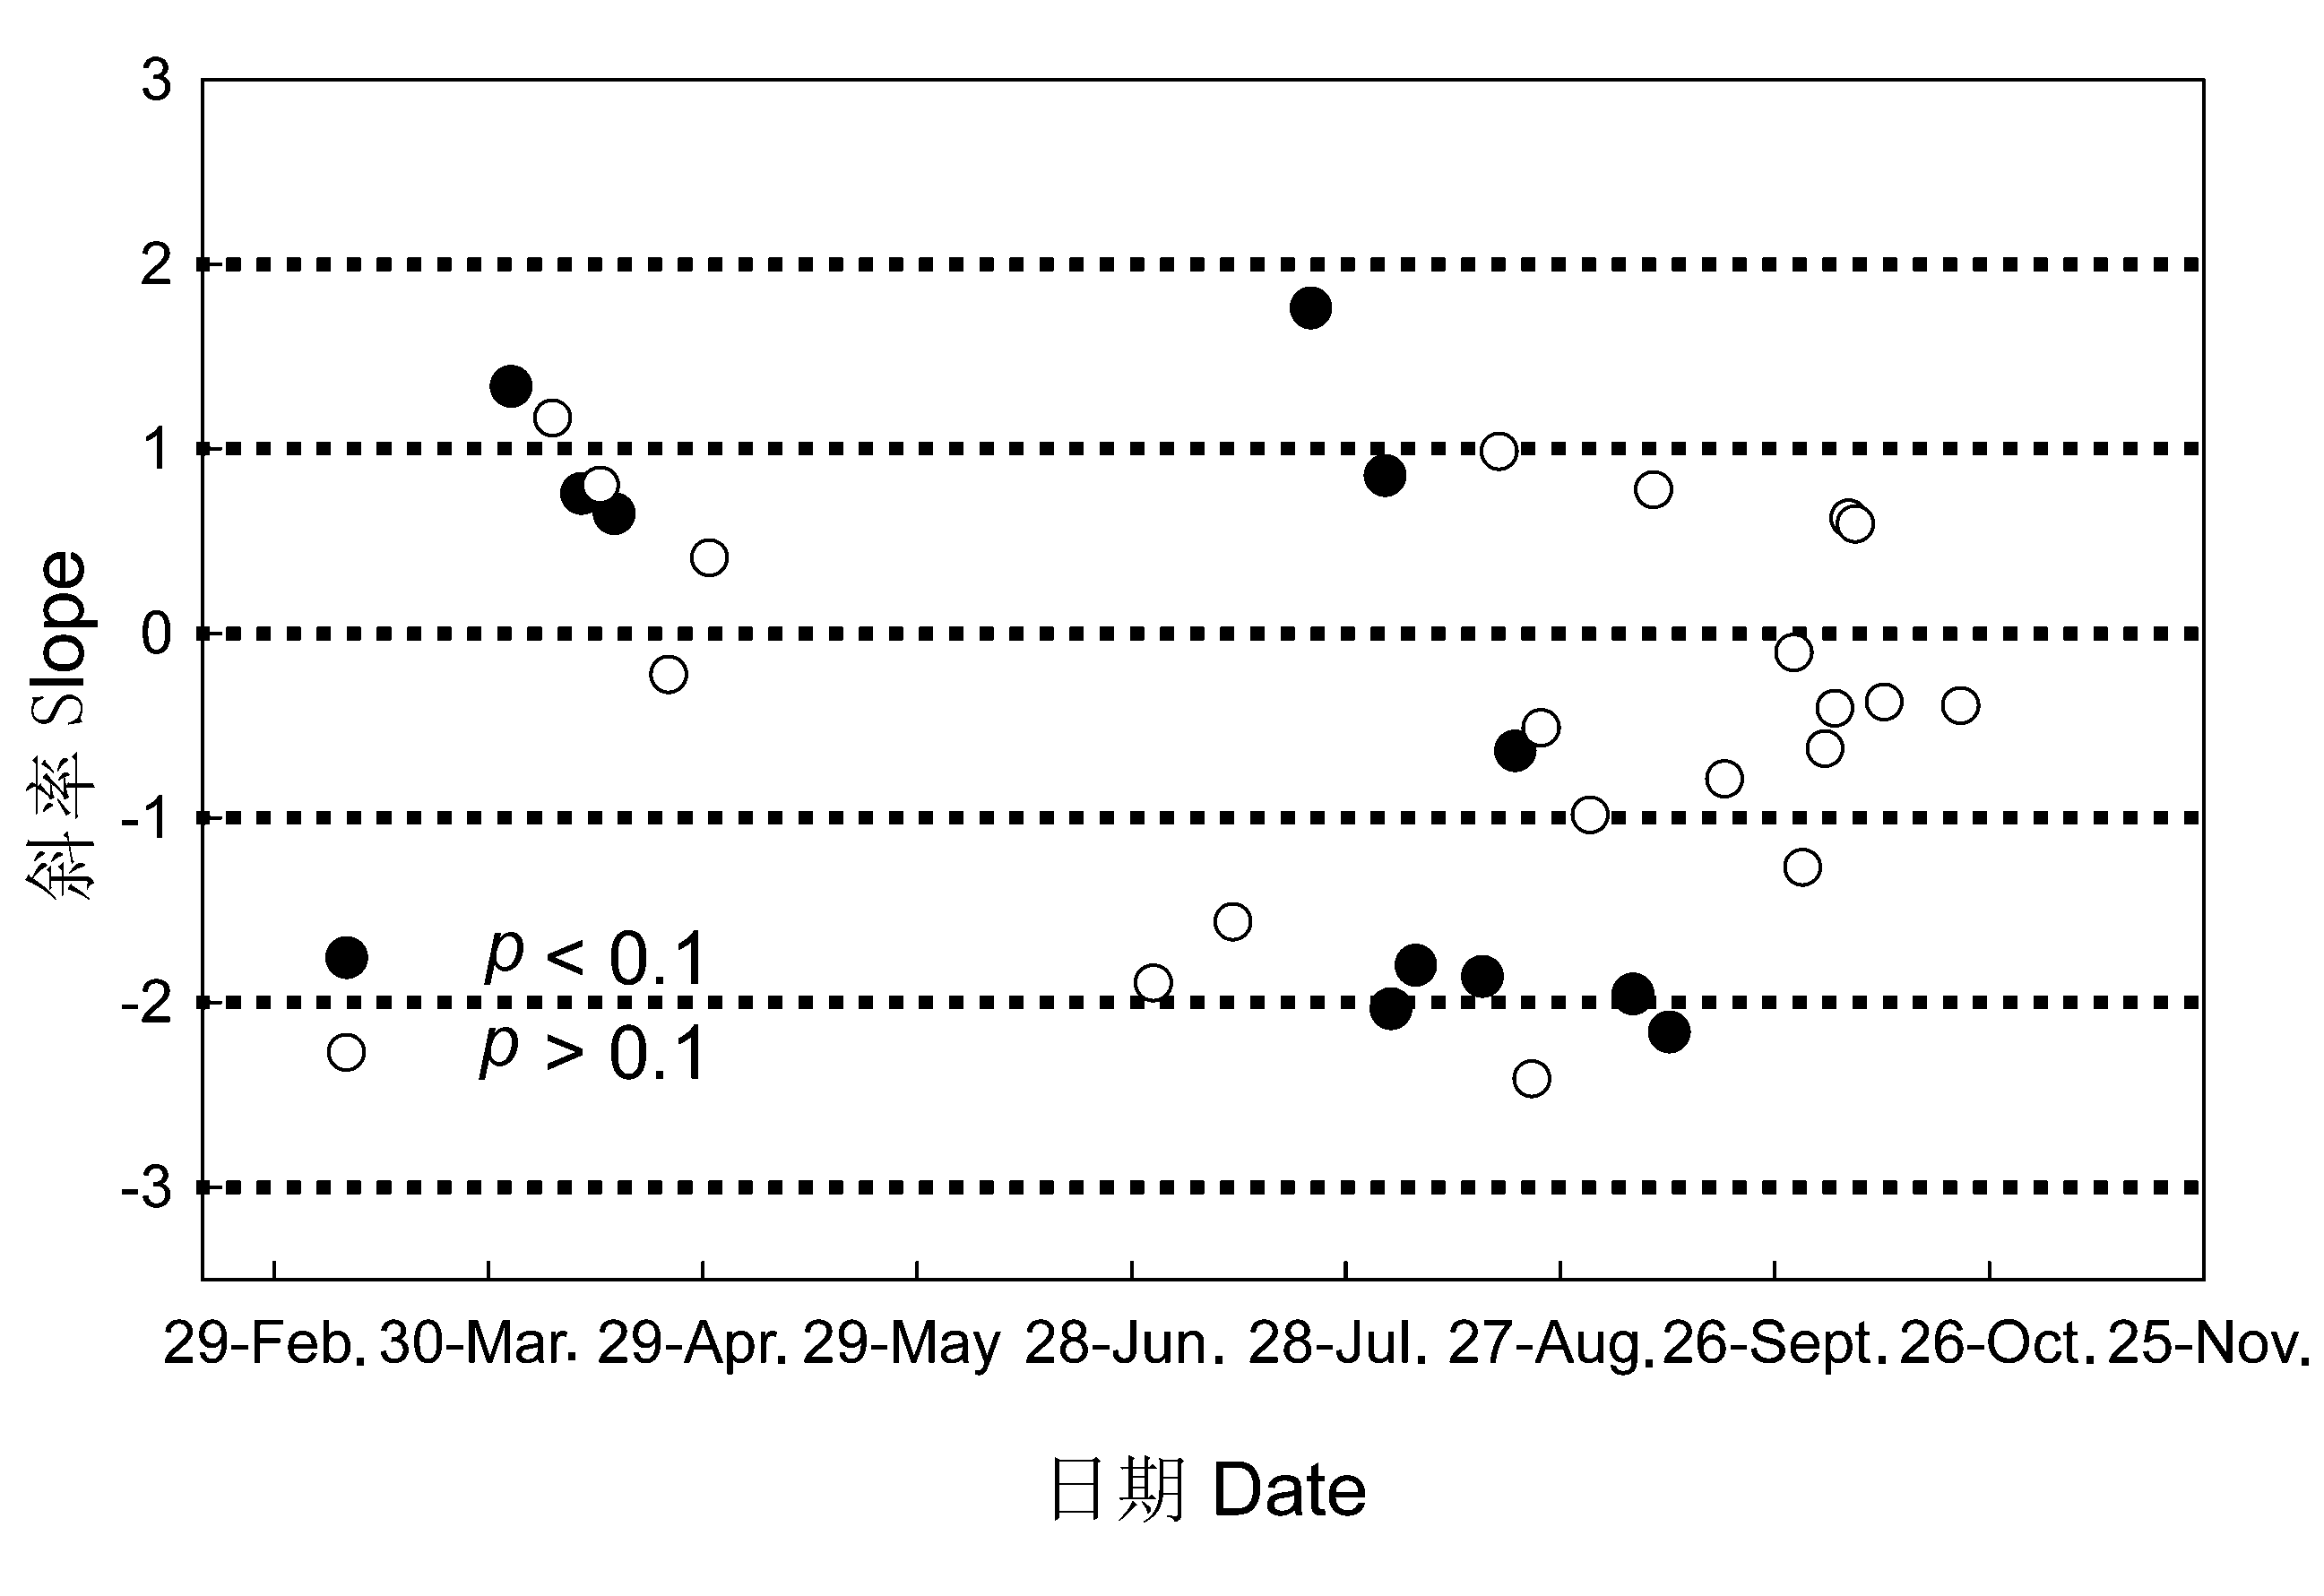
图2 1985~2002年内蒙古克氏针茅草原主要31个植物物候期随年份变化趋势及显著性水平
Fig. 2 Slope of linear trend for 31 phenological phases in Inner Mongolian Stipa krylovii steppe during 1985 to 2002
| 物候期 Phenophase | 日期 Date | 相关系数(r) Correlation coefficient | 月份 Month |
|---|---|---|---|
| P1 | 2-Apr. | 0.594*/0.644** | Mar.15b/Apr.15a |
| P3 | 12-Apr. | 0.548*/0.637**/0.608**/0.602*/0.532* | Jan.15b//Feb.15a/Feb15b/Mar.15a/Mar.15b |
| P4 | 14-Apr. | 0.508*/0.675** | Mar.15a/Mar.15b |
| P5 | 16-Apr. | 0.585*/0.554*/0.564*/0.495* | Feb.15a/Feb.15b/Mar.15a/Mar.15b |
| P7 | 29-Apr. | 0.512* | Mar.15b |
| P12 | 3-Aug. | -0.617* | Jul.15b |
| P13 | 6-Aug. | -0.514*/-0.711*/-0.604* | Jul.15a/Jul.15b/Aug.15a |
| P14 | 16-Aug. | -0.745**/-0.771**/-0.660* | Jul.15b/Aug.15a/Aug.15b |
| P17 | 23-Aug. | -0.853**/-0.834**/-0.685* | Jul.15b/Aug.15a/Aug.15b |
| P18 | 24-Aug. | -0.531*/-0.576*/-0.672**/-0.574* | Jul.15a/Jul.15b/Aug.15a/Aug.15b |
| P19 | 31-Aug. | -0.665*/-0.75** | Jul.15a/Jul.15b |
| P20 | 6-Sept. | -0.544*/-0.64*/-0.578* | Jul.15a/Jul.15b/Aug.15a |
| P22 | 11-Sept. | -0.894**/-0.891**/-0.788**/-0.613* | Jul.15b/Aug.15a/Aug.15b/Sept.15a |
| P23 | 19-Sept. | -0.668**/-0.69**/-0.621**/-0.486* | Jul.15a/Jul.15b/Aug.15a/Aug.15b |
| P25 | 29-Sept. | -0.672*/-0.703*/-0.612* | Jul.15a/Jul.15b/Aug.15a |
| P26 | 3-Oct. | -0.642** | Jul.15a |
| P27 | 4-Oct. | -0.71**/-0.546* | Jul.15a/Jul.15b |
表4 物候期与光的相关性分析
Table 4 Correlation between phenological phases and light
| 物候期 Phenophase | 日期 Date | 相关系数(r) Correlation coefficient | 月份 Month |
|---|---|---|---|
| P1 | 2-Apr. | 0.594*/0.644** | Mar.15b/Apr.15a |
| P3 | 12-Apr. | 0.548*/0.637**/0.608**/0.602*/0.532* | Jan.15b//Feb.15a/Feb15b/Mar.15a/Mar.15b |
| P4 | 14-Apr. | 0.508*/0.675** | Mar.15a/Mar.15b |
| P5 | 16-Apr. | 0.585*/0.554*/0.564*/0.495* | Feb.15a/Feb.15b/Mar.15a/Mar.15b |
| P7 | 29-Apr. | 0.512* | Mar.15b |
| P12 | 3-Aug. | -0.617* | Jul.15b |
| P13 | 6-Aug. | -0.514*/-0.711*/-0.604* | Jul.15a/Jul.15b/Aug.15a |
| P14 | 16-Aug. | -0.745**/-0.771**/-0.660* | Jul.15b/Aug.15a/Aug.15b |
| P17 | 23-Aug. | -0.853**/-0.834**/-0.685* | Jul.15b/Aug.15a/Aug.15b |
| P18 | 24-Aug. | -0.531*/-0.576*/-0.672**/-0.574* | Jul.15a/Jul.15b/Aug.15a/Aug.15b |
| P19 | 31-Aug. | -0.665*/-0.75** | Jul.15a/Jul.15b |
| P20 | 6-Sept. | -0.544*/-0.64*/-0.578* | Jul.15a/Jul.15b/Aug.15a |
| P22 | 11-Sept. | -0.894**/-0.891**/-0.788**/-0.613* | Jul.15b/Aug.15a/Aug.15b/Sept.15a |
| P23 | 19-Sept. | -0.668**/-0.69**/-0.621**/-0.486* | Jul.15a/Jul.15b/Aug.15a/Aug.15b |
| P25 | 29-Sept. | -0.672*/-0.703*/-0.612* | Jul.15a/Jul.15b/Aug.15a |
| P26 | 3-Oct. | -0.642** | Jul.15a |
| P27 | 4-Oct. | -0.71**/-0.546* | Jul.15a/Jul.15b |
| 物候期Phenophase | 日期 Date | 相关系数(r) Correlation coefficient | 月份 Month |
|---|---|---|---|
| P3 | 12-Apr. | 0.602* | 1 |
| P4 | 14-Apr. | 0.710** | 1 |
| P5 | 16-Apr. | 0.580* | 1 |
| P7 | 29-Apr. | 0.477* | 1 |
| P10 | 23-Jul. | 0.616* | 7 |
| P11 | 2-Aug. | 0.596*/0.777 7** | 6/7 |
| P27 | 4-Oct. | -0.479* | 8 |
表5 物候期与温度的相关性分析
Table 5 Correlation between phenological phases and mean air temperatures
| 物候期Phenophase | 日期 Date | 相关系数(r) Correlation coefficient | 月份 Month |
|---|---|---|---|
| P3 | 12-Apr. | 0.602* | 1 |
| P4 | 14-Apr. | 0.710** | 1 |
| P5 | 16-Apr. | 0.580* | 1 |
| P7 | 29-Apr. | 0.477* | 1 |
| P10 | 23-Jul. | 0.616* | 7 |
| P11 | 2-Aug. | 0.596*/0.777 7** | 6/7 |
| P27 | 4-Oct. | -0.479* | 8 |
| 物候期Phenophase | 日期 Date | 相关系数(r) Correlation coefficient | 月份 Month |
|---|---|---|---|
| P2 | 7-Apr. | 0.57*/0.567* | Pre-12、1 |
| P11 | 2-Aug. | -0.484* | 7 |
| P12 | 3-Aug. | -0.675** | 6 |
| P13 | 6-Aug. | -0.571* | 6 |
| P16 | 20-Aug. | -0.638* | 6 |
| P17 | 23-Aug. | -0.619* | 7 |
| P19 | 31-Aug. | -0.706* | 6 |
| P20 | 6-Sept. | 0.744** | 9 |
| P22 | 11-Sept. | 0.581* | 9 |
| P23 | 19-Sept. | -0.591*/-0.469* | 6/7 |
| P25 | 29-Sept. | 0.604* | 9 |
| P26 | 3-Oct. | 0.588* | 8 |
| P27 | 4-Oct. | 0.552* | 8 |
表6 物候期与降水的相关性分析
Table 6 Correlation between phenological phases and monthly mean precipitation (mm)
| 物候期Phenophase | 日期 Date | 相关系数(r) Correlation coefficient | 月份 Month |
|---|---|---|---|
| P2 | 7-Apr. | 0.57*/0.567* | Pre-12、1 |
| P11 | 2-Aug. | -0.484* | 7 |
| P12 | 3-Aug. | -0.675** | 6 |
| P13 | 6-Aug. | -0.571* | 6 |
| P16 | 20-Aug. | -0.638* | 6 |
| P17 | 23-Aug. | -0.619* | 7 |
| P19 | 31-Aug. | -0.706* | 6 |
| P20 | 6-Sept. | 0.744** | 9 |
| P22 | 11-Sept. | 0.581* | 9 |
| P23 | 19-Sept. | -0.591*/-0.469* | 6/7 |
| P25 | 29-Sept. | 0.604* | 9 |
| P26 | 3-Oct. | 0.588* | 8 |
| P27 | 4-Oct. | 0.552* | 8 |
| [1] |
Ahas R, Jaagus J, Aasa A (2000). The phenological calendar of Estonia and its correlation with mean air temperature. International Journal of Biometeorology, 44,159-166.
DOI URL PMID |
| [2] | Badeck W, Bondeau A, Böttcher K, Doktor D, Lucht W, Schaber J, Sitch S (2004). Responses of spring phenology to climate change. New Phytologist, 162,295-309. |
| [3] | Bradley NL, Leopold AC, Ross J, Huffaker W (1999). Phenological changes reflect climate change in Wisconsin. Proceedings of the National Academy of Sciences of the United States of America, 96,9701-9704. |
| [4] | Chen X, Hu B, Yu R (2005). Spatial and temporal variation of phenological growing season and climate change impacts in temperate eastern China. Global Change Biology, 11,1118-1130. |
| [5] |
Chmielewski FM, Müller A, Küchler W (2005). Possible impacts of climate change on natural vegetation in Saxony (Germany). International Journal of Biometeorology, 50,96-104.
DOI URL PMID |
| [6] |
Cleland EE, Chiariello NR, Loarie SR, Mooney HA, Field CB (2006). Diverse responses of phenology to global changes in a steppe ecosystem. Proceedings of the National Academy of Sciences of the United States of America, 103,13740-13744.
DOI URL PMID |
| [7] | Dunne JA, Harte J, Taylor KJ (2003). Subalpine meadow flowering phenology responses to climate change: integrating experimental and gradient methods. Ecological Monographs, 73,69-86. |
| [8] | Fang XQ (方修琦), Yu WH (余卫红) (2002). Progress in the studies on the phenological responding to global warming. Advance in Earth Sciences (地球科学进展), 10,714-719. (in Chinese with English abstract) |
| [9] | Golluscio RA, Oesterheld M, Aguiar MR (2005). Relationship between phenology and life form: a test with 25 Patagonian species. Ecography, 28,273-282. |
| [10] | Keeling CD, Chin JFS, Whorf TP (1996). Increased activity of northern vegetation inferred from atmospheric CO 2 measurements. Nature, 382,146-149. |
| [11] | Lieth H (1974). Purposes of a phenology book. In: Lieth H ed. Phenology and Seasonal Modeling. Springer-Verlag, New York, 3-19. |
| [12] | Linderholm HW (2006). Growing season changes in the last century. Agricultural and Forest Meteorology, 137,1-14. |
| [13] | Lucht W, Prentice IC, Myneni RB, Sitch S, Friedlingstein P, Cramer W, Bousquet P, Buermann W, Smith B (2002). Climatic control of the high-latitude vegetation greening trend and pinatubo effect. Science, 296,1687-1689. |
| [14] | Menzel A (2002). Phenology, its importance to the global change community editorial comment. Climatic Change, 54,379-385. |
| [15] | Menzel A (2003). Plant phenological “Fingerprints”, petection of climate change impacts. In: Schwartz MD ed. Phenology: An Integrative Environmental Science. Kluwer Academic Publishers, Dordrecht, Boston, London, 319-329. |
| [16] | Myneni RB, Keeling CD, Tucker CJ, Asrar G, Nemani RR (1997). Increased plant growth in the northern high latitudes from 1981 to 1991. Nature, 386,698-702. |
| [17] | Piao SL, Fang JY, Zhou LM, Ciais P, Zhu B (2006). Variations in satellite-derived phenology in China’s temperate vegetation. Global Change Biology, 12,672-685. |
| [18] | Piao SL, Friedlingstein P, Ciais P, Viovy N, Demarty J (2007). Growing season extension and its impact on terrestrial carbon cycle in the Northern Hemisphere over the past 2 decades. Global Biogeochemical Cycles, 21. doi: 10.1029/2006GB002888. |
| [19] |
Piao SL, Ciais P, Friedlingstein P, Peylin P, Reichstein M, Luyssaert S, Margolis H, Fang J, Barr A, Chen A, Grelle A, Hollinger DY, Laurila T, Lindroth A, Richardson AD, Vesala T (2008). Net carbon dioxide losses of northern ecosystems in response to autumn warming. Nature, 451. doi: 10.1038/nature06444.
DOI URL PMID |
| [20] | Price MV, Waser NM (1998). Effects of experimental warming on plant reproductive phenology in a subalpine meadow. Ecology, 79,1261-1271. |
| [21] | Schwartz MD, Ahas R, Aasa A (2006). Onset of spring starting earlier across the Northern Hemisphere. Global Change Biology, 12,343-351. |
| [22] |
Sherry RA, Zhou X, Gu S, Arnone III JA, Schimel DS, Verburg PS, Wallace LL, Luo Y (2007). Divergence of reproductive phenology under climate warming. Proceedings of the National Academy of Sciences of the United States of America, 104,198-202.
DOI URL PMID |
| [23] | Spano D, Cesaraccio C, Duce P, Snyder RL (1999). Phenological stages of natural species and their use as climate indicators. International Journal of Biometeo- rology, 42,124-133. |
| [24] | Sparks TH, Smithers RJ (2002). Is spring getting earlier? Weather, 57,157-166. |
| [25] | Tucker CJ, Pinzon JE, Brown ME (2004). Global inventory modeling and mapping studies (GIMMS) satellite drift corrected and NOAA-16 incorporated normalized difference vegetation index (NDVI), monthly 1981. |
| [26] | United Scientific Exploration Team of Inner Monglian and Ningxia, Chinese Academy of Sciences (中国科学院内蒙古宁夏综合考察队) (1985). Vegetation of Inner Monglian(内蒙古植被). Science Press, Beijing, 516-527. (in Chinese) |
| [27] |
Walther GR, Post E, Convey P, Menzel A, Parmesan C, Beebee TJC, Fromentin JM, Hoegh-Guldberg O, Bairlein F (2002). Ecological responses to recent climate change. Nature, 416,389-395.
DOI URL PMID |
| [28] | Wan MW (宛敏渭), Liu XZ (刘秀珍) (1979). Phenological Observation Method in China(中国物候观测方法). Science Press, Beijing, 42-58. (in Chinese) |
| [29] | Yuan WP (袁文平) (2007). Character and the Impact of Phenophase on Ecosystem Functions in Typical Grassland Ecosystem (典型草原物候特征及其对生态系统功能的影响研究). PhD dissertation, Institute of Botany, Chinese Academy of Sciences, Beijing, 16-17. (in Chinese) |
| [30] | Yuan W, Zhou G, Wang Y, Han X, Wang Y (2007). Simulating phenological characteristics of two dominant grass species in a semi-arid steppe ecosystem. Ecological Research, 22,784-791. |
| [31] | Zhang X, Tarpley D, Sullivan JT (2007). Diverse responses of vegetation phenology to a warming climate. Geophysical Research Letters, 34,L19405. doi: 10. 1029/2007GL031447. |
| [32] | Zheng J, Ge Q, Hao Z, Wang W (2006). Spring phenophases in recent decades over eastern china and its possible link to climate changes. Climatic Change, 77,449-462. |
| [33] | Zhou L, Tucker CJ, Kaufmann RK, Slayback D, Shabanov NV, Myneni RB (2001). Variation in northern vegetation activity inferred from satellite data of vegetation index during 1981 to 1999. Journal of Geophysical Research, 106,20069-20083. |
| [34] | Zhu KZ (竺可桢), Wan MW (宛敏渭) (1973). Phenology(物候学). Science Press, Beijing, 1-131. (in Chinese) |
| [1] | 张琳, 袁伟影, 宋创业, 吴冬秀. 1998-2010年中国典型生态系统长期监测样地环境要素、物种丰富度和生物量动态数据集[J]. 植物生态学报, 2025, 49(8): 1182-1190. |
| [2] | 范亚冉, 夏少攀, 于冰冰, 朱紫琪, 杨威, 范豫川, 刘晓雨, 张旭辉, 郑聚锋. 大气CO2浓度升高和增温对土壤有机碳库积累、分子组成和结构稳定性的影响[J]. 植物生态学报, 2025, 49(7): 1053-1069. |
| [3] | 王堃莹, 邱贵福, 刘子赫, 孟君, 刘宇轩, 贾国栋. 气候变化对不同退化程度小叶杨林分生长和内在水分利用效率的调节[J]. 植物生态学报, 2025, 49(2): 343-355. |
| [4] | 黄美红, 牛梦秋, 杨鹏飞, 林洁, 廖周瑜, 陈建国, 向建英. 不同温度和埋藏深度对高山垫状植物山生福禄草种子出苗及幼苗生长的影响[J]. 植物生态学报, 2025, 49(12): 2092-2104. |
| [5] | 贺艺, 周静, 陈宸, 房庭舟, 苏剑, 高浩杰, 曹嘉浩, 杨飞宇, 范淇博, 朱乐瑶, 陈薏名, 杨飞, 王毅腾, 冯雷, 刘飞, 梁爽, 蒋明凯, 陈军, 赵云鹏, 陈伟乐, 赵颖, 黄建国. 浙江海岛濒危树种的保护与恢复[J]. 植物生态学报, 2025, 49(10): 1583-1599. |
| [6] | 张鹏, 焦亮, 薛儒鸿, 魏梦圆, 杜达石, 吴璇, 王旭鸽, 李倩. 干旱强度影响祁连山西段不同海拔青海云杉的生长恢复[J]. 植物生态学报, 2024, 48(8): 977-987. |
| [7] | 史倩, 同小娟, 许玲玲, 孟平, 于裴洋, 李俊, 杨铭鑫. 油松早晚材径向生长对气候因子的响应[J]. 植物生态学报, 2024, 48(8): 988-1000. |
| [8] | 陈以恒, 玉素甫江•如素力, 阿卜杜热合曼•吾斯曼. 2001-2020年天山新疆段草地植被覆盖度时空变化及驱动因素分析[J]. 植物生态学报, 2024, 48(5): 561-576. |
| [9] | 梁逸娴, 王传宽, 臧妙涵, 上官虹玉, 刘逸潇, 全先奎. 落叶松径向生长和生物量分配对气候变暖的响应[J]. 植物生态学报, 2024, 48(4): 459-468. |
| [10] | 臧妙涵, 王传宽, 梁逸娴, 刘逸潇, 上官虹玉, 全先奎. 基于纬度移栽的落叶松叶、枝、根生态化学计量特征对气候变暖的响应[J]. 植物生态学报, 2024, 48(4): 469-482. |
| [11] | 张计深, 史新杰, 刘宇诺, 吴阳, 彭守璋. 气候变化下中国潜在自然植被生态系统碳储量动态[J]. 植物生态学报, 2024, 48(4): 428-444. |
| [12] | 吴茹茹, 刘美珍, 谷仙, 常馨月, 郭立月, 蒋高明, 祁如意. 气候变化对巨柏适宜生境分布的潜在影响和预测[J]. 植物生态学报, 2024, 48(4): 445-458. |
| [13] | 张启, 程雪寒, 王树芝. 北京西山老龄树记载的森林干扰历史[J]. 植物生态学报, 2024, 48(3): 341-348. |
| [14] | 杨宇萌, 来全, 刘心怡. 气候变化和人类活动对内蒙古植被总初级生产力的定量影响[J]. 植物生态学报, 2024, 48(3): 306-316. |
| [15] | 郭强, 韩子琛, 夏允, 杨柳明, 范跃新, 杨玉盛. 土壤微生物固碳机理及其影响因素研究进展[J]. 植物生态学报, 2024, 48(11): 1406-1421. |
| 阅读次数 | ||||||
|
全文 |
|
|||||
|
摘要 |
|
|||||
Copyright © 2026 版权所有 《植物生态学报》编辑部
地址: 北京香山南辛村20号, 邮编: 100093
Tel.: 010-62836134, 62836138; Fax: 010-82599431; E-mail: apes@ibcas.ac.cn, cjpe@ibcas.ac.cn
备案号: 京ICP备16067583号-19
![]()