
植物生态学报 ›› 2019, Vol. 43 ›› Issue (2): 94-106.DOI: 10.17521/cjpe.2018.0312 cstr: 32100.14.cjpe.2018.0312
所属专题: 生物多样性
温纯1,金光泽1,2,*( )
)
收稿日期:2018-12-13
接受日期:2019-02-13
出版日期:2019-02-20
发布日期:2019-06-04
基金资助:
WEN Chun1,JIN Guang-Ze1,2,*()
Received:2018-12-13
Accepted:2019-02-13
Online:2019-02-20
Published:2019-06-04
Supported by:摘要:
为比较生物量比率假说与生态位互补假说在解释生产力变异的相对重要性, 探讨生物多样性和生产力之间的关系是否受到生物和非生物因素的影响, 该研究依托小兴安岭9 hm 2阔叶红松(Pinus koraiensis)林动态监测样地, 通过计算群落初始生物量、物种多样性、功能多样性、植物性状的群落加权平均值和测定环境因子, 运用线性回归模型、结构方程模型, 比较了物种多样性和功能多样性与生产力的相关性。结果表明: (1)物种多样性和功能多样性均对生产力有显著作用, 功能多样性比物种多样性与生产力的关系更为密切; (2)功能多样性指数比群落加权平均值能更好地解释生产力变异, 说明生态位互补假说更适用于解释阔叶红松林群落内生产力的变异; (3)生物多样性与生产力的关系受生物因素与非生物因素的共同作用, 相较于多样性和功能性状组成(植被质量), 初始林分生物量(植被数量)能更有效地解释生产力的变异。生物多样性与生产力关系的研究应从植被质量与植被数量同时出发, 评估生态系统过程的多种非生物和生物驱动因素, 同时维护森林功能多样性, 加强植物与土壤环境的保护, 对有效增加生产力和维持生物多样性具有重要意义。
温纯, 金光泽. 功能多样性对典型阔叶红松林生产力的影响. 植物生态学报, 2019, 43(2): 94-106. DOI: 10.17521/cjpe.2018.0312
WEN Chun, JIN Guang-Ze. Effects of functional diversity on productivity in a typical mixed broadleaved-Korean pine forest. Chinese Journal of Plant Ecology, 2019, 43(2): 94-106. DOI: 10.17521/cjpe.2018.0312
| 功能性状 Functional trait | 功能意义 Functional significance |
|---|---|
| 木材密度 Wood density (WD) (g·mm-3) | 木材经济谱, 生长和生存之间的权衡, 水的运输和分配 Wood economic spectrum, trade-off between growth, transport and distribution of water |
| 最大高度 Maximum height (MH) (m) | 植物竞争活力与策略, 光生态位, 结构多样性 Plant competitive vigor and strategy, light niche, structural diversity |
| 比叶面积 Specific leaf area (SLA) (mm2·g-1) | 叶经济谱, 植物耐荫性 Leaf economic spectrum, plant shade tolerance |
| 叶面积 Leaf area (LA) (mm2) | 光竞争, 蒸腾速率 Light acquisition, transpiration rate |
| 叶片厚度 Leaf thickness (LT) (mm) | 储水能力, 蒸腾速率 Storage capacity, transpiration rate |
| 叶片干物质含量 Leaf dry matter content (LDMC) (mg·g-1) | 养分吸收, 结构物质 Nutrient absorption, structural substance |
| 叶片碳含量 Leaf carbon concentration (LCC) (mg·g-1) | 结构物质, 养分吸收 Structural substance, nutrient absorption |
| 叶片氮含量 Leaf nitrogen concentration (LNC) (mg·g-1) | 叶经济谱, 氮吸收 Leaf economic spectrum, nitrogen acquisition |
表1 与植物生长和群落生产力相关的8种功能性状及其意义
Table 1 Eight functional traits related to plant growth and community woody productivity and their significance
| 功能性状 Functional trait | 功能意义 Functional significance |
|---|---|
| 木材密度 Wood density (WD) (g·mm-3) | 木材经济谱, 生长和生存之间的权衡, 水的运输和分配 Wood economic spectrum, trade-off between growth, transport and distribution of water |
| 最大高度 Maximum height (MH) (m) | 植物竞争活力与策略, 光生态位, 结构多样性 Plant competitive vigor and strategy, light niche, structural diversity |
| 比叶面积 Specific leaf area (SLA) (mm2·g-1) | 叶经济谱, 植物耐荫性 Leaf economic spectrum, plant shade tolerance |
| 叶面积 Leaf area (LA) (mm2) | 光竞争, 蒸腾速率 Light acquisition, transpiration rate |
| 叶片厚度 Leaf thickness (LT) (mm) | 储水能力, 蒸腾速率 Storage capacity, transpiration rate |
| 叶片干物质含量 Leaf dry matter content (LDMC) (mg·g-1) | 养分吸收, 结构物质 Nutrient absorption, structural substance |
| 叶片碳含量 Leaf carbon concentration (LCC) (mg·g-1) | 结构物质, 养分吸收 Structural substance, nutrient absorption |
| 叶片氮含量 Leaf nitrogen concentration (LNC) (mg·g-1) | 叶经济谱, 氮吸收 Leaf economic spectrum, nitrogen acquisition |
| 变量 Variables | 范围 Range | 平均值 Mean | 标准偏差 SD |
|---|---|---|---|
| 凹凸度 Convexity | -1.91-2.36 | 0.01 | 0.40 |
| 海拔 Elevation (m) | 425.45-505.52 | 463.25 | 18.20 |
| 坡度 Slope (°) | 3.30-38.46 | 15.91 | 6.49 |
| 速效氮含量 Soil available nitrogen content (mg·kg-1) | 605.77-1 482.85 | 1 103.60 | 161.34 |
| 速效磷含量 Soil available phosphorus content (mg·kg-1) | 2.54-61.96 | 8.83 | 6.96 |
| 速效钾含量 Soil available potassium content (mg·kg-1) | 190.46-516.66 | 332.61 | 59.05 |
| 全氮含量 Soil total nitrogen content (g·kg-1) | 4.60-12.28 | 8.40 | 1.60 |
| 全磷含量 Soil total phosphorus content (g·kg-1) | 0.40-1.19 | 0.82 | 0.15 |
| pH值 Soil pH | 5.34-6.29 | 5.77 | 0.16 |
| 有机碳含量 Soil organic carbon content (%) | 31.29-216.77 | 75.75 | 31.25 |
| 土壤容重 Soil bulk density (mg·m-3) | 0.41-0.87 | 0.62 | 0.10 |
| 体积含水率 Soil bulk moisture content (%) | 13.72-48.40 | 30.35 | 5.91 |
| 质量含水率 Soil mass moisture content (%) | 0.54-1.51 | 0.91 | 0.23 |
表2 阔叶红松林9 hm2样地内基础环境变量信息统计表
Table 2 Summary of environment variables in a 9 hm2 mixed broadleaved-Korean pine forest plot
| 变量 Variables | 范围 Range | 平均值 Mean | 标准偏差 SD |
|---|---|---|---|
| 凹凸度 Convexity | -1.91-2.36 | 0.01 | 0.40 |
| 海拔 Elevation (m) | 425.45-505.52 | 463.25 | 18.20 |
| 坡度 Slope (°) | 3.30-38.46 | 15.91 | 6.49 |
| 速效氮含量 Soil available nitrogen content (mg·kg-1) | 605.77-1 482.85 | 1 103.60 | 161.34 |
| 速效磷含量 Soil available phosphorus content (mg·kg-1) | 2.54-61.96 | 8.83 | 6.96 |
| 速效钾含量 Soil available potassium content (mg·kg-1) | 190.46-516.66 | 332.61 | 59.05 |
| 全氮含量 Soil total nitrogen content (g·kg-1) | 4.60-12.28 | 8.40 | 1.60 |
| 全磷含量 Soil total phosphorus content (g·kg-1) | 0.40-1.19 | 0.82 | 0.15 |
| pH值 Soil pH | 5.34-6.29 | 5.77 | 0.16 |
| 有机碳含量 Soil organic carbon content (%) | 31.29-216.77 | 75.75 | 31.25 |
| 土壤容重 Soil bulk density (mg·m-3) | 0.41-0.87 | 0.62 | 0.10 |
| 体积含水率 Soil bulk moisture content (%) | 13.72-48.40 | 30.35 | 5.91 |
| 质量含水率 Soil mass moisture content (%) | 0.54-1.51 | 0.91 | 0.23 |
| 假说 Hypothesis | 指数 Index | 平均值 Mean | 范围 Range |
|---|---|---|---|
| 生物量比率假说 Mass ratio hypothesis | 木材密度的群落加权平均值 CWM of wood density (CWMWD) (g·mm-3) | 0.47 | 0.34-0.63 |
| 最大树高的群落加权平均值 CWM of maximum height (CWMMH) (m) | 17.24 | 4.59-43.01 | |
| 比叶面积的群落加权平均值 CWM of specific leaf area (CWMSLA) (mm2·g-1) | 254.30 | 158.29-392.23 | |
| 叶面积的群落加权平均值 CWM of leaf area (CWMLA) (mm2) | 33.87 | 8.20-74.54 | |
| 叶片厚度的群落加权平均值 CWM of leaf thickness (CWMLT) (mm) | 0.18 | 0.08-0.44 | |
| 叶干物质含量的群落加权平均值 CWM of leaf dry matter content (CWMLDMC) ( mg·g-1) | 0.29 | 0.19-0.38 | |
| 叶片碳含量的群落加权平均值 CWM of leaf carbon content (CWMLCC) ( mg·g-1) | 499.22 | 446.90-563.74 | |
| 叶片氮含量的群落加权平均值 CWM of leaf nitrogen content (CWMLNC) ( mg·g-1) | 23.56 | 17.49-32.38 | |
| 生态位互补假说 Niche complementarity hypothesis | 物种丰富度 Species richness (C) | 6.42 | 2-13 |
| 香农指数 Shannon index (H°) | 1.45 | 0.41-2.24 | |
| 辛普森指数 Simpson index (D) | 0.71 | 0.24-0.88 | |
| 均匀度指数 Evenness index (J) | 0.89 | 0.42-1.00 | |
| 多维功能均匀度指数 Multidimensional functional evenness index (FEve) | 0.72 | 0.21-0.99 | |
| Rao二次熵指数 Rao’s quadratic entropy index (FDQ) | 8.39 | 0.81-15.41 | |
| 8个性状组合的功能分散指数 FD is based on eight traits combined (FDcom) | 2.68 | 0.72-3.87 | |
| 木材密度的功能分散指数 FD is based on wood density (FDWD) | 0.48 | 0.01-1.13 | |
| 最大高度的功能分散指数 FD is based on maximum height (FDMH) | 0.78 | 0.07-1.71 | |
| 比叶面积的功能分散指数 FD is based on specific leaf area (FDSLA) | 0.63 | 0.02-1.61 | |
| 叶面积的功能分散指数 FD is based on leaf area (FDLA) | 0.66 | 0.02-1.61 | |
| 叶片厚度的功能分散指数 FD is based on leaf thickness (FDLT) | 0.58 | 0.03-1.51 | |
| 叶干物质含量的功能分散指数 FD is based on leaf dry matter content (FDLDMC) | 0.58 | 0.06-1.26 | |
| 叶片碳含量的功能分散指数 FD is based on leaf carbon content (FDLCC) | 0.93 | 0.03-2.37 | |
| 叶片氮含量的功能分散指数 FD is based on leaf nitrogen content (FDLNC) | 0.51 | 0.03-2.38 |
表3 阔叶红松林9 hm2功能多样性指数、物种多样性指数及群落加权平均值(CWM)信息统计表
Table 3 Summary of functional diversity, species diversity indexes and community-weighted mean (CWM) functional traits in a 9 hm2 mixed broadleaved-?Korean pine forest plot
| 假说 Hypothesis | 指数 Index | 平均值 Mean | 范围 Range |
|---|---|---|---|
| 生物量比率假说 Mass ratio hypothesis | 木材密度的群落加权平均值 CWM of wood density (CWMWD) (g·mm-3) | 0.47 | 0.34-0.63 |
| 最大树高的群落加权平均值 CWM of maximum height (CWMMH) (m) | 17.24 | 4.59-43.01 | |
| 比叶面积的群落加权平均值 CWM of specific leaf area (CWMSLA) (mm2·g-1) | 254.30 | 158.29-392.23 | |
| 叶面积的群落加权平均值 CWM of leaf area (CWMLA) (mm2) | 33.87 | 8.20-74.54 | |
| 叶片厚度的群落加权平均值 CWM of leaf thickness (CWMLT) (mm) | 0.18 | 0.08-0.44 | |
| 叶干物质含量的群落加权平均值 CWM of leaf dry matter content (CWMLDMC) ( mg·g-1) | 0.29 | 0.19-0.38 | |
| 叶片碳含量的群落加权平均值 CWM of leaf carbon content (CWMLCC) ( mg·g-1) | 499.22 | 446.90-563.74 | |
| 叶片氮含量的群落加权平均值 CWM of leaf nitrogen content (CWMLNC) ( mg·g-1) | 23.56 | 17.49-32.38 | |
| 生态位互补假说 Niche complementarity hypothesis | 物种丰富度 Species richness (C) | 6.42 | 2-13 |
| 香农指数 Shannon index (H°) | 1.45 | 0.41-2.24 | |
| 辛普森指数 Simpson index (D) | 0.71 | 0.24-0.88 | |
| 均匀度指数 Evenness index (J) | 0.89 | 0.42-1.00 | |
| 多维功能均匀度指数 Multidimensional functional evenness index (FEve) | 0.72 | 0.21-0.99 | |
| Rao二次熵指数 Rao’s quadratic entropy index (FDQ) | 8.39 | 0.81-15.41 | |
| 8个性状组合的功能分散指数 FD is based on eight traits combined (FDcom) | 2.68 | 0.72-3.87 | |
| 木材密度的功能分散指数 FD is based on wood density (FDWD) | 0.48 | 0.01-1.13 | |
| 最大高度的功能分散指数 FD is based on maximum height (FDMH) | 0.78 | 0.07-1.71 | |
| 比叶面积的功能分散指数 FD is based on specific leaf area (FDSLA) | 0.63 | 0.02-1.61 | |
| 叶面积的功能分散指数 FD is based on leaf area (FDLA) | 0.66 | 0.02-1.61 | |
| 叶片厚度的功能分散指数 FD is based on leaf thickness (FDLT) | 0.58 | 0.03-1.51 | |
| 叶干物质含量的功能分散指数 FD is based on leaf dry matter content (FDLDMC) | 0.58 | 0.06-1.26 | |
| 叶片碳含量的功能分散指数 FD is based on leaf carbon content (FDLCC) | 0.93 | 0.03-2.37 | |
| 叶片氮含量的功能分散指数 FD is based on leaf nitrogen content (FDLNC) | 0.51 | 0.03-2.38 |
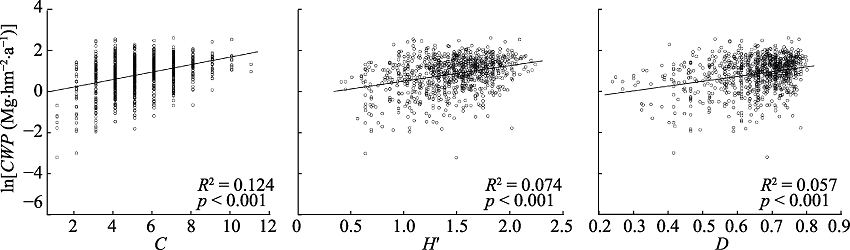
图1 典型阔叶红松林群落地上生产力(ln转换后)与物种多样性指数的关系。CWP、C、H°、D分别表示群落地上生产力、物种丰富度、香农指数和辛普森指数。
Fig. 1 Relationships between coarse woody productivity (ln transformed) and species diversity index of communities in a typical mixed broadleaved-Korean pine forest. CWP, C, H°, D represent coarse woody productivity, species richness, Shannon index and Simpson index, respectively.
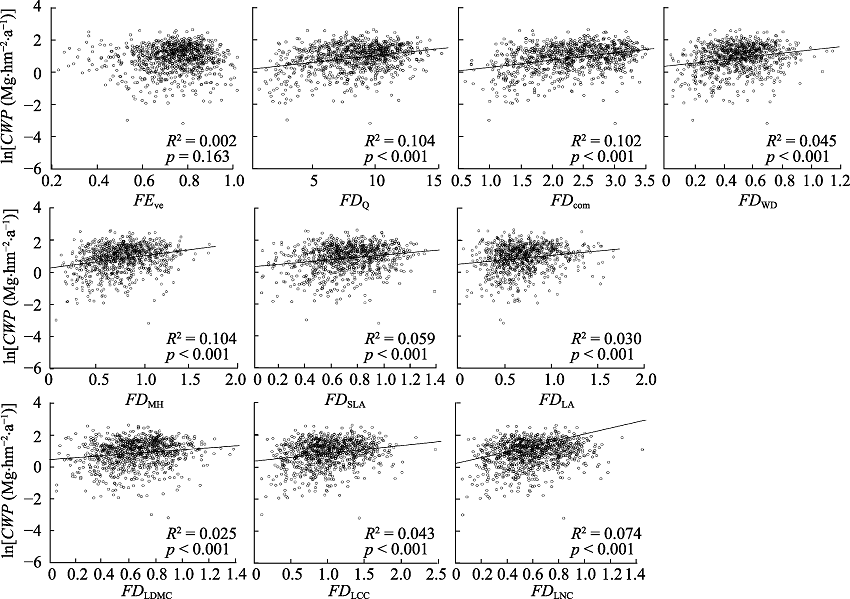
图2 典型阔叶红松林群落地上生产力(ln转换后)与功能多样性指数的关系。CWP, 群落地上生产力; FEve, 多维功能均匀度指数; FDQ, Rao二次熵指数; FDcom, 8个性状组合的功能分散指数; FDWD, 木材密度的功能分散指数; FDMH, 最大高度的功能分散指数; FDSLA, 比叶面积的功能分散指数; FDLA, 叶面积的功能分散指数; FDLDMC, 叶干物质含量的功能分散指数; FDLCC, 叶片碳含量的功能分散指数; FDLNC, 叶片氮含量的功能分散指数。
Fig. 2 Relationships between coarse woody productivity (ln transformed) and functional diversity index of communities in a typical mixed broadleaved-Korean pine forest. CWP, coarse woody productivity; FEve, multidimensional functional evenness index; FDQ, Rao’s quadratic entropy index; FDcom, functional dispersion indices of eight trait combinations; FDWD, functional dispersion indices of wood density; FDMH, functional dispersion indices of maximum height; FDSLA, functional dispersion indices of specific leaf area; FDLA, functional dispersion indices of leaf area; FDLDMC, functional dispersion indices of leaf dry matter content; FDLCC, functional dispersion indices of leaf carbon content; FDLNC, functional dispersion indices of leaf nitrogen content.
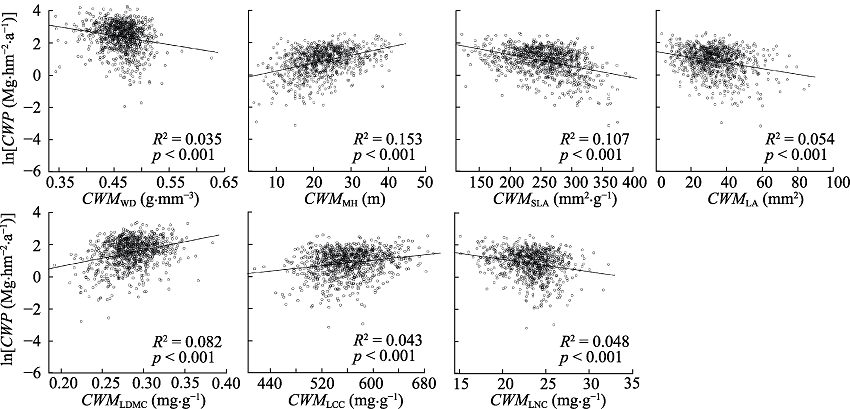
图3 典型阔叶红松林群落地上生产力(ln转换后)与群落加权平均值的关系。CWP, 群落地上生产力; CWMWD, 木材密度的群落加权平均值; CWMMH, 最大树高的群落加权平均值; CWMSLA, 比叶面积的群落加权平均值; CWMLA, 叶面积的群落加权平均值; CWMLDMC, 叶干物质含量的群落加权平均值; CWMLCC, 叶片碳含量的群落加权平均值; CWMLNC, 叶片氮含量的群落加权平均值。
Fig. 3 Relationships between coarse woody productivity (ln transformed) and community weighted mean of different traits of communities in a typical mixed broadleaved-Korean pine forest. CWP, coarse woody productivity; CWMWD, CWM of wood density; CWMMH, CWM of maximum height; CWMSLA, CWM of specific leaf area; CWMLA, CWM of leaf area; CWMLDMC, CWM of leaf dry matter content; CWMLCC, CWM of leaf carbon content; CWMLNC, CWM of leaf nitrogen content.
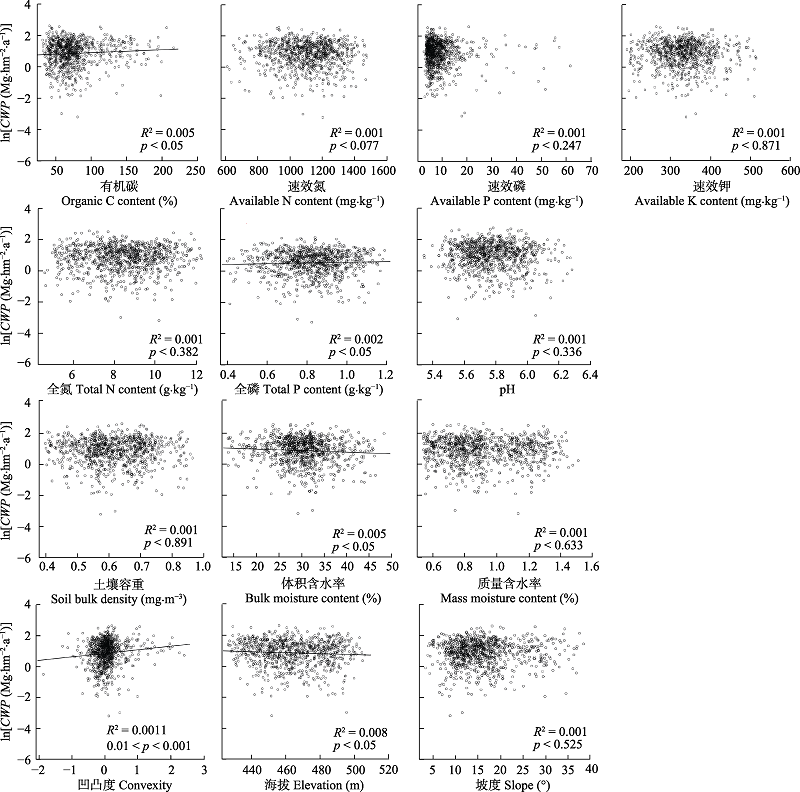
图4 典型阔叶红松林群落地上生产力(ln转换后, CWP)与各环境因子的关系。
Fig. 4 Relationships between coarse woody productivity (ln transformed, CWP) and environmental factors in a typical mixed broadleaved-Korean pine forest.
| 模型参数 Model parameters | 物种多样性模型 Species diversity model | 功能多样性模型 Functional diversity models | ||
|---|---|---|---|---|
| A | B | C | ||
| R2 | 0.169 | 0.269 | 0.188 | 0.377 |
| AIC | 2 148.61 | 2 047.73 | 2 136.52 | 1 932.43 |
表4 典型阔叶红松林群落生产力与多样性构建的线性回归模型评价
Table 4 Evaluation of linear regression models for forest productivity and diversity in a typical mixed broadleaved-Korean pine forest
| 模型参数 Model parameters | 物种多样性模型 Species diversity model | 功能多样性模型 Functional diversity models | ||
|---|---|---|---|---|
| A | B | C | ||
| R2 | 0.169 | 0.269 | 0.188 | 0.377 |
| AIC | 2 148.61 | 2 047.73 | 2 136.52 | 1 932.43 |
| 指标 Indicator | 解释变量 Explanatory variable | |||||||||||||||||||||||||
|---|---|---|---|---|---|---|---|---|---|---|---|---|---|---|---|---|---|---|---|---|---|---|---|---|---|---|
| CWMMH | CWMLCC | CWMSLA | CWMLNC | CWMLA | CWMWD | CWMLDMC | ||||||||||||||||||||
| 变量重要性 Variable importance | 1.00 | 1.00 | 0.90 | 0.67 | 0.48 | 0.39 | 0.14 | |||||||||||||||||||
| 含变量模型数 Containing models | 10 | 10 | 9 | 6 | 5 | 4 | 2 | |||||||||||||||||||
| 指标 Indicator | 解释变量 Explanatory variable | |||||||||||||||||||||||||
| FDMH | FDQ | FDcom | FDSLA | C | D | H° | FDLA | FDWD | FDLCC | FEve | FDLDMC | |||||||||||||||
| 变量重要性 Variable importance | 1.00 | 1.00 | 0.88 | 0.88 | 0.88 | 0.69 | 0.69 | 0.69 | 0.69 | 0.36 | 0.21 | 0.19 | ||||||||||||||
| 含变量模型数 Containing models | 8 | 8 | 7 | 7 | 7 | 5 | 5 | 5 | 5 | 3 | 2 | 2 | ||||||||||||||
| 指标 Indicator | 解释变量 Explanatory variable | |||||||||||||||||||||||||
| 海拔 Elevation | 全磷含量 Total P content | 凹凸度 Convexity | 速效磷含量 Available P content | 有机碳含量 Organic C content | 速效氮含量 Available N content | 体积含水率 Bulk moisture | 坡度 Slope | pH | ||||||||||||||||||
| 变量重要性 Variable importance | 1.00 | 0.95 | 0.85 | 0.68 | 0.53 | 0.26 | 0.21 | 0.09 | 0.04 | |||||||||||||||||
| 含变量模型数 Containing models | 17 | 16 | 14 | 11 | 9 | 4 | 4 | 2 | 1 | |||||||||||||||||
表5 与生产力构建的线性模型中各变量相对重要性筛选结果
Table 5 Relative importance of variables in linear model constructed with productivity
| 指标 Indicator | 解释变量 Explanatory variable | |||||||||||||||||||||||||
|---|---|---|---|---|---|---|---|---|---|---|---|---|---|---|---|---|---|---|---|---|---|---|---|---|---|---|
| CWMMH | CWMLCC | CWMSLA | CWMLNC | CWMLA | CWMWD | CWMLDMC | ||||||||||||||||||||
| 变量重要性 Variable importance | 1.00 | 1.00 | 0.90 | 0.67 | 0.48 | 0.39 | 0.14 | |||||||||||||||||||
| 含变量模型数 Containing models | 10 | 10 | 9 | 6 | 5 | 4 | 2 | |||||||||||||||||||
| 指标 Indicator | 解释变量 Explanatory variable | |||||||||||||||||||||||||
| FDMH | FDQ | FDcom | FDSLA | C | D | H° | FDLA | FDWD | FDLCC | FEve | FDLDMC | |||||||||||||||
| 变量重要性 Variable importance | 1.00 | 1.00 | 0.88 | 0.88 | 0.88 | 0.69 | 0.69 | 0.69 | 0.69 | 0.36 | 0.21 | 0.19 | ||||||||||||||
| 含变量模型数 Containing models | 8 | 8 | 7 | 7 | 7 | 5 | 5 | 5 | 5 | 3 | 2 | 2 | ||||||||||||||
| 指标 Indicator | 解释变量 Explanatory variable | |||||||||||||||||||||||||
| 海拔 Elevation | 全磷含量 Total P content | 凹凸度 Convexity | 速效磷含量 Available P content | 有机碳含量 Organic C content | 速效氮含量 Available N content | 体积含水率 Bulk moisture | 坡度 Slope | pH | ||||||||||||||||||
| 变量重要性 Variable importance | 1.00 | 0.95 | 0.85 | 0.68 | 0.53 | 0.26 | 0.21 | 0.09 | 0.04 | |||||||||||||||||
| 含变量模型数 Containing models | 17 | 16 | 14 | 11 | 9 | 4 | 4 | 2 | 1 | |||||||||||||||||
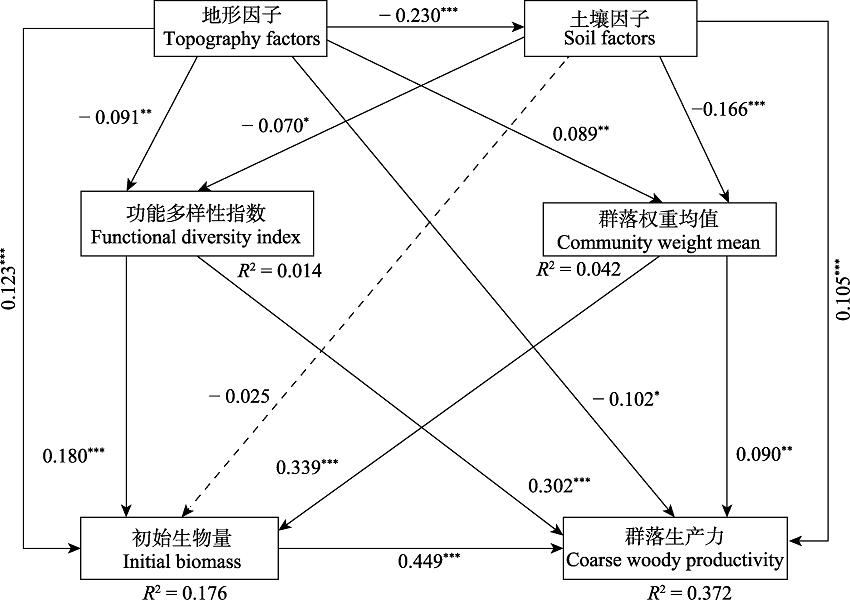
图5 结构方程模型分析环境因子、功能多样性、群落加权平均值和森林初始生物量对典型阔叶红松林群落生产力影响的结果。图中实线表示作用路径显著, 虚线表示作用路径不显著。箭头旁边的值是具有相应统计意义的标准化路径系数。R²表示由组合自变量解释的因变量的总变化。***, p < 0.001; **, p < 0.01; *, p < 0.05。
Fig. 5 Structural equation model (SEM) analysis of the effects of environmental factors, functional diversity, community-weight mean of functional traits and forest initial biomass on community woody productivity in a typical mixed broadleaved-Korean pine forest. Solid lines indicate significant paths, while dashed lines indicate insignificant paths. R² indicates the total variation in a dependent variable that is explained by the combined independent variables. ***, p < 0.001; **, p < 0.01; *, p < 0.05.
| 解释变量 Explanatory variable | 对生产力的作用途径 Pathway to productivity | 结构方程模型 SEM | |||
|---|---|---|---|---|---|
| 影响效应 Effect | p | ||||
| 地形因子 Topography factors | 直接效应 Direct effect | -0.102 | 0.003 | ||
| 功能多样性的间接效应 Indirect effect via functional diversity | -0.027 | 0.009 | |||
| 群落加权平均值的间接效应 Indirect effect via CWMs | 0.008 | 0.043 | |||
| 初始生物量的间接效应 Indirect effect via initial biomass | 0.055 | <0.001 | |||
| 土壤因子的间接效应 Indirect effect via soil factors | -0.024 | 0.002 | |||
| 总效应 Total effect | -0.090 | <0.001 | |||
| 土壤因子 Edaphic factors | 直接效应 Direct effect | 0.105 | <0.001 | ||
| 功能多样性的间接效应 Indirect effect via functional diversity | -0.021 | 0.045 | |||
| 群落加权平均值的间接效应 Indirect effect via CWMs | -0.015 | 0.008 | |||
| 总效应 Total effect | 0.069 | 0.019 | |||
| 功能多样性 Functional diversity | 直接效应 Direct effect | 0.302 | <0.001 | ||
| 初始生物量的间接效应 Indirect effect via initial biomass | 0.081 | <0.001 | |||
| 总效应 Total effect | 0.383 | <0.001 | |||
| 群落加权平均值 Community-weighted mean functional traits | 直接效应 Direct effect | 0.090 | 0.002 | ||
| 初始生物量的间接效应 Indirect effect via initial biomass | 0.152 | <0.001 | |||
| 总效应 Total effect | 0.242 | <0.001 | |||
| 地上初始生物量 Initial standing biomass | 直接效应 Direct effect | 0.449 | <0.001 | ||
| 总效应 Total effect | 0.449 | <0.001 | |||
表6 基于结构方程模型森林地上生产力的直接、间接和总标准化效应
Table 6 Direct, indirect, and total standardized effects on the forest productivity, based on the structural equation models (SEM)
| 解释变量 Explanatory variable | 对生产力的作用途径 Pathway to productivity | 结构方程模型 SEM | |||
|---|---|---|---|---|---|
| 影响效应 Effect | p | ||||
| 地形因子 Topography factors | 直接效应 Direct effect | -0.102 | 0.003 | ||
| 功能多样性的间接效应 Indirect effect via functional diversity | -0.027 | 0.009 | |||
| 群落加权平均值的间接效应 Indirect effect via CWMs | 0.008 | 0.043 | |||
| 初始生物量的间接效应 Indirect effect via initial biomass | 0.055 | <0.001 | |||
| 土壤因子的间接效应 Indirect effect via soil factors | -0.024 | 0.002 | |||
| 总效应 Total effect | -0.090 | <0.001 | |||
| 土壤因子 Edaphic factors | 直接效应 Direct effect | 0.105 | <0.001 | ||
| 功能多样性的间接效应 Indirect effect via functional diversity | -0.021 | 0.045 | |||
| 群落加权平均值的间接效应 Indirect effect via CWMs | -0.015 | 0.008 | |||
| 总效应 Total effect | 0.069 | 0.019 | |||
| 功能多样性 Functional diversity | 直接效应 Direct effect | 0.302 | <0.001 | ||
| 初始生物量的间接效应 Indirect effect via initial biomass | 0.081 | <0.001 | |||
| 总效应 Total effect | 0.383 | <0.001 | |||
| 群落加权平均值 Community-weighted mean functional traits | 直接效应 Direct effect | 0.090 | 0.002 | ||
| 初始生物量的间接效应 Indirect effect via initial biomass | 0.152 | <0.001 | |||
| 总效应 Total effect | 0.242 | <0.001 | |||
| 地上初始生物量 Initial standing biomass | 直接效应 Direct effect | 0.449 | <0.001 | ||
| 总效应 Total effect | 0.449 | <0.001 | |||
| [1] |
Ali A, Yan ER, Chang SX, Cheng JY, Liu XY ( 2017). Community-weighted mean of leaf traits and divergence of wood traits predict aboveground biomass in secondary subtropical forests. Science of the Total Environment, 574, 654-662.
DOI URL |
| [2] | Bartoń K ( 2018). Package ‘MuMIn’. . Cited: 2018-07-21. |
| [3] | Cardinale BJ, Duffy JE, Gonzalez A, Hooper DU, Perrings C, Venail P ( 2012). Biodiversity loss and its impact on humanity. Nature, 489, 59-67. |
| [4] |
Cardinale BJ, Gonzalez A ( 2011). The functional role of producer diversity in ecosystems. American Journal of Botany, 98, 572-592.
DOI URL |
| [5] |
Chang LW, Zeleny D, Li CF, Chiu ST, Hsieh CF ( 2013). Better environmental data may reverse conclusions about niche- and dispersal-based processes in community assembly. Ecology, 94, 2145-2151.
DOI URL |
| [6] |
Chave J, Condit R, Lao S, Caspersen JP, Foster RB, Hubbell SP ( 2003). Spatial and temporal variation of biomass in a tropical forest: Results from a large census plot in Panama. Journal of Ecology, 91, 240-252.
DOI URL |
| [7] | Chen CG, Zhu JF (1989). A Handbook for Main Tree Species Biomass in Northeast China. China Forestry Publishing House, Beijing. |
| [ 陈传国, 朱俊凤 (1989). 东北主要林木生物量手册. 中国林业出版社, 北京.] | |
| [8] |
Chen DM, Cheng JH, Chu PF, Mi J, Hu SJ, Xie YC, Tuvshintogtokh I, Bai YF ( 2016). Effect of diversity on biomass across grasslands on the Mongolian Plateau: Contrasting effects between plants and soil nematodes. Journal of Biogeography, 43, 955-966.
DOI URL |
| [9] |
Cornelissen JHC, Lavorel S, Garnier E, Diaz S, Buchmann N, Gurvich DE, Reich PB, ter Steege H, Morgan HD, van der Heijden MGA, Pausas JG, Poorter H ( 2003). A handbook of protocols for standardised and easy measurement of plant functional traits worldwide. Australian Journal of Botany, 51, 335-380.
DOI URL |
| [10] |
Díaz S, Lavorel S, Bello FD, Quétier F, Grigulis K, Robson TM ( 2007). Incorporating plant functional diversity effects in ecosystem service assessments. Proceedings of the National Academy of Sciences of the United States of America, 104, 20684-20689.
DOI URL |
| [11] |
Dănescu A, Albrecht AT, Bauhus J ( 2016). Structural diversity promotes productivity of mixed, uneven-aged forests in southwestern Germany. Oecologia, 182, 319-333.
DOI URL |
| [12] |
Edwards JR, Lambert LS ( 2007). Methods for integrating moderation and mediation: A general analytical framework using moderated path analysis. Psychological Methods, 12, 1-22.
DOI URL |
| [13] |
Finegan B, Peña-Claros M, de Oliveira A, Ascarrunz N, Bret-Harte MS, Carreño-Rocabado G, Casanoves F, Díaz S, Eguiguren Velepucha P, Fernandez F, Licona JC, Lorenzo L, Salgado Negret B, Vaz M, Poorter L, Canham C ( 2015). Does functional trait diversity predict above-ground biomass and productivity of tropical forests? Testing three alternative hypotheses. Journal of Ecology, 103, 191-201.
DOI URL |
| [14] | Fox J ( 2008). Applied Regression Analysis and Generalized Linear Models. 2nd edn. Sage Publications, Thousand Oaks, USA. |
| [15] |
Fox J, Monette G ( 1992). Generalized collinearity diagnostics. Journal of the American Statistical Association, 87, 178-183.
DOI URL |
| [16] |
Gazol A, Camarero JJ ( 2016). Functional diversity enhances silver fir growth resilience to an extreme drought. Journal of Ecology, 104, 1063-1075.
DOI URL |
| [17] |
Grace JB, Anderson TM, Seabloom EW, Borer ET, Adler PB, Harpole WS, Hautier Y, Hillebrand H, Lind EM, Partel M, Bakker JD, Buckley YM, Crawley MJ, Damschen EI, Davies KF, Fay PA, Firn J, Gruner DS, Hector A, Knops JM, MacDougall AS, Melbourne BA, Morgan JW, Orrock JL, Prober SM, Smith MD ( 2016). Integrative modelling reveals mechanisms linking productivity and plant species richness. Nature, 529, 390-393.
DOI |
| [18] |
Grime JP ( 1998). Benefits of plant diversity to ecosystems: Immediate, filter and founder effects. Journal of Ecology, 86, 902-910.
DOI URL |
| [19] |
Howard AL ( 2013). Handbook of structural equation modeling. Structural Equation Modeling-a Multidisciplinary Journal, 20, 354-360.
DOI URL |
| [20] | Huang XR ( 2018). Relationship between plant functional diversity and productivity of Pinus massoniana plantations in Guangxi. Biodiversity Science, 26, 690-700. |
| [ 黄小荣 ( 2018). 广西马尾松林植物功能多样性与生产力的关系. 生物多样性, 26, 690-700.] | |
| [21] |
Laliberté E, Legendre P ( 2010). A distance-based framework for measuring functional diversity from multiple traits. Ecology, 91, 299-305.
DOI URL |
| [22] | Lin DM, Lai JS, Muller-Landau HC, Mi XC, Ma KP ( 2012). Topographic variation in aboveground biomass in a subtropical evergreen broad-leaved forest in China. PLOS ONE, DOI: 10.1371/journal.pone.0048244. |
| [23] |
Lohbeck M, Poorter L, Martinez-Ramos M, Bongers F ( 2015). Biomass is the main driver of changes in ecosystem process rates during tropical forest succession. Ecology, 96, 1242-1252.
DOI URL |
| [24] | Lü TT, Wang P, Yan H, Zhang W, Liao GX, Jiang HB, Zou CL, Sheng LX ( 2014). Relationship between functional diversity and productivity in meadow and marsh plant communities. Chinese Journal of Plant Ecology , 38, 405-416. |
| [ 吕亭亭, 王平, 燕红, 张稳, 廖桂项, 姜海波, 邹畅林, 盛连喜 ( 2014). 草甸和沼泽植物群落功能多样性与生产力的关系. 植物生态学报, 38, 405-416.] | |
| [25] |
McGill BJ, Enquist BJ, Weiher E, Westoby M ( 2006). Rebuilding community ecology from functional traits. Trends in Ecology and Evolution, 21, 178-185.
DOI URL |
| [26] |
Mensah S, Veldtman R, Assogbadjo AE, Glèlè KR, Seifert T ( 2016). Tree species diversity promotes aboveground carbon storage through functional diversity and functional dominance. Ecology and Evolution, 6, 7546-7557.
DOI URL |
| [27] | Micheli F, Halpern BS ( 2010). Low functional redundancy in coastal marine assemblages. Ecology Letters, 8, 391-400. |
| [28] |
Mokany K, Ash J, Roxburgh S ( 2008). Functional identity is more important than diversity in influencing ecosystem processes in a temperate native grassland. Journal of Ecology, 96, 884-893.
DOI URL |
| [29] |
Mouchet MA, Villeger S, Mason NWH, Mouillot D ( 2010). Functional diversity measures: An overview of their redundancy and their ability to discriminate community assembly rules. Functional Ecology, 24, 867-876.
DOI URL |
| [30] | Oksanen J, Kindt R, Legendre P, O’Hara B, Simpson GL, Slymos P, Stevens MHH, Wagner H (2009). The vegan Package. . Cited: 2019-02-04. |
| [31] |
Ouyang S, Xiang W, Wang X, Zeng Y, Lei P, Deng X, Peng C ( 2016). Significant effects of biodiversity on forest biomass during the succession of subtropical forest in south China. Forest Ecology and Management, 372, 291-302.
DOI URL |
| [32] |
Petchey OL, Hector A, Gaston KJ ( 2004). How do different measures of functional diversity perform? Ecology, 85, 847-857.
DOI URL |
| [33] |
Ratcliffe S, Liebergesell M, Ruiz-Benito P, Madrigal González J, Muñoz Castañeda JM, Kändler G, Lehtonen A, Dahlgren J, Kattge J, Peñuelas J, Zavala MA, Wirth C ( 2016). Modes of functional biodiversity control on tree productivity across the European continent. Global Ecology and Biogeography, 25, 251-262.
DOI URL |
| [34] | Rosseel Y ( 2012). lavaan: An R package for structural equation modeling. Journal of Statistical Software, 48, 1-36. |
| [35] |
Ruiz-Benito P, Gomez-Aparicio L, Paquette A, Messier C, Kattge J, Zavala MA ( 2014). Diversity increases carbon storage and tree productivity in Spanish forests. Global Ecology and Biogeography, 23, 311-322.
DOI URL |
| [36] |
Schellberg J, Pontes LDS ( 2012). Plant functional traits and nutrient gradients on grassland. Grass and Forage Science, 67, 305-319.
DOI URL |
| [37] | Sun RY, Li QF, Niu CJ, Lou AR (2002). Basic Ecology. Higher Education Press, Beijing. |
| [ 孙儒泳, 李庆芬, 牛翠娟, 娄安如 (2002). 基础生态学. 高等教育出版社, 北京.] | |
| [38] |
Tilman D ( 1997). Distinguishing between the effects of species diversity and species composition. Oikos, 80, 185.
DOI URL |
| [39] |
Tobner CM, Paquette A, Gravel D, Reich PB, Williams LJ, Messier C ( 2016). Functional identity is the main driver of diversity effects in young tree communities. Ecology Letters, 19, 638-647.
DOI URL |
| [40] |
Van MT, Peña-Claros M, Ascarrunz N, Arets EJMM, Licona JC, Toledo M, Poorter L ( 2017). Abiotic and biotic drivers of biomass change in a neotropical forest. Journal of Ecology, 105, 1223-1234.
DOI URL |
| [41] | Wu Z, Raven P (1994-2009). Flora of China. Science Press and Missouri Botanical Garden Press, Beijing and St Louis. |
| [42] |
Zhang Y, Chen HYH ( 2015). Individual size inequality links forest diversity and above-ground biomass. Journal of Ecology, 103, 1245-1252.
DOI URL |
| [43] |
Zhang Y, Chen HYH, Reich PB ( 2012). Forest productivity increases with evenness, species richness and trait variation: A global meta-analysis. Journal of Ecology, 100, 742-749.
DOI URL |
| [1] | 张安宁, 肖亚宁, 赵霞, 张淼, 崔瀚文, 陈书燕, 安黎哲. 青藏高原灌木化与氮添加对土壤线虫及功能性状的交互作用[J]. 植物生态学报, 2026, 50(预发表): 0-. |
| [2] | 吴闫宁, 郝珉辉, 何怀江, 张春雨, 赵秀海. 长白山森林功能多样性与地上碳汇功能的关系及其随演替的变化[J]. 植物生态学报, 2025, 49(2): 232-243. |
| [3] | 江康威, 张青青, 王亚菲, 李宏, 丁雨, 杨永强, 吐尔逊娜依•热依木. 放牧干扰下天山北坡中段植物功能群特征及其与土壤环境因子的关系[J]. 植物生态学报, 2024, 48(6): 701-718. |
| [4] | 盘远方, 潘良浩, 邱思婷, 邱广龙, 苏治南, 史小芳, 范航清. 中国沿海红树林树高变异与环境适应机制[J]. 植物生态学报, 2024, 48(4): 483-495. |
| [5] | 袁鹤洋, 郝珉辉, 何怀江, 张春雨, 赵秀海. 长白山物种丰富度与物种组成对森林生产力的影响及其随演替的变化[J]. 植物生态学报, 2024, 48(12): 1602-1611. |
| [6] | 陈昭铨, 王明慧, 胡子涵, 郎学东, 何云琼, 刘万德. 云南普洱季风常绿阔叶林幼苗的群落构建机制[J]. 植物生态学报, 2024, 48(1): 68-79. |
| [7] | 吕自立, 刘彬, 常凤, 马紫荆, 曹秋梅. 巴音布鲁克高寒草甸植物功能多样性与生态系统多功能性关系沿海拔梯度的变化[J]. 植物生态学报, 2023, 47(6): 822-832. |
| [8] | 杨元合, 张典业, 魏斌, 刘洋, 冯雪徽, 毛超, 徐玮婕, 贺美, 王璐, 郑志虎, 王媛媛, 陈蕾伊, 彭云峰. 草地群落多样性和生态系统碳氮循环对氮输入的非线性响应及其机制[J]. 植物生态学报, 2023, 47(1): 1-24. |
| [9] | 李万年, 罗益敏, 黄则月, 杨梅. 望天树人工幼林混交对土壤微生物功能多样性与碳源利用的影响[J]. 植物生态学报, 2022, 46(9): 1109-1124. |
| [10] | 董六文, 任正炜, 张蕊, 谢晨笛, 周小龙. 功能多样性比物种多样性更好解释氮添加对高寒草地生物量的影响[J]. 植物生态学报, 2022, 46(8): 871-881. |
| [11] | 张义, 程杰, 苏纪帅, 程积民. 长期封育演替下典型草原植物群落生产力与多样性关系[J]. 植物生态学报, 2022, 46(2): 176-187. |
| [12] | 赵晏平, 王忠武, 温都日根, 赵玉金, 白永飞. 基于Sentinel-2数据的草地植物功能多样性遥感反演及其与生产力的关系[J]. 植物生态学报, 2022, 46(10): 1234-1250. |
| [13] | 丁威,王玉冰,向官海,迟永刚,鲁顺保,郑淑霞. 小叶锦鸡儿灌丛化对典型草原群落结构与生态系统功能的影响[J]. 植物生态学报, 2020, 44(1): 33-43. |
| [14] | 王玉冰,孙毅寒,丁威,张恩涛,李文怀,迟永刚,郑淑霞. 长期氮添加对典型草原植物多样性与初级生产力的影响及途径[J]. 植物生态学报, 2020, 44(1): 22-32. |
| [15] | 秦浩, 张殷波, 董刚, 张峰. 山西关帝山森林群落物种、谱系和功能多样性海拔格局[J]. 植物生态学报, 2019, 43(9): 762-773. |
| 阅读次数 | ||||||
|
全文 |
|
|||||
|
摘要 |
|
|||||
Copyright © 2026 版权所有 《植物生态学报》编辑部
地址: 北京香山南辛村20号, 邮编: 100093
Tel.: 010-62836134, 62836138; Fax: 010-82599431; E-mail: apes@ibcas.ac.cn, cjpe@ibcas.ac.cn
备案号: 京ICP备16067583号-19
![]()