
植物生态学报 ›› 2021, Vol. 45 ›› Issue (2): 119-130.DOI: 10.17521/cjpe.2019.0301 cstr: 32100.14.cjpe.2019.0301
所属专题: 全球变化与生态系统; 生态系统碳水能量通量
黄松宇1,2, 贾昕1,2,3,*( ), 郑甲佳1,2, 杨睿智1,2, 牟钰1,2, 袁和第1
收稿日期:2019-11-06
接受日期:2020-05-12
出版日期:2021-02-20
发布日期:2020-06-08
作者简介:*(xinjia@bjfu.edu.cn)基金资助:
HUANG Song-Yu1,2, JIA Xin1,2,3,*(), ZHENG Jia-Jia1,2, YANG Rui-Zhi1,2, MU Yu1,2, YUAN He-Di1
Received:2019-11-06
Accepted:2020-05-12
Online:2021-02-20
Published:2020-06-08
Supported by:摘要:
波文比(β)是陆面过程中的重要参数, 影响着地表和大气间的能量交换, 明确β的空间变异规律和影响因素有助于对地表能量平衡和气候间反馈关系的预测。该研究收集了在中国不同生态系统类型开展的用涡度相关法(EC)测量地表能量平衡的公开发表文献, 构建了β和气象环境因子数据库, 分析了β在生态系统之间的差异、空间变异特征及影响因素。主要结果: (1)所有生态系统β平均值为0.95 ± 0.64, 变异系数67%, 偏度1.58, 峰度3.07, 整体服从对数正态分布, β平均值最高为灌木生态系统(1.26), 最低为湿地生态系统(0.49)。(2) β在生态系统类型间差异显著: 森林和湿地生态系统β无显著差异, 灌木生态系统β >草地生态系统 β >森林和湿地生态系统 β, 农田生态系统β介于草地生态系统与森林和湿地生态系统之间。(3) β随着纬度的增加而增加, 不随经度和海拔变化。纬度每增加1°,β增加0.038。(4) β随着年降水量(MAP)、年平均气温(MAT)、净辐射(Rn)、当年降水量(PPT)、当年平均气温(Ta)和叶面积指数(LAI)的增加而降低。(5)不同生态系统中β对生物和非生物因素的响应存在显著差异: 草地、森林和灌木生态系统的β对生物和非生物因素变化较为敏感, 而农田和湿地生态系统的β与所有生物和非生物因素均无显著相关关系。(6) MAP和Rn是β变化的直接影响因素, LAI通过影响Rn间接影响β。结果表明了植被类型与气候因素之间具有交互作用, 能量分配最主要的影响因素是降水, 叶面积对能量分配的调节作用并不显著。
黄松宇, 贾昕, 郑甲佳, 杨睿智, 牟钰, 袁和第. 中国典型陆地生态系统波文比特征及影响因素. 植物生态学报, 2021, 45(2): 119-130. DOI: 10.17521/cjpe.2019.0301
HUANG Song-Yu, JIA Xin, ZHENG Jia-Jia, YANG Rui-Zhi, MU Yu, YUAN He-Di. Characteristics and influencing factors of Bowen ratio variation in typical terrestrial ecosystems in China. Chinese Journal of Plant Ecology, 2021, 45(2): 119-130. DOI: 10.17521/cjpe.2019.0301
| 变量名称 Variable name | 缩写 Abbreviation | 单位 Unit | 变量名称 Variable name | 缩写 Abbreviation | 单位 Unit |
|---|---|---|---|---|---|
| 纬度 Latitude | Lat | ° | 当年降水量 Annual precipitation of the studied year | PPT | mm |
| 经度 Longitude | Lon | ° | 净辐射 Net radiation | Rn | MJ·m-2·a-1 |
| 海拔 Altitude | Alt | m | 土壤热通量 Soil heat flux | G | MJ·m-2·a-1 |
| 年平均气温 Mean annual air temperature | MAT | ℃ | 显热通量 Sensible heat flux | H | MJ·m-2·a-1 |
| 年降水量 Mean annual precipitation | MAP | mm | 潜热通量 Latent heat flux | LE | MJ·m-2·a-1 |
| 生态系统类型 Ecosystem type | - | - | 波文比 Bowen ratio | β | - |
| 叶面积指数 Leaf Area Index | LAI | m2·m-2 | 能量闭合度 Energy balance closure | EBC | - |
| 当年平均气温 Mean annual air temperature of the studied year | Ta | ℃ | 能量平衡比率 Energy balance ratio | EBR | - |
表1 中国典型陆地生态系统波文比数据库主要信息
Table 1 Main information of the Bowen ratio dataset in Chinese typical terrestrial ecosystems
| 变量名称 Variable name | 缩写 Abbreviation | 单位 Unit | 变量名称 Variable name | 缩写 Abbreviation | 单位 Unit |
|---|---|---|---|---|---|
| 纬度 Latitude | Lat | ° | 当年降水量 Annual precipitation of the studied year | PPT | mm |
| 经度 Longitude | Lon | ° | 净辐射 Net radiation | Rn | MJ·m-2·a-1 |
| 海拔 Altitude | Alt | m | 土壤热通量 Soil heat flux | G | MJ·m-2·a-1 |
| 年平均气温 Mean annual air temperature | MAT | ℃ | 显热通量 Sensible heat flux | H | MJ·m-2·a-1 |
| 年降水量 Mean annual precipitation | MAP | mm | 潜热通量 Latent heat flux | LE | MJ·m-2·a-1 |
| 生态系统类型 Ecosystem type | - | - | 波文比 Bowen ratio | β | - |
| 叶面积指数 Leaf Area Index | LAI | m2·m-2 | 能量闭合度 Energy balance closure | EBC | - |
| 当年平均气温 Mean annual air temperature of the studied year | Ta | ℃ | 能量平衡比率 Energy balance ratio | EBR | - |
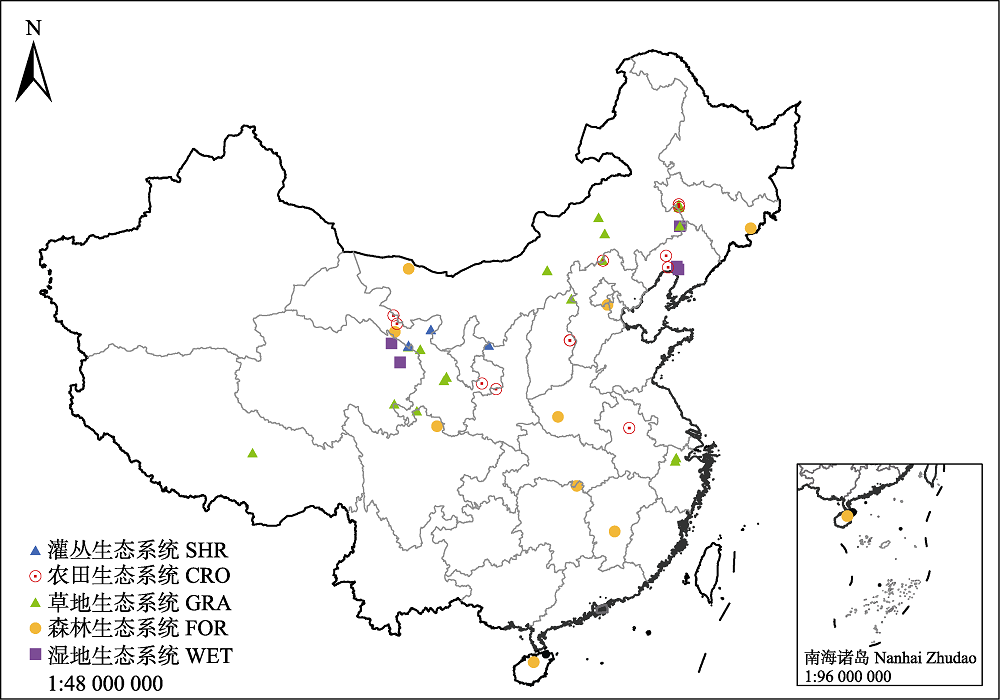
图1 中国典型陆地生态系统波文比数据来源站点分布图。
Fig. 1 Distribution of the data resources of Bowen ratio in typical terrestrial ecosystems in China. CRO, cropland ecosystems; FOR, forest ecosystems; GRA, grassland ecosystems; SHR, shrubland ecosystems; WET, wetland ecosystems.
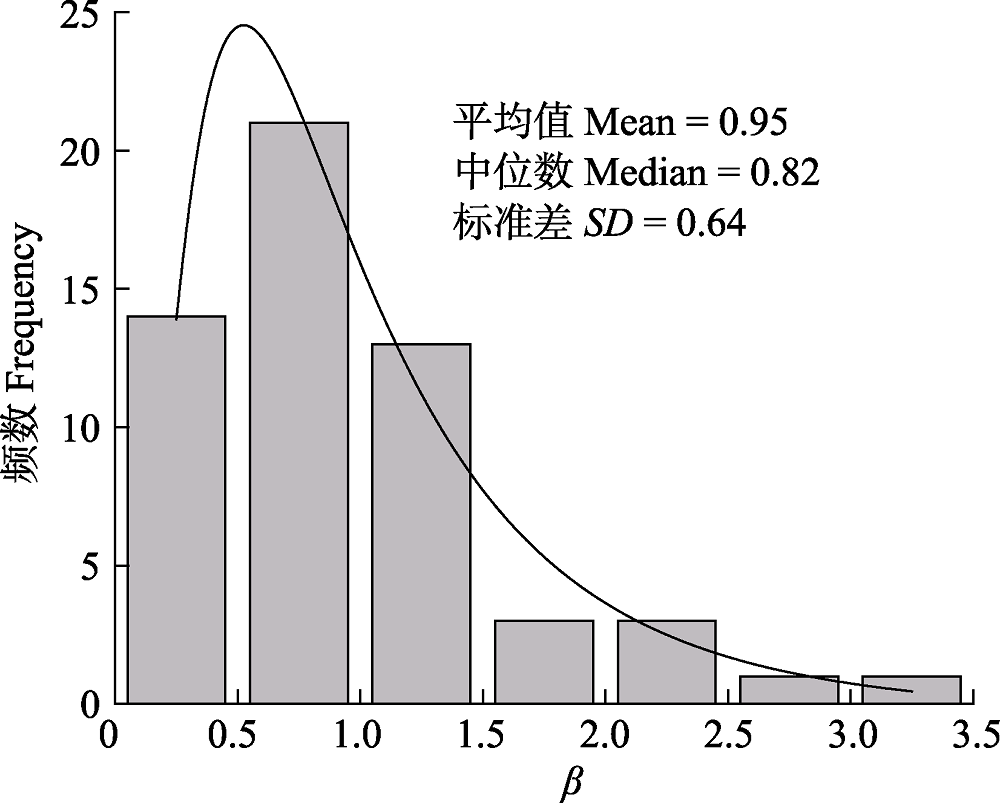
图2 中国典型陆地生态系统波文比(β)频数分布。
Fig. 2 Frequency distribution of Bowen ratio (β) in typical terrestrial ecosystems in China.
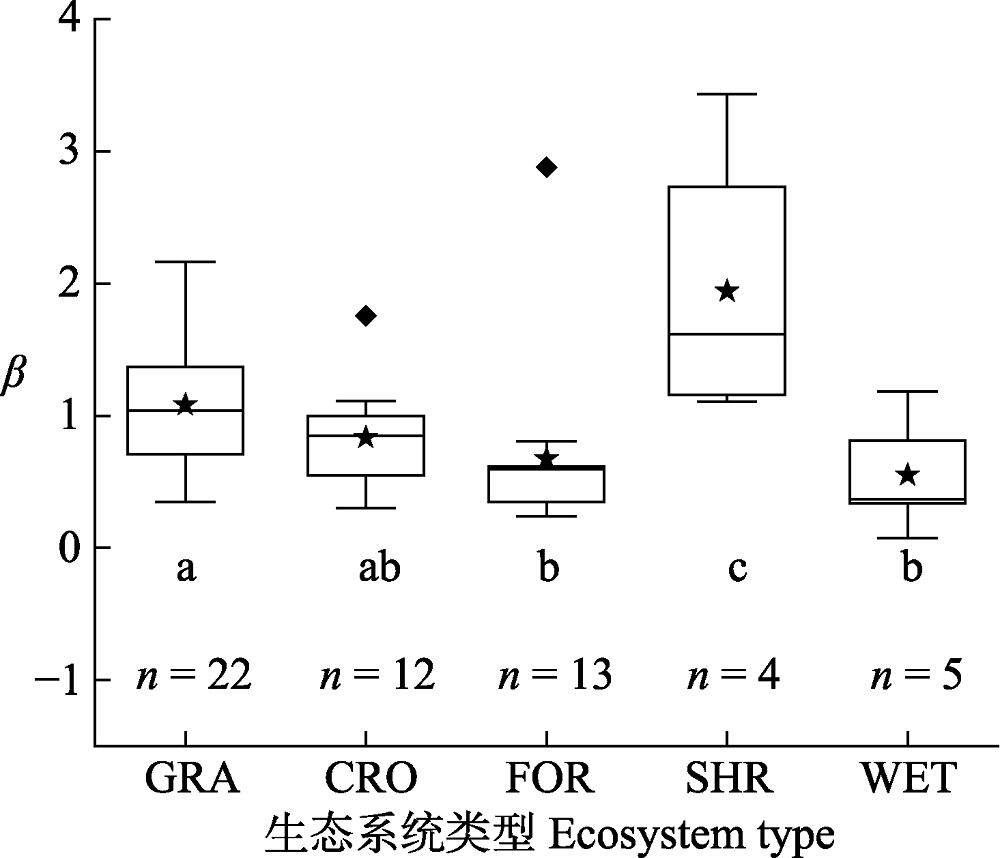
图3 不同生态系统类型波文比(β)分布箱线图。小写字母表示多重比较的结果, 相同的字母表示生态系统之间的β差异不显著(p > 0.5), 不同的字母表示生态系统之间的β差异显著(p < 0.5)。n为样本量。CRO, 农田生态系统; FOR, 森林生态系统; GRA, 草地生态系统; SHR, 灌丛生态系统; WET, 湿地生态系统。
Fig. 3 Boxing diagram of the Bowen ratio (β) of different ecosystem types. Lowercase letters indicate the results of multiple comparisons. The same letter indicates that the difference of β between ecosystems is not significant (p > 0.5), while different letters indicate significant differences in β between ecosystems (p < 0.5). n is the sample size. CRO, cropland ecosystems; FOR, forest ecosystems; GRA, grassland ecosystems; SHR, shrubland ecosystems; WET, wetland ecosystems.
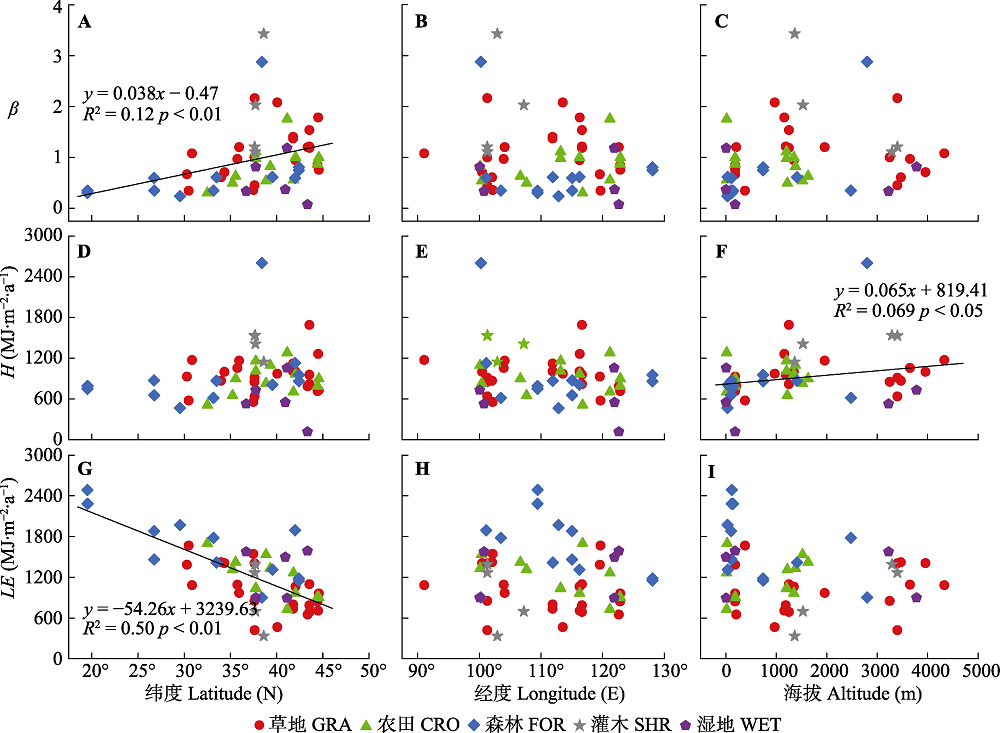
图4 中国陆地生态系统的波文比(β)、显热通量(H)、潜热通量(LE)与纬度、经度和海拔高度之间的关系。
Fig. 4 Relationships between the Bowen ratio (β), sensible heat flux (H), latent heat flux (LE) and latitude, longitude and altitude of terrestrial ecosystems in China. CRO, cropland ecosystems; FOR, forest ecosystems; GRA, grassland ecosystems; SHR, shrubland ecosystems; WET, wetland ecosystems.
| 影响因素 Influencing factor | 生态系统类型 Ecosystem type | 回归方程 Regression equation | 样本数 Sample size | R2 |
|---|---|---|---|---|
| 纬度 Lat | FOR | β= 0.016Lat - 0.02 | 12 | 0.57** |
| 经度 Lon | FOR | β= 0.014Lon -1.13 | 12 | 0.32* |
| 年降水量 MAP | GRA | β= -0.00076MAP + 1.46 | 22 | 0.22* |
| FOR | β= -0.00021MAP + 0.73 | 12 | 0.36* | |
| SHR | β= -0.0046MAP + 3.73 | 4 | 0.91* | |
| 当年降水量 PPT | GRA | β= -0.00082PPT + 1.43 | 15 | 0.41** |
| FOR | β= -0.00025PPT + 0.77 | 10 | 0.42* | |
| 年平均气温 MAT | FOR | β= -0.017MAT + 0.74 | 11 | 0.45* |
| 当年平均气温 Ta | FOR | β= -0.020Ta + 0.77 | 8 | 0.48* |
| 净辐射 Rn | GRA | β= -000063Rn + 2.54 | 20 | 0.34*** |
| SHR | β= -0.0021Rn + 7.09 | 4 | 0.97* | |
| 叶面积指数 LAI | GRA | β= -0.20LAI + 1.45 | 12 | 0.34* |
表2 波文比(β)与地理、气候及生物因素在不同生态系统中的线性回归结果
Table 2 Linear regressions between Bowen ratio (β) and geographical, climatic and biological factors in different ecosystems
| 影响因素 Influencing factor | 生态系统类型 Ecosystem type | 回归方程 Regression equation | 样本数 Sample size | R2 |
|---|---|---|---|---|
| 纬度 Lat | FOR | β= 0.016Lat - 0.02 | 12 | 0.57** |
| 经度 Lon | FOR | β= 0.014Lon -1.13 | 12 | 0.32* |
| 年降水量 MAP | GRA | β= -0.00076MAP + 1.46 | 22 | 0.22* |
| FOR | β= -0.00021MAP + 0.73 | 12 | 0.36* | |
| SHR | β= -0.0046MAP + 3.73 | 4 | 0.91* | |
| 当年降水量 PPT | GRA | β= -0.00082PPT + 1.43 | 15 | 0.41** |
| FOR | β= -0.00025PPT + 0.77 | 10 | 0.42* | |
| 年平均气温 MAT | FOR | β= -0.017MAT + 0.74 | 11 | 0.45* |
| 当年平均气温 Ta | FOR | β= -0.020Ta + 0.77 | 8 | 0.48* |
| 净辐射 Rn | GRA | β= -000063Rn + 2.54 | 20 | 0.34*** |
| SHR | β= -0.0021Rn + 7.09 | 4 | 0.97* | |
| 叶面积指数 LAI | GRA | β= -0.20LAI + 1.45 | 12 | 0.34* |
| 影响因素 Influencing factor | 生态系统类型 Ecosystem type | 回归方程 Regression equation | 样本数 Sample size | R2 |
|---|---|---|---|---|
| 纬度 Lat | SHR | H =-373.96Lat + 15579.69 | 4 | 0.90* |
| 当年降水量 PPT | FOR | H =-0.20PPT + 1015.80 | 10 | 0.41* |
| 净辐射 Rn | SHR | H= 0.36Rn + 521.99 | 4 | 0.99** |
表3 显热通量(H)与地理、气候及生物因素在不同生态系统中的线性回归结果
Table 3 Linear regressions between sensible heat flux (H) and geographical, climatic and biological factors in different ecosystems
| 影响因素 Influencing factor | 生态系统类型 Ecosystem type | 回归方程 Regression equation | 样本数 Sample size | R2 |
|---|---|---|---|---|
| 纬度 Lat | SHR | H =-373.96Lat + 15579.69 | 4 | 0.90* |
| 当年降水量 PPT | FOR | H =-0.20PPT + 1015.80 | 10 | 0.41* |
| 净辐射 Rn | SHR | H= 0.36Rn + 521.99 | 4 | 0.99** |
| 影响因素 Influencing factor | 生态系统类型 Ecosystem type | 回归方程 Regression equation | 样本数 Sample size | R2 |
|---|---|---|---|---|
| 纬度 Lat | GRA | LE= -45.40Lat +2767.46 | 22 | 0.36** |
| CRO | LE= -57.21Lat + 3424.40 | 12 | 0.48** | |
| FOR | LE= -40.80Lat + 3032.86 | 12 | 0.62** | |
| 经度 Lon | CRO | LE= -21.36Lon -3604.25 | 12 | 0.30* |
| FOR | LE =-36.92Lon +5944.80 | 12 | 0.39* | |
| 海拔 Alt | SHR | LE= 0.43Alt -116.08 | 4 | 0.89* |
| 年降水量 MAP | GRA | LE =0.64MAP +683.66 | 22 | 0.34** |
| CRO | LE =1.18MAP +500.76 | 10 | 0.52* | |
| FOR | LE= 0.50MAP + 1203.54 | 12 | 0.36* | |
| SHR | LE= 2.19MAP - 78.90 | 4 | 0.97** | |
| 当年降水量 PPT | GRA | LE= 0.65PPT + 725.23 | 15 | 0.44** |
| 年平均气温 MAT | FOR | LE =45.30MAT +1122.30 | 11 | 0.61** |
| SHR | LE= -80.99MAT + 1200.72 | 4 | 0.90* | |
| 当年平均气温 Ta | FOR | LE= 54.34Ta + 1024.19 | 8 | 0.62* |
| 净辐射 Rn | GRA | LE= 0.47Rn - 53.39 | 20 | 0.51*** |
| FOR | LE= 0.58Rn + 39.06 | 12 | 0.61** | |
| WET | LE= 0.69Rn - 441.67 | 5 | 0.77* |
表4 潜热通量(LE)与地理、气候及生物因素在不同生态系统中的线性回归结果
Table 4 Linear regressions between latent heat flux (LE) and geographical, climatic and biological factors in different ecosystems
| 影响因素 Influencing factor | 生态系统类型 Ecosystem type | 回归方程 Regression equation | 样本数 Sample size | R2 |
|---|---|---|---|---|
| 纬度 Lat | GRA | LE= -45.40Lat +2767.46 | 22 | 0.36** |
| CRO | LE= -57.21Lat + 3424.40 | 12 | 0.48** | |
| FOR | LE= -40.80Lat + 3032.86 | 12 | 0.62** | |
| 经度 Lon | CRO | LE= -21.36Lon -3604.25 | 12 | 0.30* |
| FOR | LE =-36.92Lon +5944.80 | 12 | 0.39* | |
| 海拔 Alt | SHR | LE= 0.43Alt -116.08 | 4 | 0.89* |
| 年降水量 MAP | GRA | LE =0.64MAP +683.66 | 22 | 0.34** |
| CRO | LE =1.18MAP +500.76 | 10 | 0.52* | |
| FOR | LE= 0.50MAP + 1203.54 | 12 | 0.36* | |
| SHR | LE= 2.19MAP - 78.90 | 4 | 0.97** | |
| 当年降水量 PPT | GRA | LE= 0.65PPT + 725.23 | 15 | 0.44** |
| 年平均气温 MAT | FOR | LE =45.30MAT +1122.30 | 11 | 0.61** |
| SHR | LE= -80.99MAT + 1200.72 | 4 | 0.90* | |
| 当年平均气温 Ta | FOR | LE= 54.34Ta + 1024.19 | 8 | 0.62* |
| 净辐射 Rn | GRA | LE= 0.47Rn - 53.39 | 20 | 0.51*** |
| FOR | LE= 0.58Rn + 39.06 | 12 | 0.61** | |
| WET | LE= 0.69Rn - 441.67 | 5 | 0.77* |
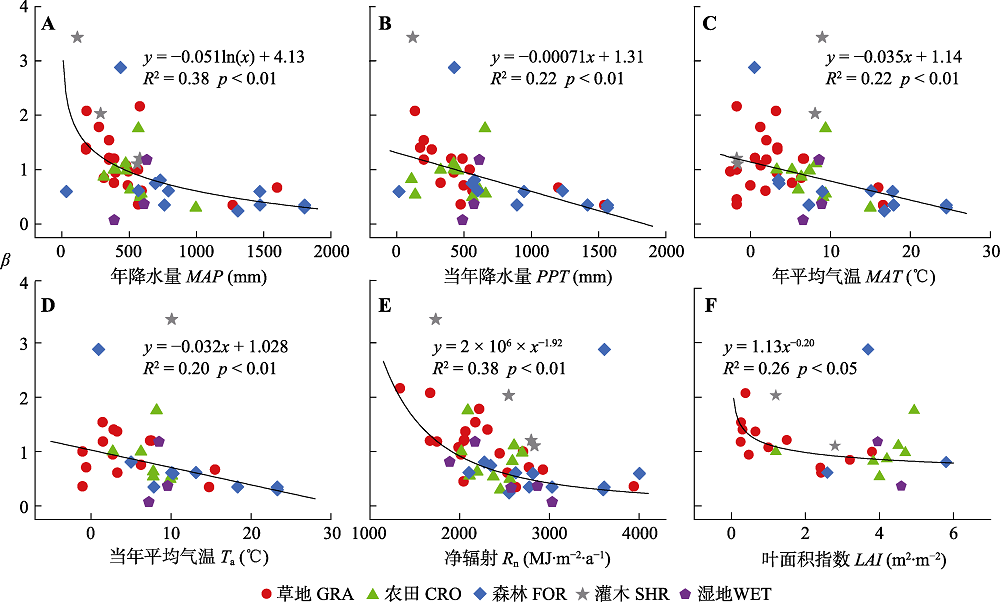
图5 中国陆地生态系统的波文比(β)与年降水量(MAP)、当年降水量(PPT)、年平均气温(MAT)、当年平均气温(Ta)、净辐射(Rn)和叶面积指数(LAI)的关系。
Fig. 5 Relationships between Bowen ratio (β) and mean annual precipitation (MAP), annual precipitation of the studied year (PPT), mean annual air temperature (MAT), mean annual air temperature of the studied year (Ta), net radiation (Rn) and Leaf Area Index (LAI) of China's terrestrial ecosystems. CRO, cropland ecosystems; FOR, forest ecosystems; GRA, grassland ecosystems; SHR, shrubland ecosystems; WET, wetland ecosystems.
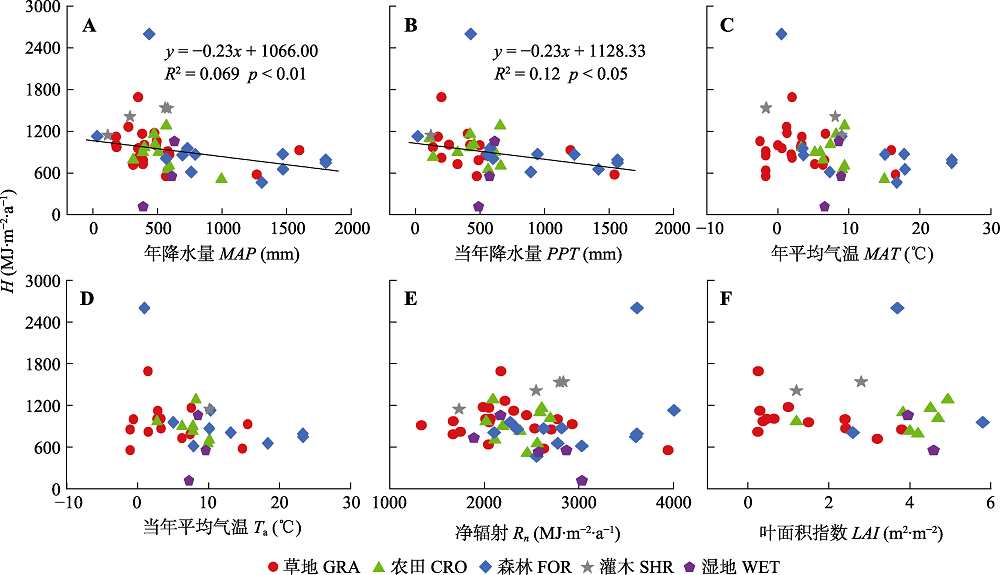
图6 中国陆地生态系统的显热通量(H)与年降水量(MAP)、当年降水量(PPT)、多年平均气温(MAT)、当年平均气温(Ta)、净辐射(Rn)和叶面积指数(LAI)之间的关系。
Fig. 6 Relationships between sensible heat flux (β) and mean annual precipitation (MAP), annual precipitation of the studied year (PPT), mean annual air temperature (MAT), mean annual air temperature of the studied year (Ta), net radiation (Rn) and Leaf Area Index (LAI) of China's terrestrial ecosystems. CRO, cropland ecosystems; FOR, forest ecosystems; GRA, grassland ecosystems; SHR, shrubland ecosystems; WET, wetland ecosystems.
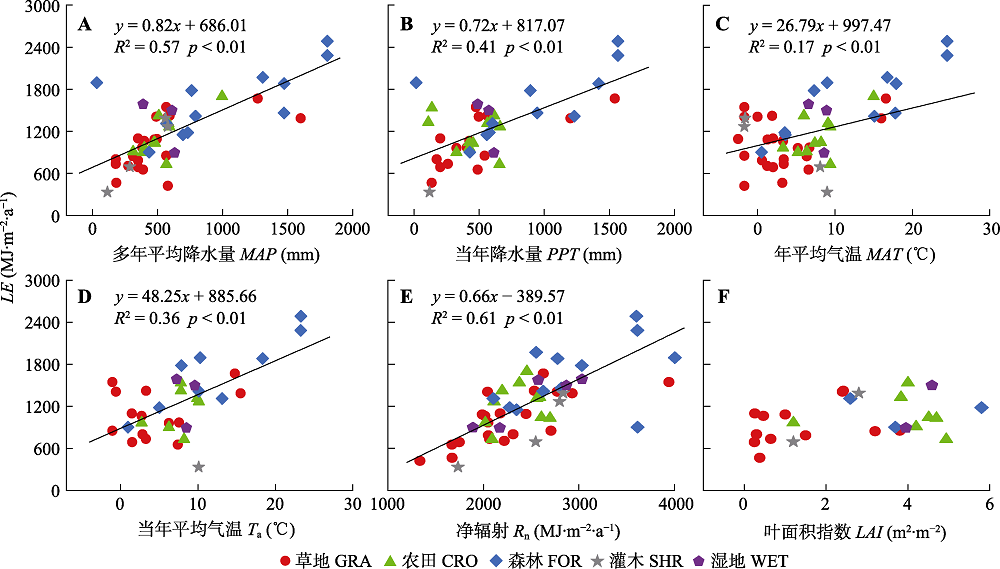
图7 中国陆地生态系统的潜热通量(LE)与年降水量(MAP)、当年降水量(PPT)、多年平均气温(MAT)、当年平均气温(Ta)、净辐射(Rn)和叶面积指数(LAI)之间的关系。
Fig. 7 The relationships between latent heat flux (LE) and mean annual precipitation (MAP), annual precipitation of the studied year (PPT), mean annual air temperature (MAT), mean annual air temperature of the studied year (Ta), net radiation (Rn) and Leaf Area Index (LAI) of China's terrestrial ecosystems. CRO, cropland ecosystems; FOR, forest ecosystems; GRA, grassland ecosystems; SHR, shrubland ecosystems; WET, wetland ecosystems.
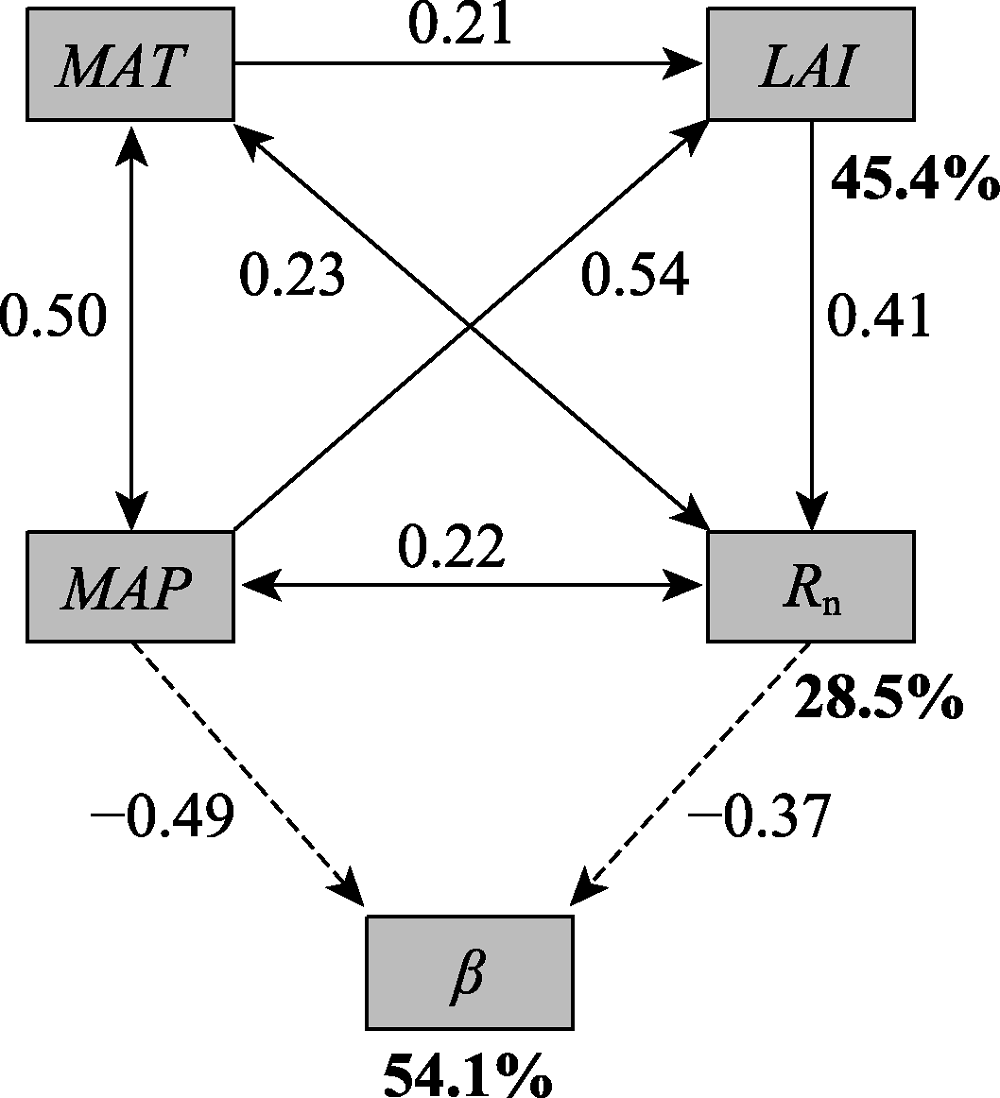
图8 年降水量(MAP)、年平均气温(MAT)、净辐射(Rn)和叶面积指数(LAI)对波文比(β)影响的路径分析图。结构方程模型(SEM)的统计结果为χ2= 1.75, df = 2, p = 0.093, RMSEA = 0.038。实线和虚线箭头分别代表正相关和负相关。每个箭头上的数字为标准化路径系数。粗体数字分别为LAI、Rn和β统计结果的解释度R2。
Fig. 8 Path diagrams for the effects of mean annual precipitation (MAP), mean annual air temperature (MAT), net radiation (Rn) and Leaf Area Index (LAI). The statistical results of the structural equation model (SEM) are χ2 = 1.75, df = 2, p = 0.093, RMSEA = 0.038. Solid and dashed arrows represent positive and negative correlations, respectively. The figure for each arrow is the standardized path coefficient. The bold numbers are the explained variance (R2) of LAI, Rn and β, respectively.
| [1] |
Boisier JP, de Noblet-Ducoudré N, Pitman AJ, Cruz FT, Delire C, van den Hurk BJJM, van der Molen MK, Müller C, Voldoire A (2012). Attributing the impacts of land-cover changes in temperate regions on surface temperature and heat fluxes to specific causes: results from the first LUCID set of simulations. Journal of Gerphysical Research, 117,D12116. DOI: 10.1029/2011JD017106.
DOI |
| [2] | Bonan GB (2008). Forests and climate change: forcings, feedbacks, and the climate benefits of forests. Science, 320,1444-1449. |
| [3] |
Bowen IS (1926). The ratio of heat losses by conduction and by evaporation from any water surface. Physical Review, 27,779-787.
DOI URL |
| [4] |
Burakowski E, Tawfik A, Ouimette A, Lepine L, Novick D, Ollinger S, Zarzycki C, Bonan G (2017). The role of surface roughness, albedo, and Bowen ratio on ecosystem energy balance in the Eastern United States. Agricultural and Forest Meteorology, 249,367-376.
DOI URL |
| [5] |
Chen L, Dirmeyer PA (2016). Adapting observationally based metrics of biogeophysical feedbacks from land cover/land use change to climate modeling. Environmental Research Letters, 11,034002. DOI: 10.1088/1748-9326/11/3/034002.
DOI URL |
| [6] |
Chen SP, Chen JQ, Lin GH, Zhang WL, Miao HX, Wei L, Huang JH, Han XG (2009). Energy balance and partition in Inner Mongolia steppe ecosystems with different land use types. Agricultural and Forest Meteorology, 149,1800-1809.
DOI URL |
| [7] | Chen YF, Jiang H, Zhou GM, Sun C, Chen J (2013). Energy flux and energy balance closure of intensively managed Lei bamboo forest ecosystem. Chinese Journal of Applied Ecology, 24,1063-1069. |
| [ 陈云飞, 江洪, 周国模, 孙成, 陈健 (2013). 高效经营雷竹林生态系统能量通量过程及闭合度. 应用生态学报, 24,1063-1069.] | |
| [8] | Ge J, Yu Y, Li ZC, Xie J, Liu C, Zan BL (2016). Impacts of freeze/thaw processes on land surface energy fluxes in the permafrost region of Qinghai-Xizang Plateau. Plateau Meteorology, 35,608-620. |
| [ 葛骏, 余晔, 李振朝, 解晋, 刘川, 昝蓓蕾 (2016). 青藏高原多年冻土区土壤冻融过程对地表能量通量的影响研究. 高原气象, 35,608-620.] | |
| [9] | Grünwald T, Bernhofer C (2007). A decade of carbon, water and energy flux measurements of an old spruce forest at the Anchor Station Tharandt. Tellus, 59(B),387-396. |
| [10] |
Han B, Lü SH, Li RQ, Wang X, Zhao L, Zhao CL, Wang DY, Meng XH (2017). Global land surface climate analysis based on the calculation of a modified Bowen ratio. Advances in Atmospheric Sciences, 34,663-678.
DOI URL |
| [11] | He XM, Qin L, Lü GH, Yang JJ, Gong YM, Yang XD (2017). Surface energy balance of an arid desert wetland in Ebinur Lake basin, Xinjiang, China. Chinese Journal of Ecology, 36,309-317. |
| [ 何学敏, 秦璐, 吕光辉, 杨建军, 公延明, 杨晓东 (2017). 新疆艾比湖流域干旱荒漠区湿地地表能量收支特征. 生态学杂志, 36,309-317.] | |
| [12] |
Jia X, Zha TS, Wu B, Zhang YQ, Qin SG, Chen GP, Feng W, Kellomäki S, Peltola H (2016). Energy partitioning over a semi-arid shrubland in northern China. Hydrological Processes, 30,972-985.
DOI URL |
| [13] |
Jo YH, Yan XH, Pan JY, Liu WT, He MX (2004). Sensible and latent heat flux in the tropical Pacific from satellite multi-sensor data. Remote Sensing of Environment, 90,166-177.
DOI URL |
| [14] |
Juang JY, Katul G, Siqueira M, Stoy P, Novick K (2007). Separating the effects of albedo from eco-physiological changes on surface temperature along a successional chronosequence in the southeastern United States. Geophysical Research Letters, 34,L21408. DOI: 10.1029/2007GL031296.
DOI URL |
| [15] |
Kueppers LM, Snyder MA, Sloan LC (2007). Irrigation cooling effect: regional climate forcing by land-use change. Geophysical Research Letters, 34,L03703. DOI: 10.1029/2006GL028679.
DOI |
| [16] |
Launiainen S (2010). Seasonal and inter-annual variability of energy exchange above a boreal Scots pine forest. Biogeosciences, 7,3921-3940.
DOI URL |
| [17] |
Launiainen S, Katul GG, Kolari P, Lindroth A, Lohila A, Aurela M, Varlagind A, Grelle A, Vesala T (2016). Do the energy fluxes and surface conductance of boreal coniferous forests in Europe scale with leaf area? Global Change Biology, 22,4096-4113.
DOI PMID |
| [18] |
Li Y, Zhao M, Motesharrei S, Mu Q, Kalnay E, Li S (2015). Local cooling and warming effects of forests based on satellite observations. Nature Communications, 6,6603. DOI: 10.1038/ncomms7603.
DOI URL |
| [19] | Liu S, Li SG, Yu GR, Sun XM, Zhang LM, Hu ZM, Li YN, Zhang XZ (2009). Surface energy exchanges above two grassland ecosystems on the Qinghai-Tibetan Plateau. Biogeosciences Discussions, 6,9161-9192. |
| [20] |
Matsumoto K, Ohta T, Nakai T, Kuwada T, Daikoku K, Iida S, Yabuki H, Kononov AV, Molen MK, Kodama Y, Maximov TC, Dolman AJ, Hattori S (2008). Energy consumption and evapotranspiration at several boreal and temperate forests in the Far East. Agricultural and Forest Meteorology, 148,1978-1989.
DOI URL |
| [21] |
Morwal SB, Narkhedkar SG, Padmakumari B, Maheskumar RS, Deshpande CG, Kulkarni JP (2017). Intra-seasonal and inter-annual variability of Bowen ratio over rain- shadow region of north peninsular India. Theoretical and Applied Climatology, 128,835-844.
DOI URL |
| [22] |
Ryu Y, Baldocchi DD, Ma S, Hehn T (2008). Interannual variability of evapotranspiration and energy exchange over an annual grassland in California. Journal of Geophysical Research, 113,D09104. DOI: 10.1029/2007JD009263.
DOI |
| [23] | Sun C (2014). The Study on the CO2 Flux and Energy Balance Variations in a Phyllostachys edulis Forest Ecosystem. PhD dissertation, Zhejiang A&F University, Lin'an, Zhejiang. |
| [ 孙成 (2014). 毛竹林生态系统CO2通量和能量平衡的观测研究. 博士学位论文, 浙江农林大学, 浙江临安.] | |
| [24] |
Tang YK, Wen XF, Sun XM, Wang HM (2014). Interannual variation of the Bowen ratio in a subtropical coniferous plantation in southeast China, 2003-2012. PLOS ONE, 9, e88267. DOI: 10.1371/journal.pone.0088267.
DOI |
| [25] | Wang P, Ma QS, Wang JQ, Huang JY, Li W, Zhang CC (2017). Comparison of evapotranspiration and Bowen ratio method by eddy correlation and Bowen ratio system in a temperate grassland. Acta Agrestia Sinica, 25,453-459. |
| [ 王佩, 马琪顺, 王家琪, 黄洁钰, 李炜, 张赐成 (2017). 温带草地蒸散发及波文比观测与比较: 涡动相关及波文比系统. 草地学报, 25,453-459.] | |
| [26] | Xia L, Zhang Q (2014). Plateau surface energy balance components and interannual variability in response to climate fluctuations. Acta Physica Sinica, 63(11),119-201. |
| [ 夏露, 张强 (2014). 黄土高原地表能量平衡分量年际变化及其对气候波动的响应. 物理学报, 63(11),119-201.] | |
| [27] | Yuan WW, Tong XJ, Zhang JS, Meng P, Li J, Zheng N (2015). Characteristics of energy balance of a mixed plantation in the Xiaolangdi area in the growing season. Acta Ecologica Sinica, 35,4492-4499. |
| [ 原文文, 同小娟, 张劲松, 孟平, 李俊, 郑宁 (2015). 黄河小浪底人工混交林生长季能量平衡特征. 生态学报, 35,4492-4499.] | |
| [28] | Yue P, Zhang Q, Yang JH, Li HY, Sun XY, Yang QG, Zhang JZ (2011). Surface heat flux and energy budget for semi- arid grassland on the Loess Plateau. Acta Ecologica Sinica, 31,6866-6876. |
| [ 岳平, 张强, 杨金虎, 李宏宇, 孙旭映, 杨启国, 张建忠 (2011). 黄土高原半干旱草地地表能量通量及闭合率. 生态学报, 31,6866-6876.] | |
| [29] |
Yue P, Zhang Q, Yang Y, Zhang L, Zhang HL, Hao XC, Sun XY (2018). Seasonal and inter-annual variability of the Bowen smith ratio over a semi-arid grassland in the Chinese Loess Plateau. Agricultural and Forest Meteorology, 252,99-108.
DOI URL |
| [30] | Zhang Q, Zhang L, Huang J, Zhang LY, Wang WY, Sha S (2014). Spatial distribution of surface energy fluxes over the Loess Plateau in China and its relationship with climate and the environment. Science China: Earth Sciences (Chinese Version), 44,2062-2076. |
| [ 张强, 张良, 黄菁, 张立阳, 王文玉, 沙莎 (2014). 我国黄土高原地区陆面能量的空间分布规律及其与气候环境的关系. 中国科学: 地球科学(中文版), 44,2062-2076.] | |
| [31] | Zhang X, Liu XQ, Zhang LF, Niu B, Zhao L, Gu S (2017). Energy balance of an artificial grassland in the Three-River Source Region of the Qinghai-Tibet Plateau. Acta Ecologica Sinica, 37,4973-4983. |
| [ 张翔, 刘晓琴, 张立锋, 牛犇, 赵亮, 古松 (2017). 青藏高原三江源区人工草地能量平衡的变化特征. 生态学报, 37,4973-4983.] | |
| [32] |
Zhu Gf, Lu L, Su YH, Wang XF, Cui X, Ma JZ, He JH, Zhang K, Li CB (2014). Energy flux partitioning and evapotranspiration in a sub-alpine spruce forest ecosystem. Hydrological Processes, 28,5093-5104.
DOI URL |
| [33] |
Yu GR, Zhu XJ, Fu YL, He HL, Wang QF, Wen XF, Li XR, Zhang LM, Zhang L, Su W, Li SG, Sun XM, Zhang YP, Zhang JH, Yan JH, et al. (2013). Spatial patterns and climate drivers of carbon fluxes in terrestrial ecosystems of China. Global Change Biology, 19,798-810.
DOI URL |
| [1] | 曹伊菲, 苏涛, 曹敏, 汪海燕, 杨洁. 新生代被子植物叶脉密度演化的驱动因素研究:气候适应与植食压力[J]. , 2027, 51(动植物互作): 0-. |
| [2] | 刘志祥, 黎凤兰, 黄晓磊. 昆虫虫瘿生态系统的复杂性及成瘿机制研究进展[J]. , 2027, 51(动植物互作): 0-. |
| [3] | 谭秋颜, 张清, 高程, 褚海燕, 杨腾. 外生菌根真菌: 高寒生态系统碳氮循环的关键驱动者[J]. 植物生态学报, 2026, 50(3): 584-599. |
| [4] | 马建辉, 童鑫, 张思榕, 毛子昆, 秦俊, 马克平. 菌根真菌生理生态功能研究进展及展望[J]. 植物生态学报, 2026, 50(3): 498-514. |
| [5] | 方迪, 马宁, 李胜功, 郑甲佳, 褚云馨, 杨锦昌, 杨赞明, 张龙宁, 孟盛旺, 高德才, 戴晓琴, 付晓莉, 王辉民, 寇亮. 菌根共生类型对森林养分内循环的调控作用[J]. 植物生态学报, 2026, 50(3): 552-565. |
| [6] | 冉佳鑫, 何舒婷, 罗素萍, 王云, 毛超. 森林土壤氮转化速率特征及其影响因素[J]. 植物生态学报, 2026, 50(1): 45-54. |
| [7] | 赵琨, 王云琦, 梁军, 周小舟, 冯印成, 祁子寒, 李俊杰, 崔芯蕊, 刘烜沃, 毛维. 不同时间尺度下缙云山针阔混交林能量通量特征及影响因子分析[J]. 植物生态学报, 2026, 50(1): 70-81. |
| [8] | 常鹏飞, 李平, 纳尔斯格, 王静, 王振华, 杨森, 贾舟, 杨璐, 刘玲莉, 邓美凤. 内蒙古温带草原不同草地类型土壤有机碳和无机碳储量对总碳储量的贡献及其驱动因素[J]. 植物生态学报, 2025, 49(9): 1374-1387. |
| [9] | 王立龙, 冯静, 苏娜, 刘新平, 潘成臣, 李玉强. 2005-2015年科尔沁沙地典型农田生态系统长期监测样地玉米收获期性状和产量数据集[J]. 植物生态学报, 2025, 49(8): 1293-1300. |
| [10] | 周志琼, 丁建林, 李晓明, 何其华. 2005-2010年西南山地人工林长期监测样地植物物种组成与群落特征数据集[J]. 植物生态学报, 2025, 49(8): 1255-1262. |
| [11] | 王鹏, 李向义, 高艳菊, 热甫开提·沙比提, 曾凡江. 2005-2010年塔克拉玛干沙漠南缘绿洲农田长期监测样地棉花收获期性状和产量数据集[J]. 植物生态学报, 2025, 49(8): 1329-1338. |
| [12] | 朱喜, 何志斌, 杜明武, 赵丽雯, 吴丹丹. 2004-2010年河西走廊中段绿洲农田生态系统长期监测样地作物性状和产量数据集[J]. 植物生态学报, 2025, 49(8): 1312-1320. |
| [13] | 张琳, 袁伟影, 宋创业, 吴冬秀. 1998-2010年中国典型生态系统长期监测样地环境要素、物种丰富度和生物量动态数据集[J]. 植物生态学报, 2025, 49(8): 1182-1190. |
| [14] | 张琳, 陈华阳, 黄振英. 2004-2010年鄂尔多斯沙地草地长期监测样地植物物种组成和群落特征数据集[J]. 植物生态学报, 2025, 49(8): 1263-1270. |
| [15] | 范亚冉, 夏少攀, 于冰冰, 朱紫琪, 杨威, 范豫川, 刘晓雨, 张旭辉, 郑聚锋. 大气CO2浓度升高和增温对土壤有机碳库积累、分子组成和结构稳定性的影响[J]. 植物生态学报, 2025, 49(7): 1053-1069. |
| 阅读次数 | ||||||
|
全文 |
|
|||||
|
摘要 |
|
|||||
Copyright © 2026 版权所有 《植物生态学报》编辑部
地址: 北京香山南辛村20号, 邮编: 100093
Tel.: 010-62836134, 62836138; Fax: 010-82599431; E-mail: apes@ibcas.ac.cn, cjpe@ibcas.ac.cn
备案号: 京ICP备16067583号-19

